
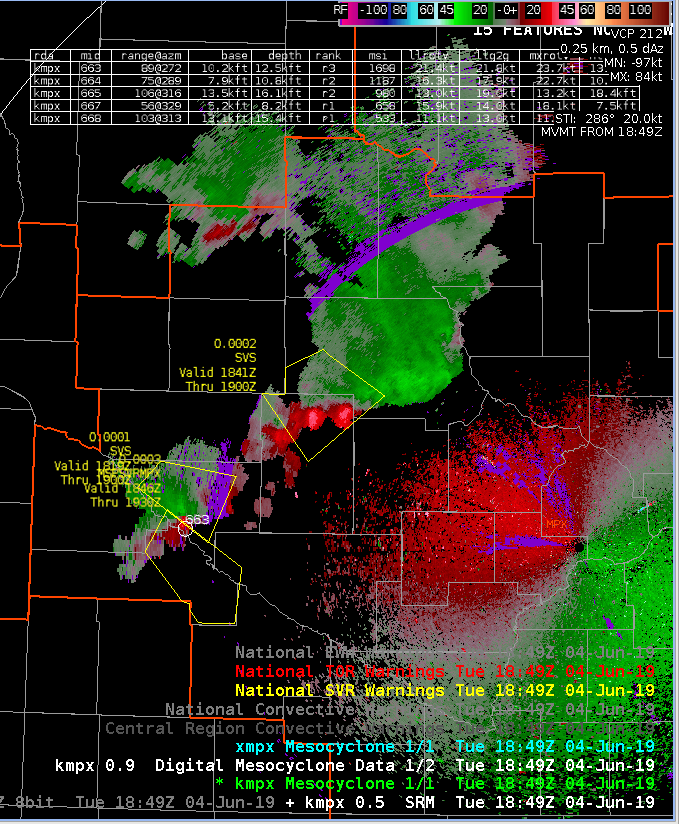
Storm riding between two warnings was anticyclonically rotating through several radar tilts. NMDA not supposed to pick up on those, and it didn’t. DMD only one with a meso in the line of storms, but more on the edge of that rotation.
Official websites use .gov
A
.gov website belongs to an official government
organization in the United States.
Secure .gov websites use HTTPS
A
lock (
) or https:// means you’ve safely connected to
the .gov website. Share sensitive information only on official,
secure websites.

Storm riding between two warnings was anticyclonically rotating through several radar tilts. NMDA not supposed to pick up on those, and it didn’t. DMD only one with a meso in the line of storms, but more on the edge of that rotation.
Flash extent density focused on that storm as well. Prob severe coming up. Had 50 dBZ to 48 kft and ~115 knot Delta V at storm top.
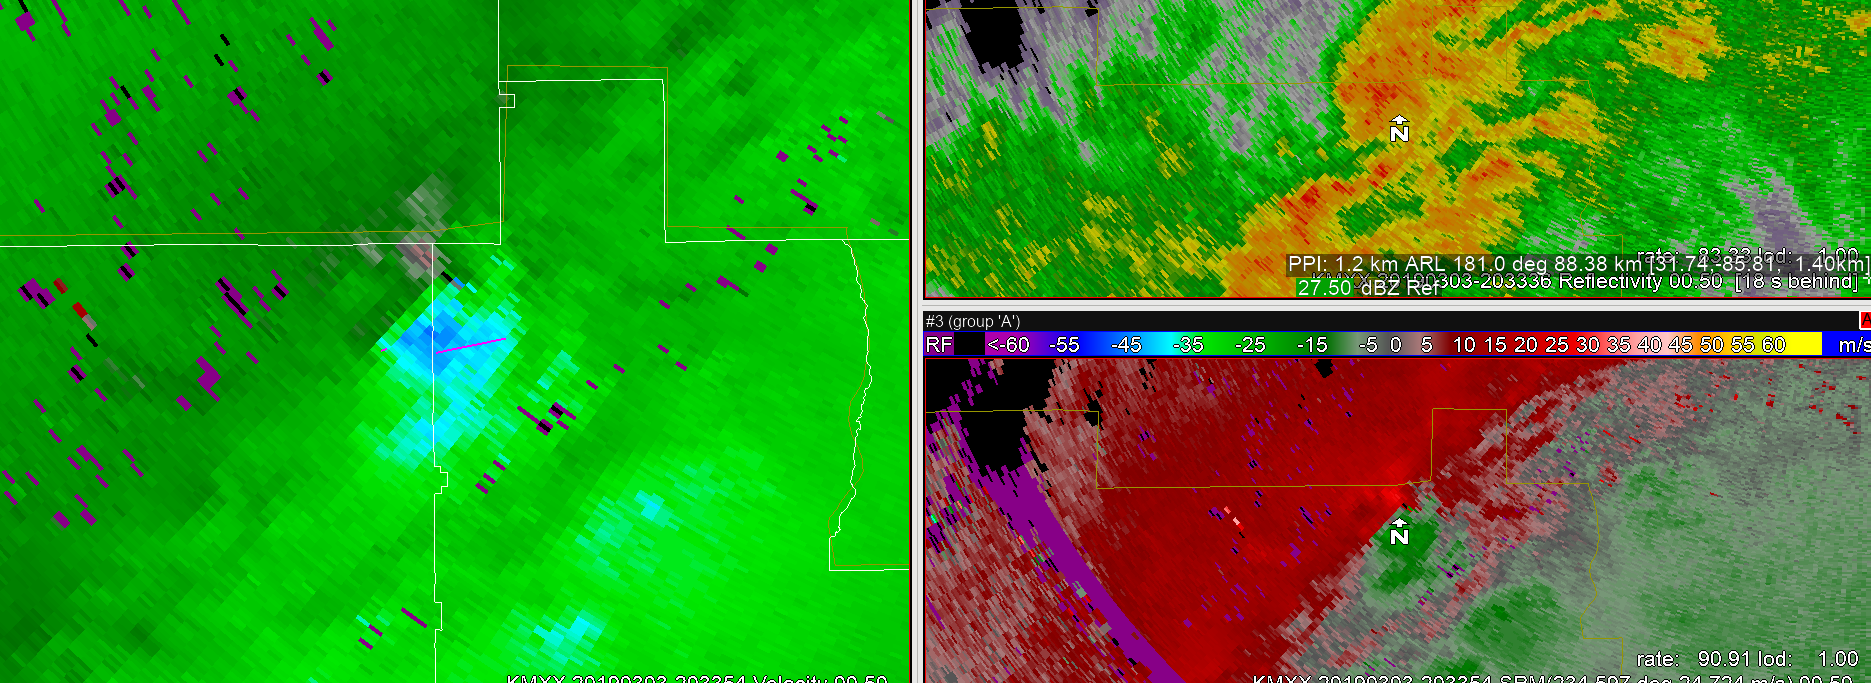
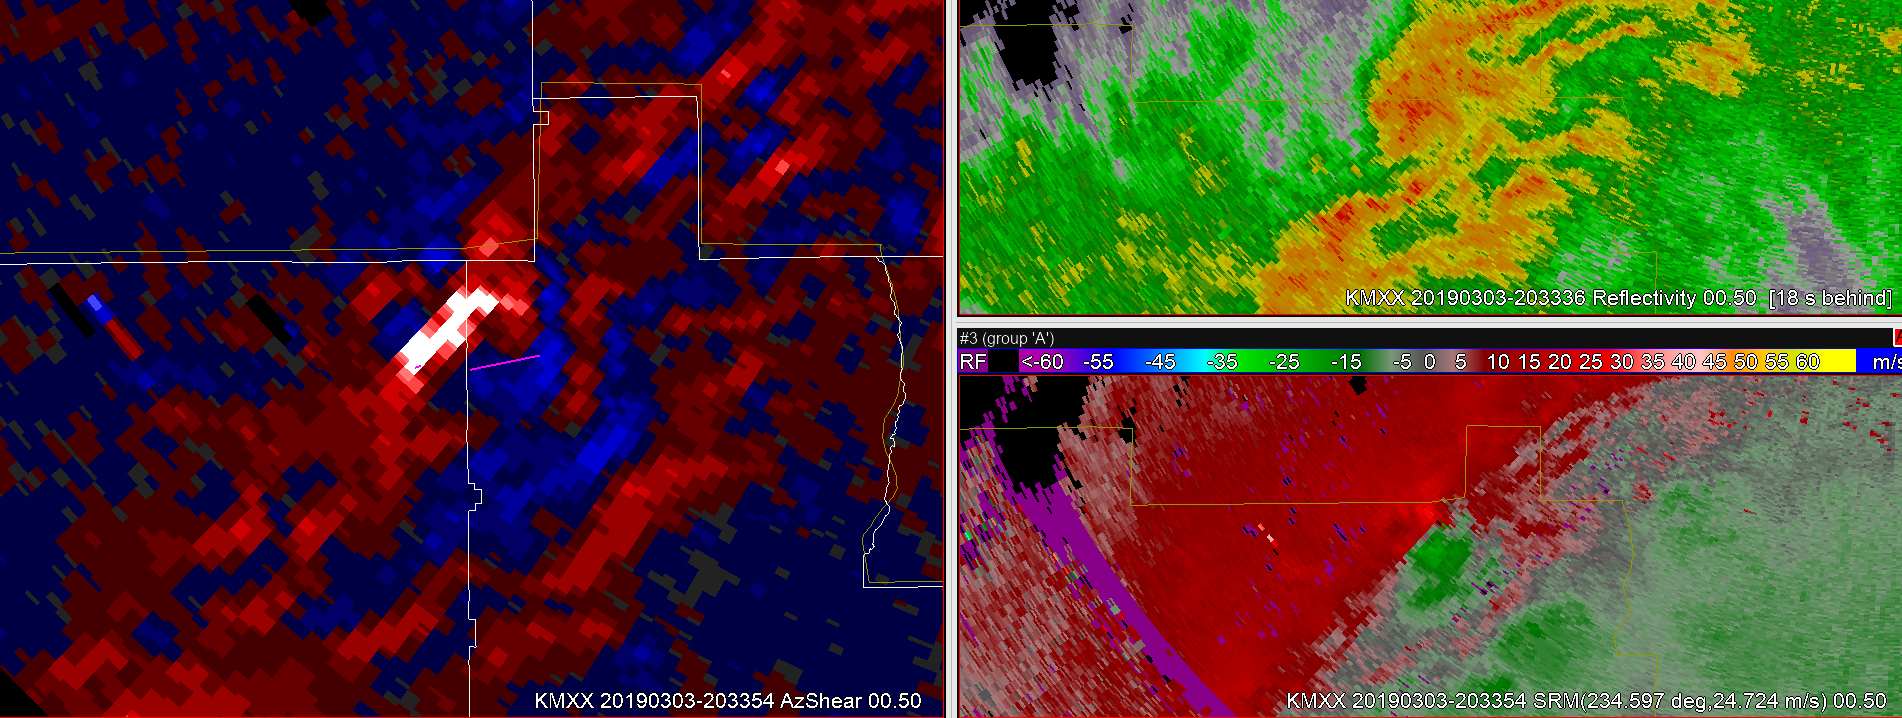
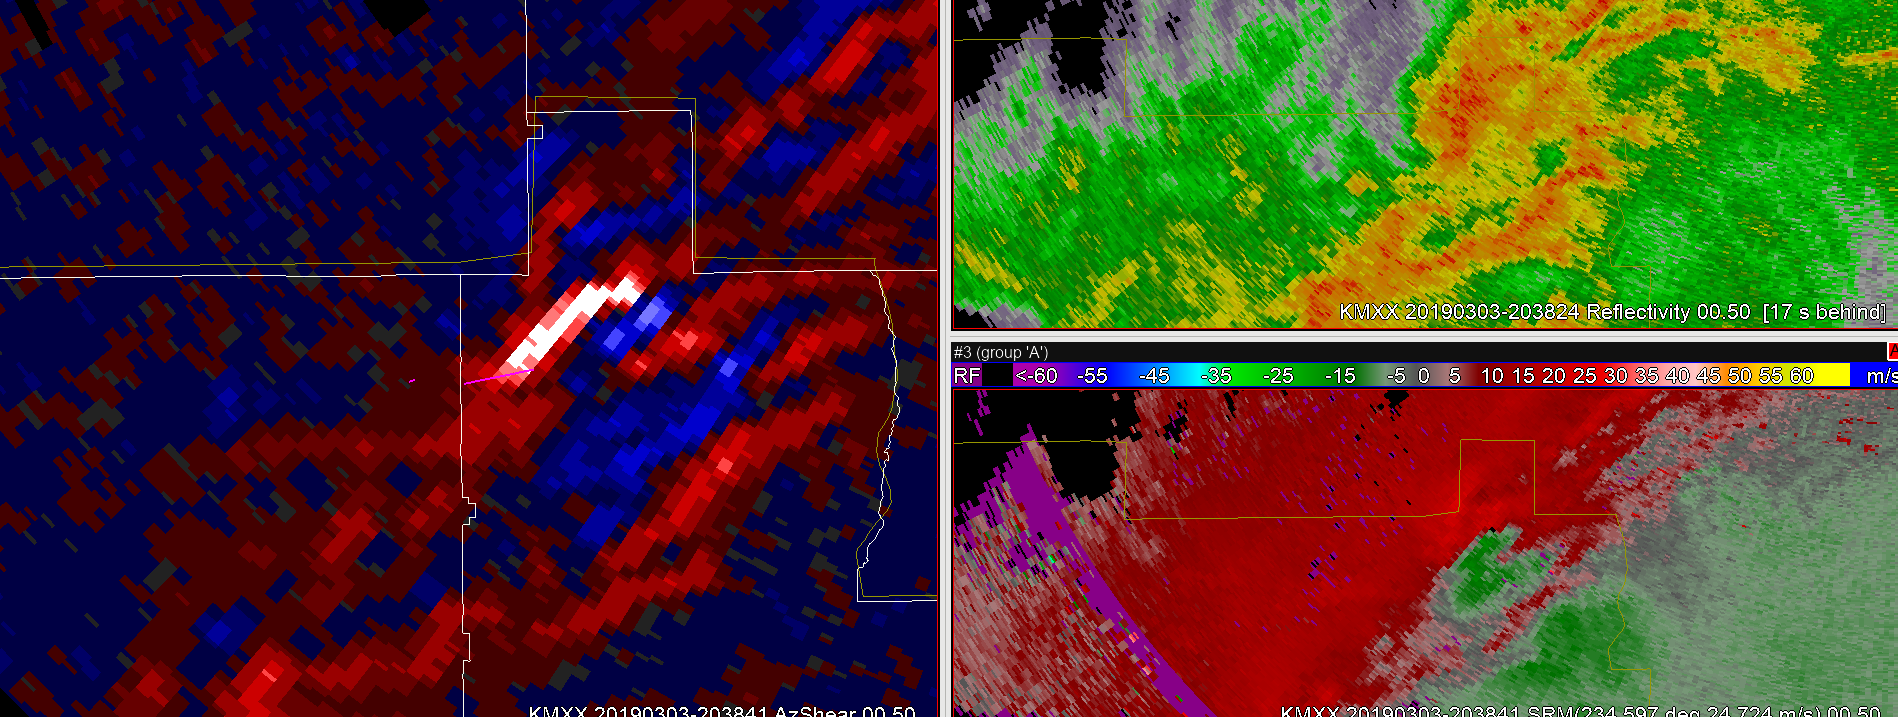
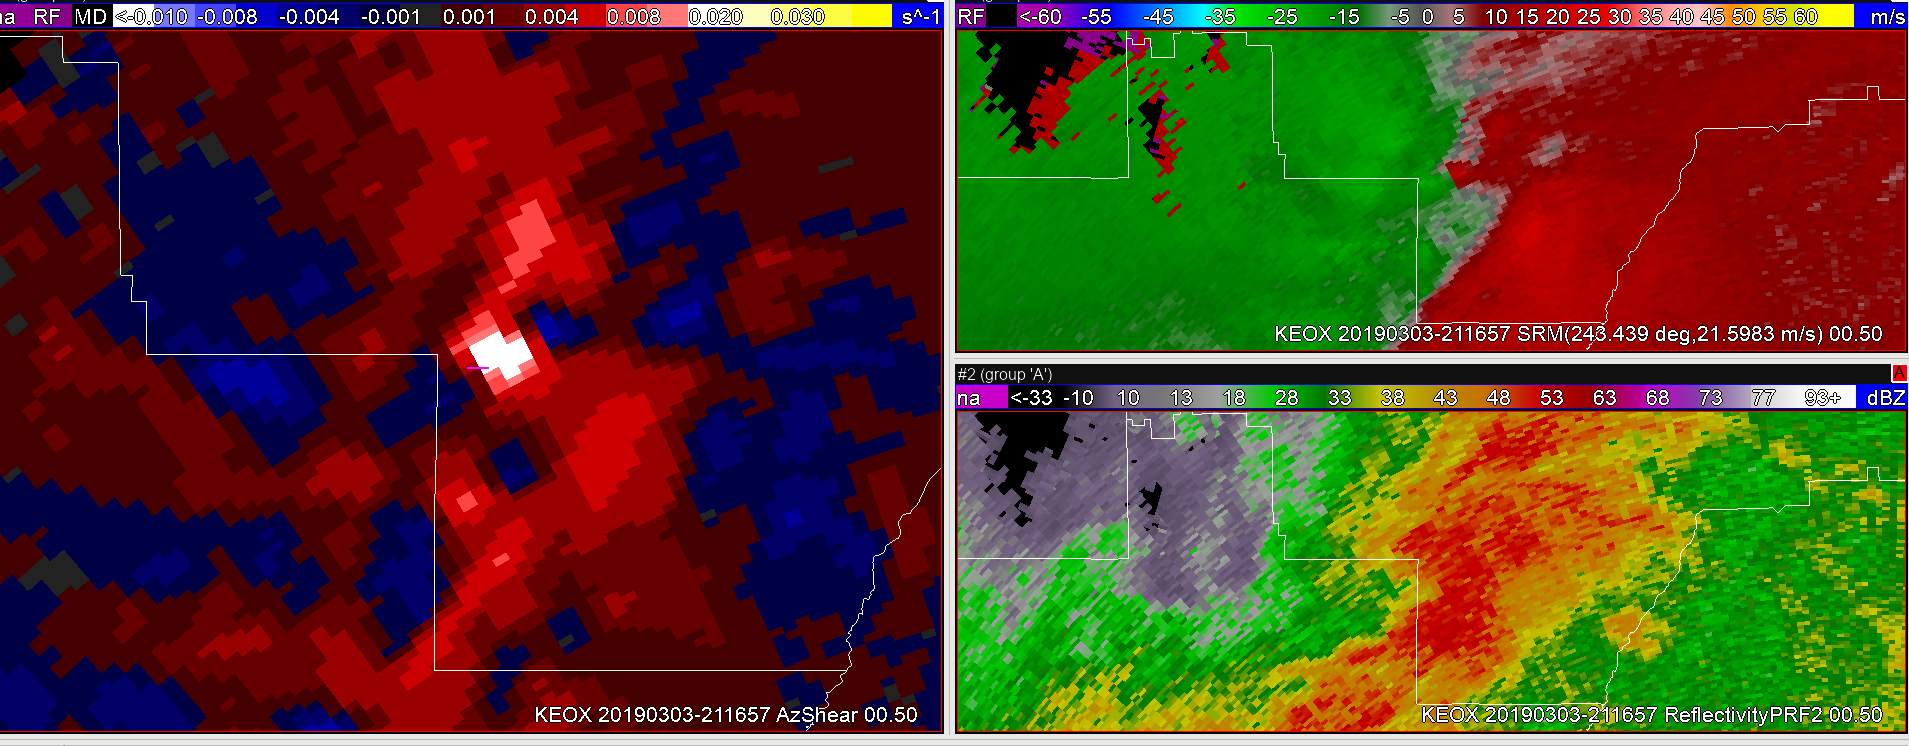
While tracking tornadoes in the beginning of this outbreak, a squall line of heavy convection has been present farther to the west. While notable in reflectivity, the AzShear & Merged AzShear products have been very useful for a quick-glance situational awareness of areas of higher concern for tornadoes. In areas that are equally far from multiple radars, forecasters would have to compare multiple velocity products to adequately interrogate areas along the squall line for rotation, including adjusting for SRM. The AzShear products readily and quickly highlight those areas that should be investigated further.
A secondary tornado near the KMXX radar has developed near the track of the larger tornado earlier. While this one doesn’t look as large, it was more apparent in the AzShear product, and after looking at the SRM of that area, my confidence in the presence of a secondary tornado was increased. 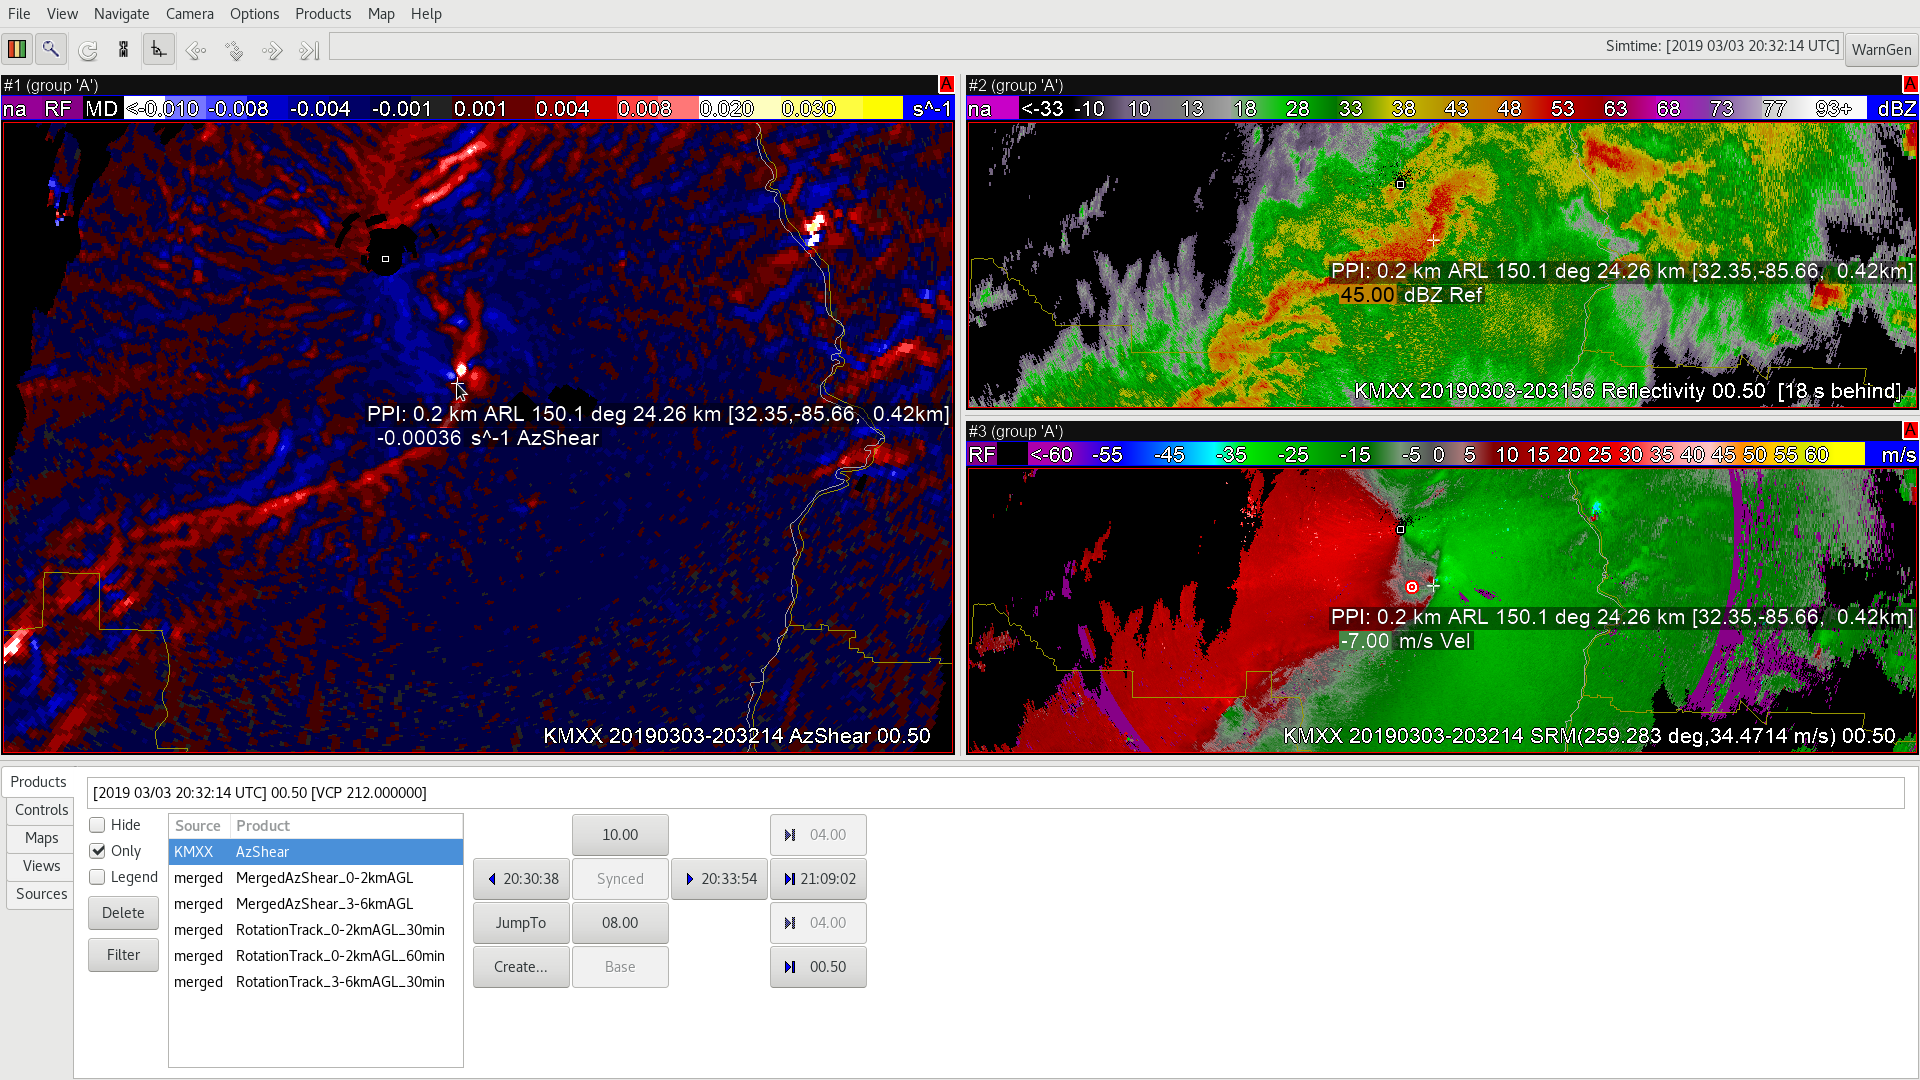
In the wake of the storms, AllSky layered PW products showed the mid levels moistening…leading to the higher Total PW values.
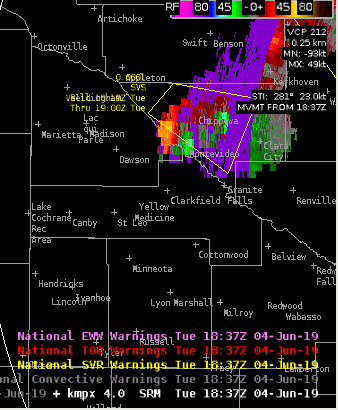
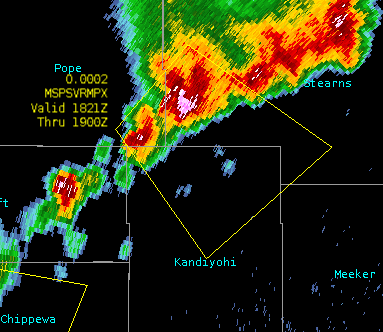
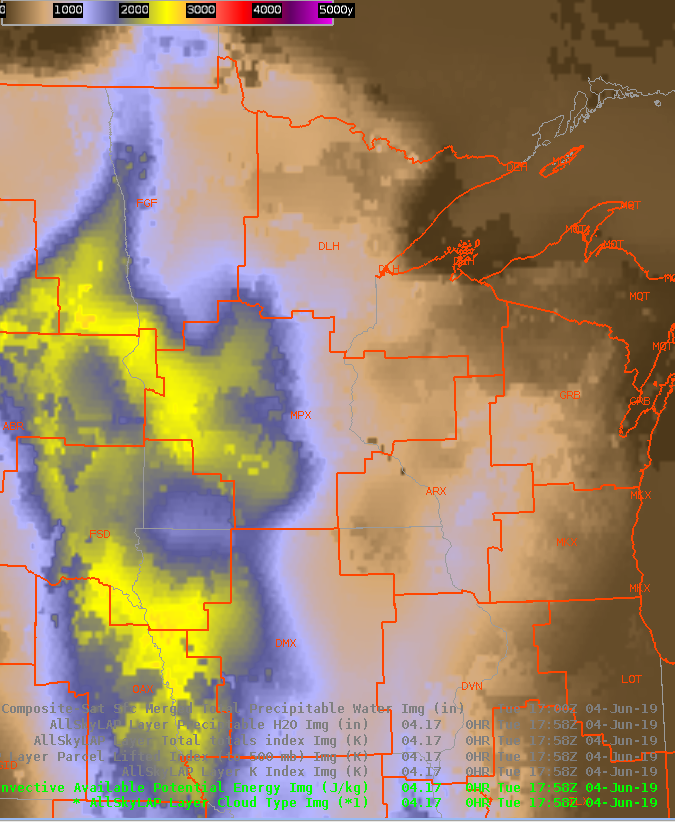
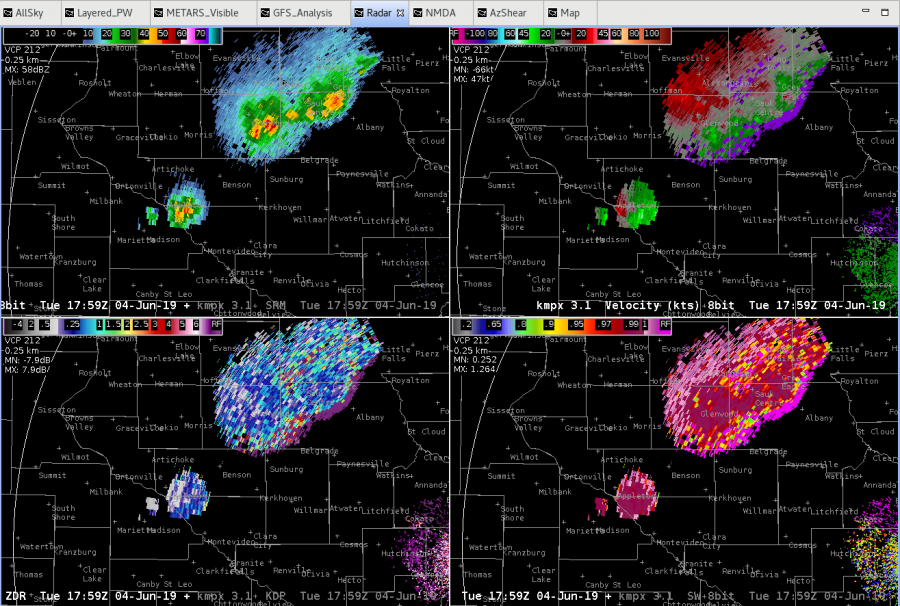
Thunderstorms continued to strengthen in the MPX CWA after 18z. The All Sky LAP CAPE indicated instability building over Kandiyohi County as of 1728z (note some latency). There is a line segement of tstms moving into this area, and a SVR has been issued as of 1821z for the SW part of the line as it moves into the region of higher instability. Note, this development likely triggered along outflow from an earlier complex. The SVR polygon was edged to the SW closer to the higher instability. 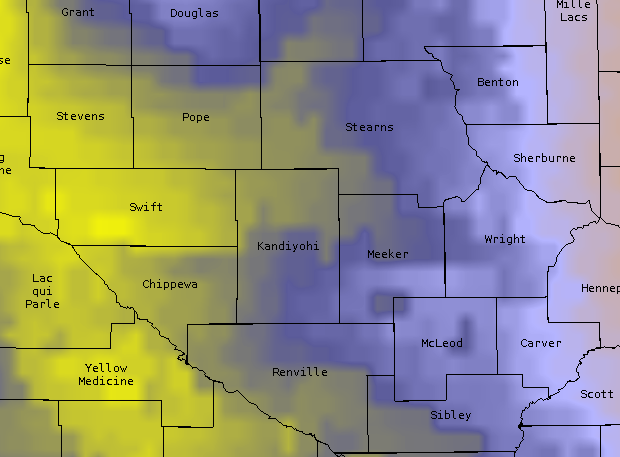
 As of 1834z (not shown) the updrafts on the SW flank of the line continue to become dominant, and ProbSevere has increased to 76%.
We’re analyzing data from March, 2nd 2019 using AzShear along with the typical products used during severe weather. There were multiple tornadoes this day with various types of convective modes. I found Azshear was helpful in identifying tornadic storm that might not have been as easy to spot with conventional methods.
The northernmost storm that had the longest track that started in Macon county Alabama was easy to spot due to it’s structure. It was a discrete cell with a clear couplet and a debris ball. The AzShear max lined up very well with the center of circulation.
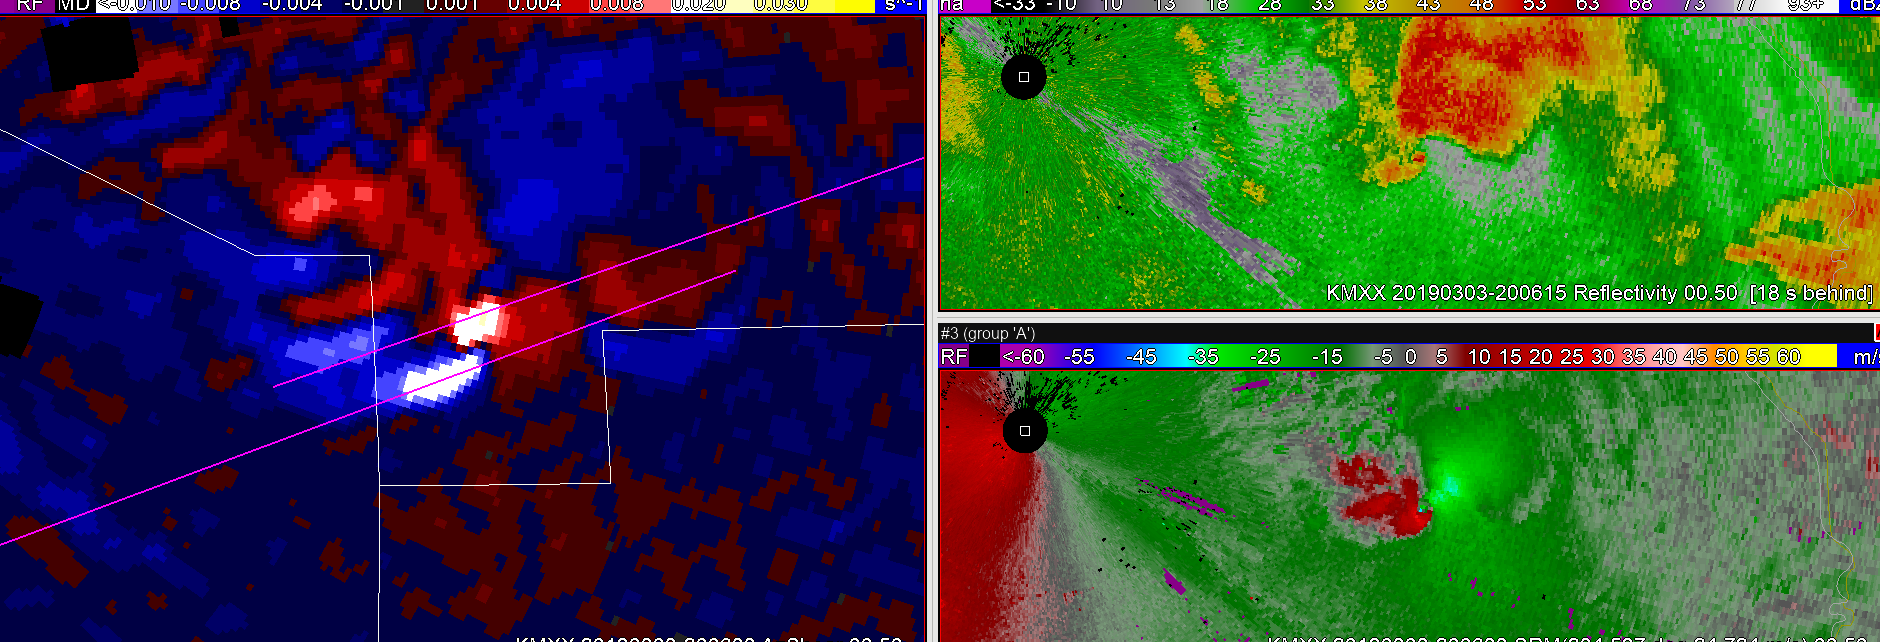
There was also another long track tornado that touched down in central Macon county Alabama and moved into southern Lee county. This cell was embedded in a cluster of storms so it didn’t stick out as much on reflectivity, but the rotation was easy to spot early on using SRM velocity.
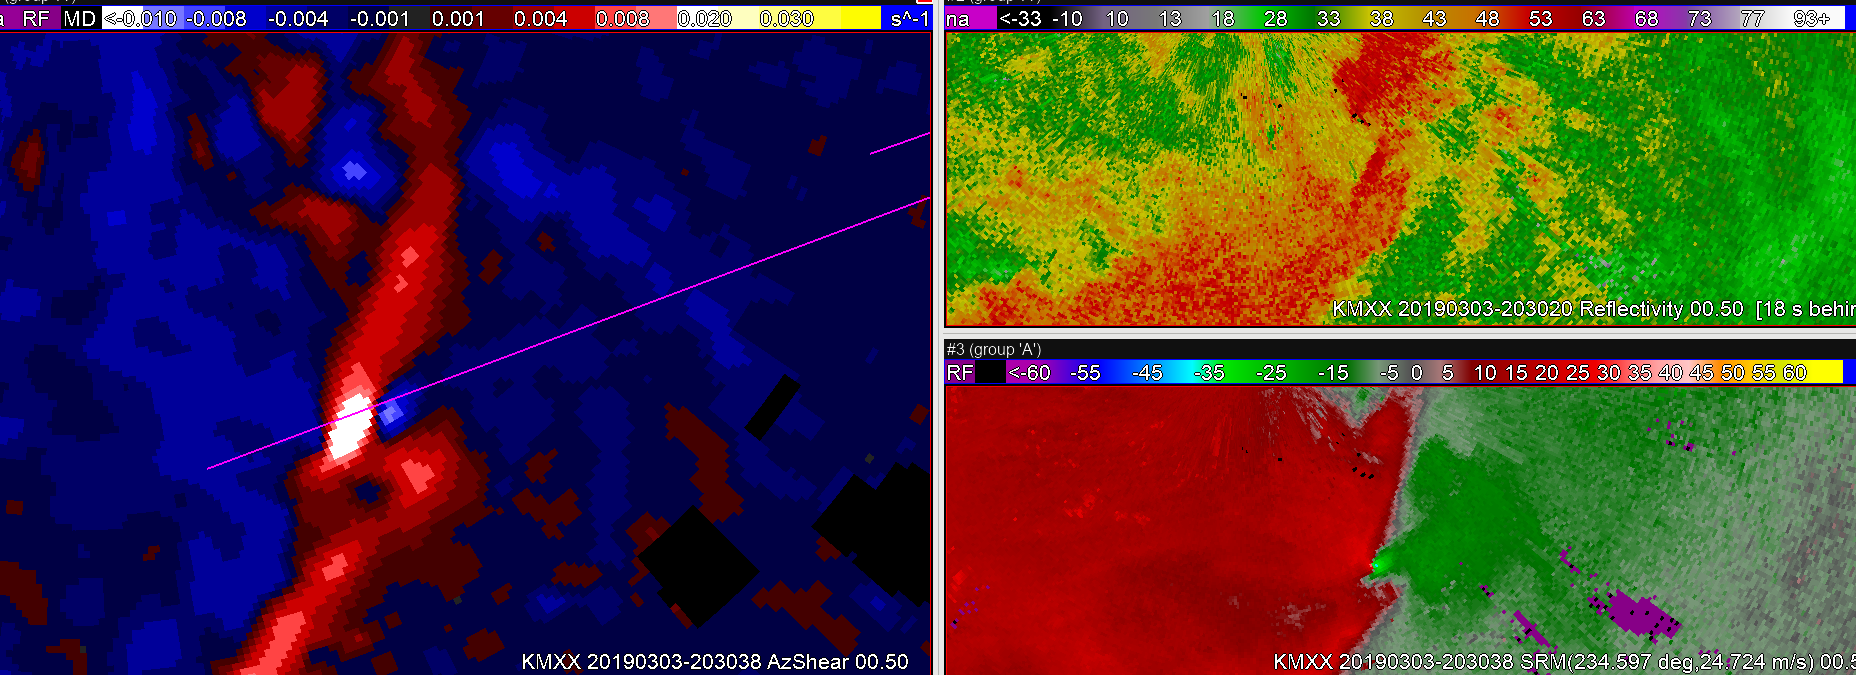
As the cell moved northeast, a bit further from radar, the velocity signature wasn’t as pronounced. However, the AzShear value stayed very strong. It stayed pronounced even going up in elevation scans compared to SRM velocity. 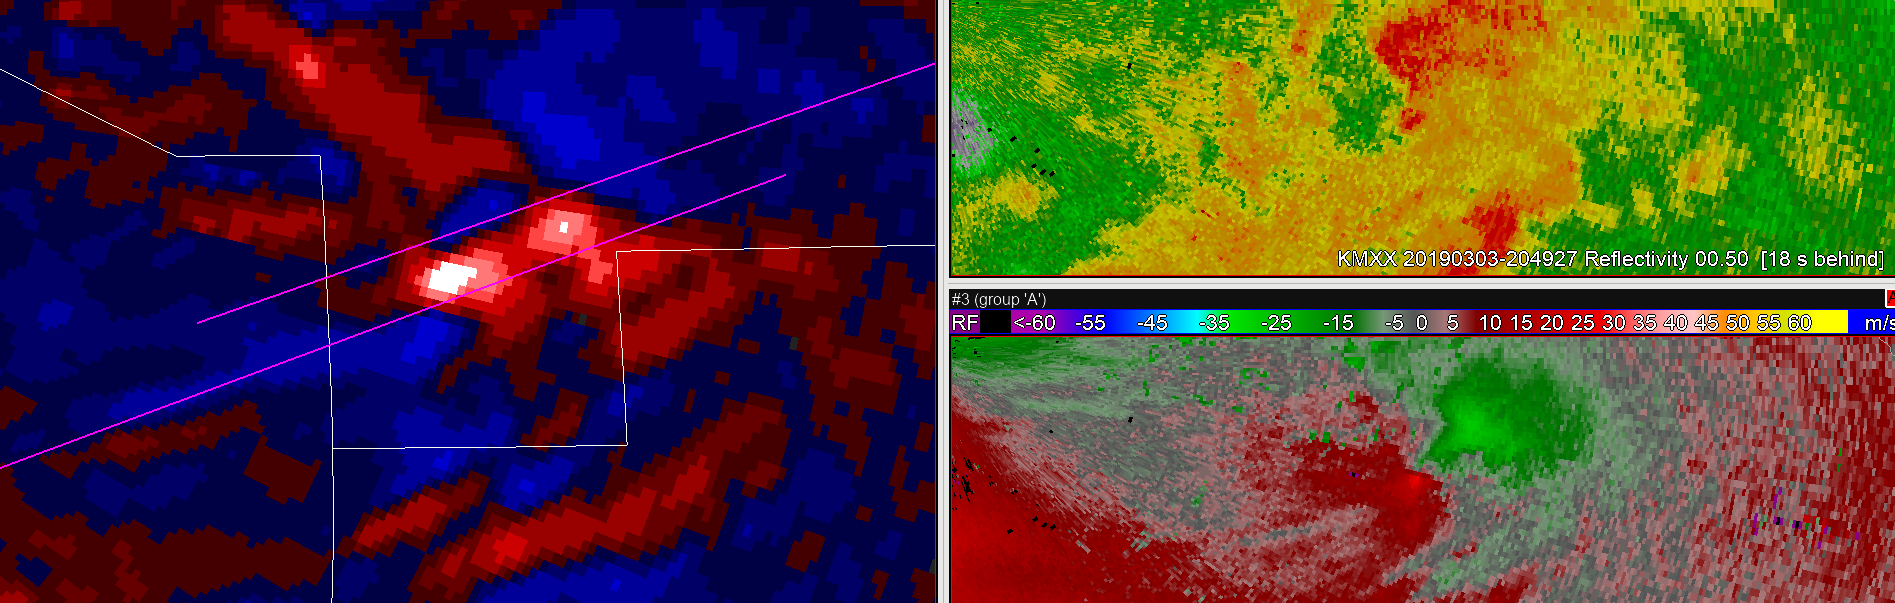 There was a pronounced max in the merged AzShear 0-2km as well.
There were also two touchdowns from one cell in Butler and Crenshaw county. Using the KMXX radar the rotation was clear using base velocity, but the reflectivity signature wasn’t as clear.
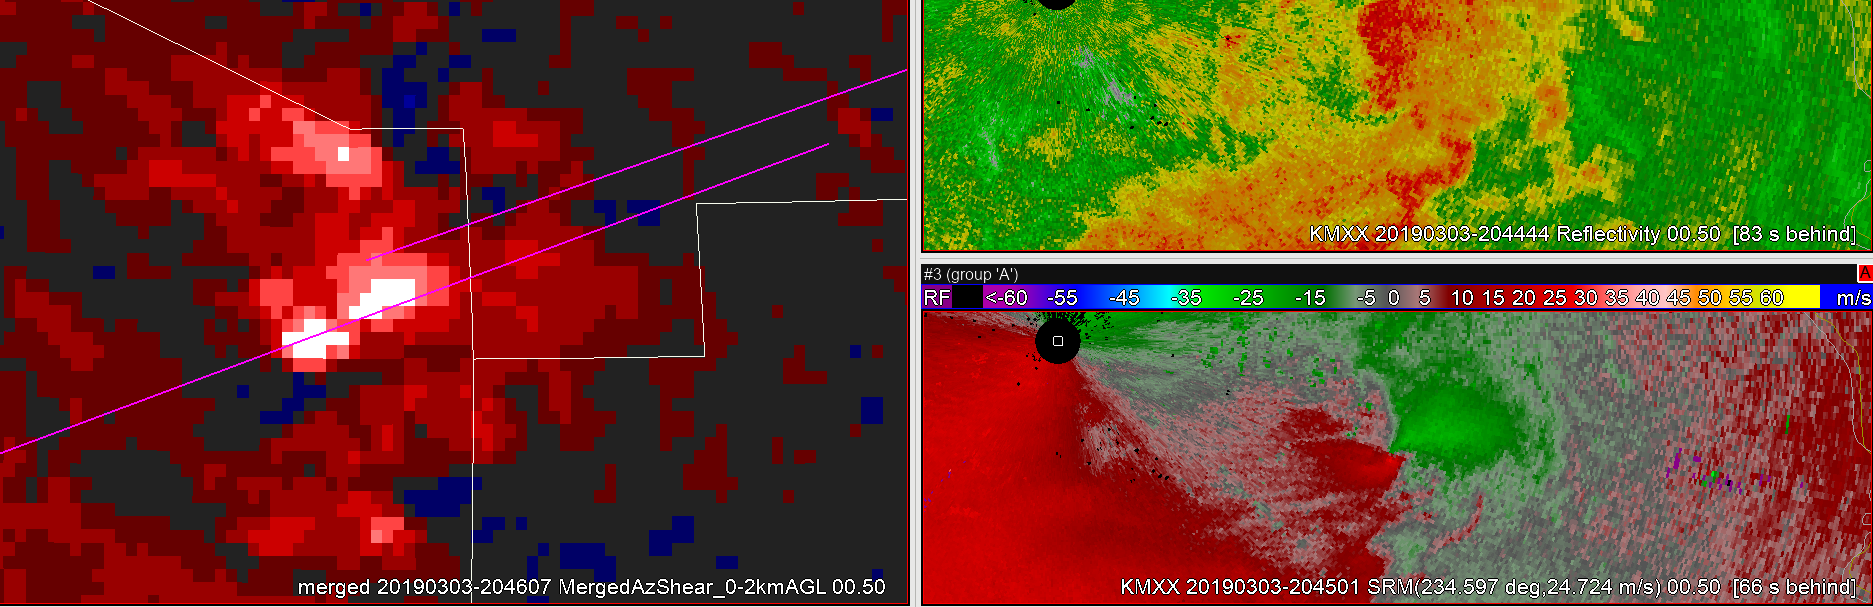
The AzShear signature was very apparent from KMXX along with the 0-2km merged shear.
That max stayed strong through the second touchdown in Crenshaw county.
The rotation max also aligned with the tornado patch. Increasing confidence during now casting that there was likely a tornado on the ground. That would be helpful since there wasn’t a TDS with this particular cell.
Farther south there was a quick touchdown in Bullock county. The velocity couplet was apparent from the KEOX radar, but not very strong. The cell was a part of a larger line with “messy” convection. However, there was a clear spike in AzShear as it moved into Bullock county. The negative value wasn’t as high as well and that made it easier for me to spot the area that had a likely touchdown.
Overall, given the other products that I normally use the AzShear was most helpful in situations where convection is in a linear mode or if you have a cluster of storms. It also made it easier to pinpoint rotation when the velocity signature wasn’t as strong due to the distance from radar or other factors. It added another layer of confidence to decision making if I had to cover this warning.
Yesterday I had a problem understanding the difference between the positive spike and the negative spike. However, working with it more today in this particular environment made it easier to understand the product. I would probably adjust the color table to make the negative values less apparent to make the positive gradient stand out more.
-Taylor Johnson
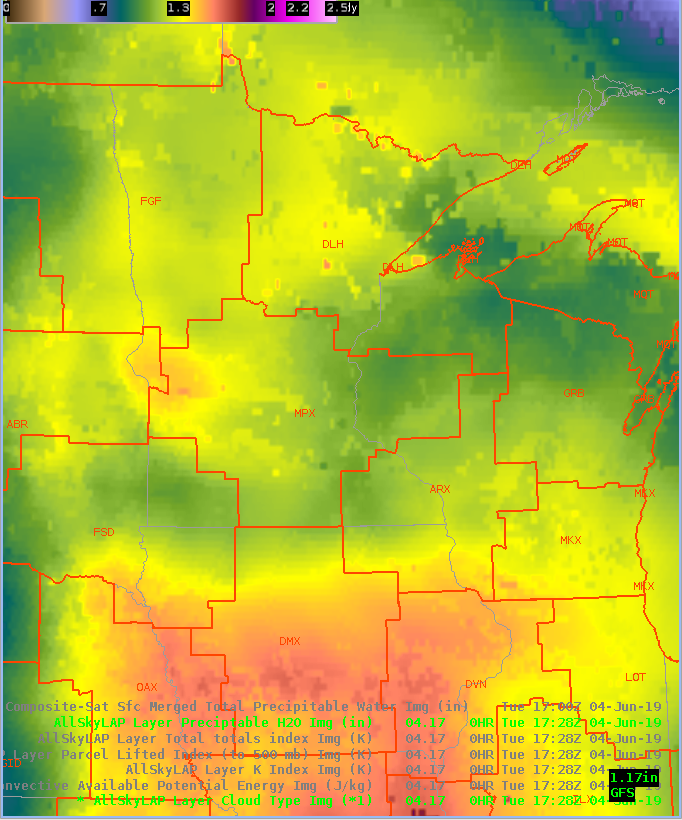
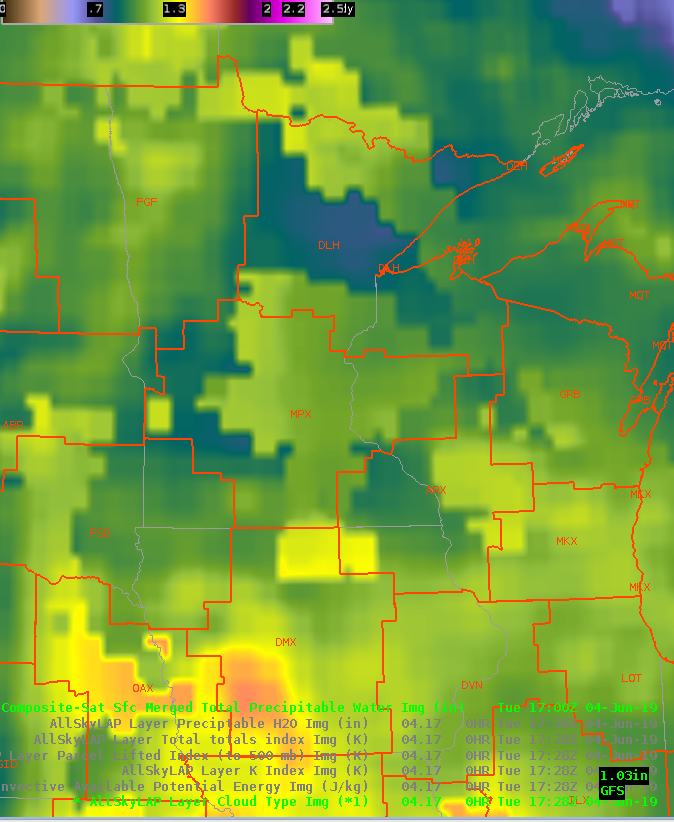
Noticed the AllSky TPW had a seemingly better handle on moisture over western MPX area than the more blotchy Merged TPW. Looking at other instability parameters, the TT were in the mid 50s over western MPX, lifted index, K index upper 30s, CAPE mid 2000s. Eastern storm following the gradient of the CAPE to the southeast. AllSky has shown the CAPE increasing rapidly ahead of our storms.
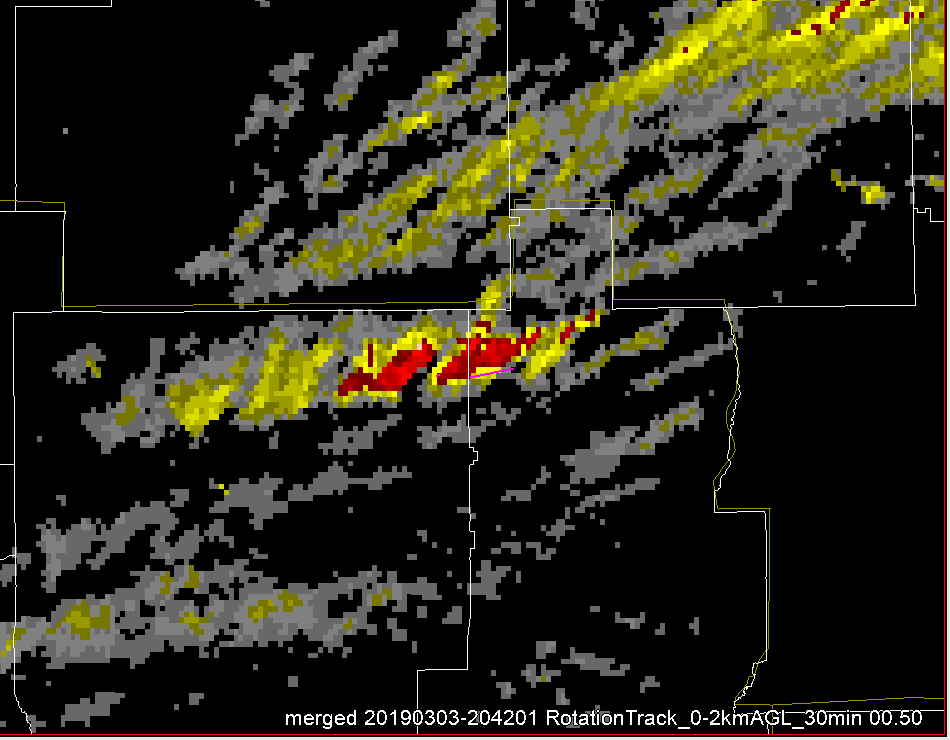
The 30min Rotation Track is useful for a recent history of storm motion and evaluating the historical shear values in the recent half hour. Two other velocity couplets seen farther south of the main tornado in the bottom right Vel window show small tracks in the left window, but shear values are much lower overall. In this case, the 60-min rotation track is a little less useful due to another line of storms moving in from the west. The window is more cluttered, making it harder to single out the exact location of a rotating storm vs a recent storm that has already passed out of the area. 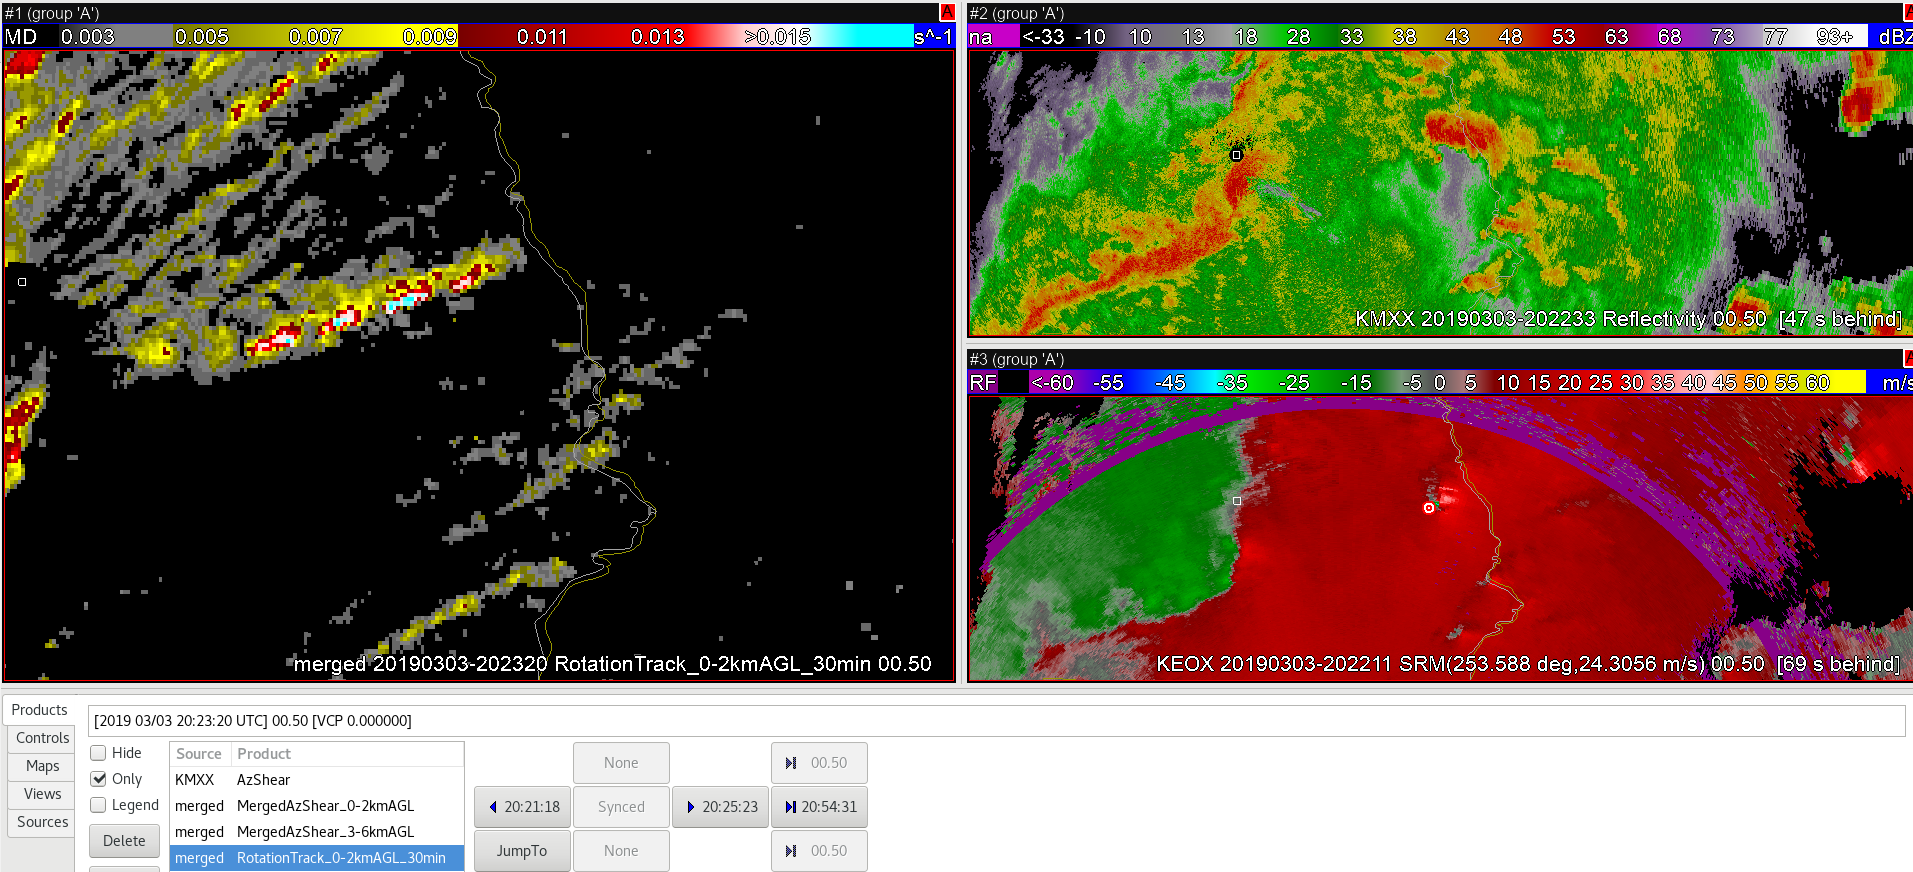
The merged AzShear is quite useful in this case of a large convective system moving through the region. While single radar is useful, the merged product provides a much better overview of the region. Areas of highest shear are readily identifiable and can then be interrogated further with reflectivity and velocity data. My confidence in the existence of a tornado where the merged AzShear is showing white & yellow on the left image is solidified with the corroborating details in the reflectivity and velocity data.
South of the main tornadic signature in velocity, adjusting the velocity for SRM indicates 2 other weak couplets, neither of which I have high confidence are tornadoes on the ground based on the AzShear products. 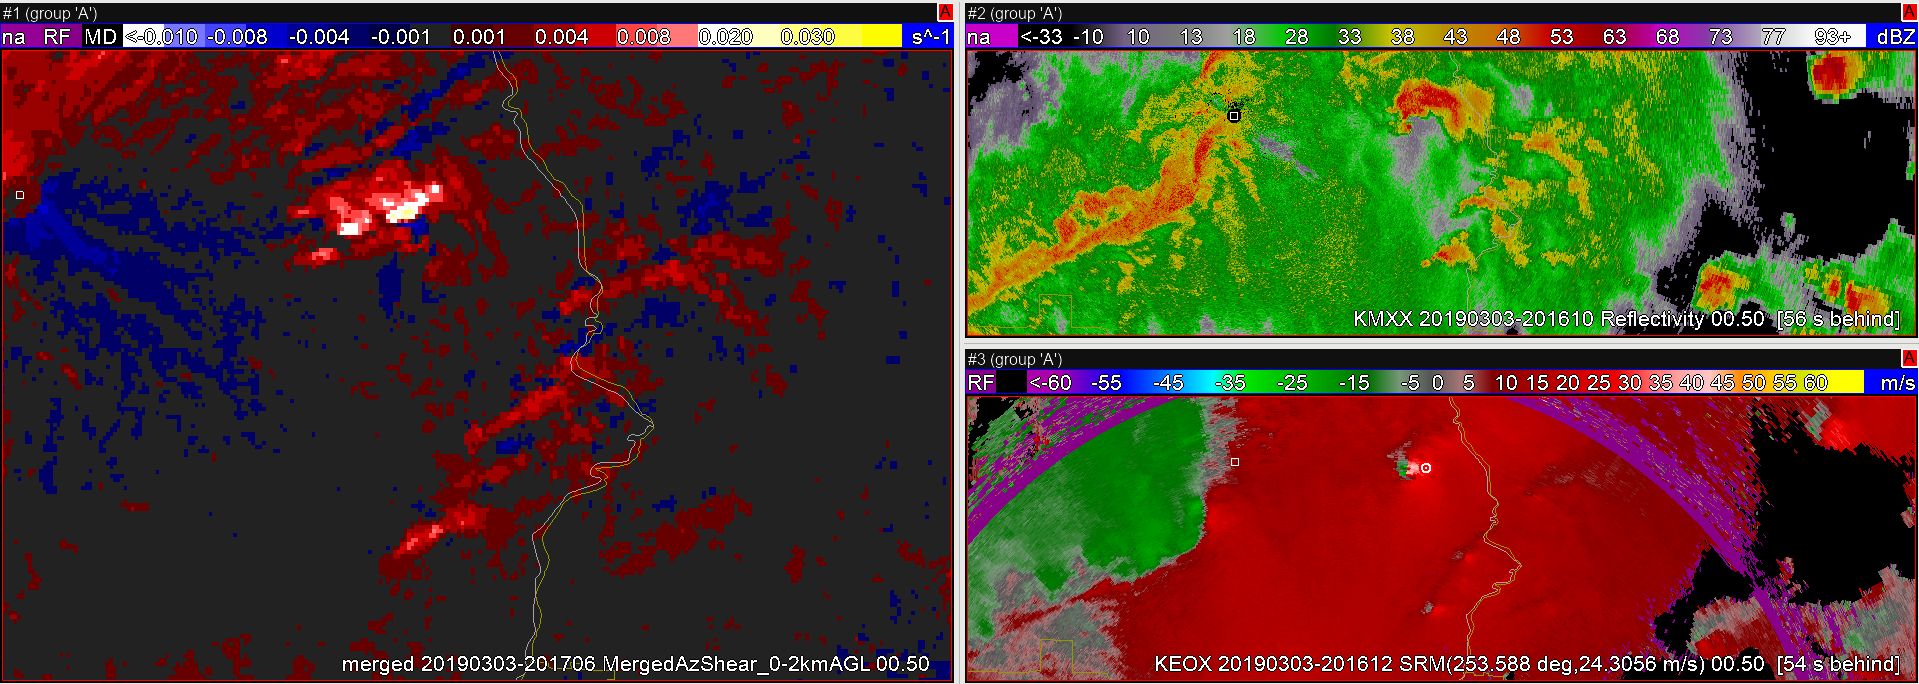
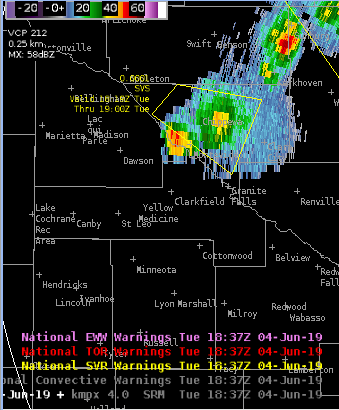
50 dbZ hail core up to 40 kft growing with that southwest cell, along the old outflow and in the high CAPE environment. Donavon heights are around 30 kft, so issued a SVR for this cell for hail to half dollar size.