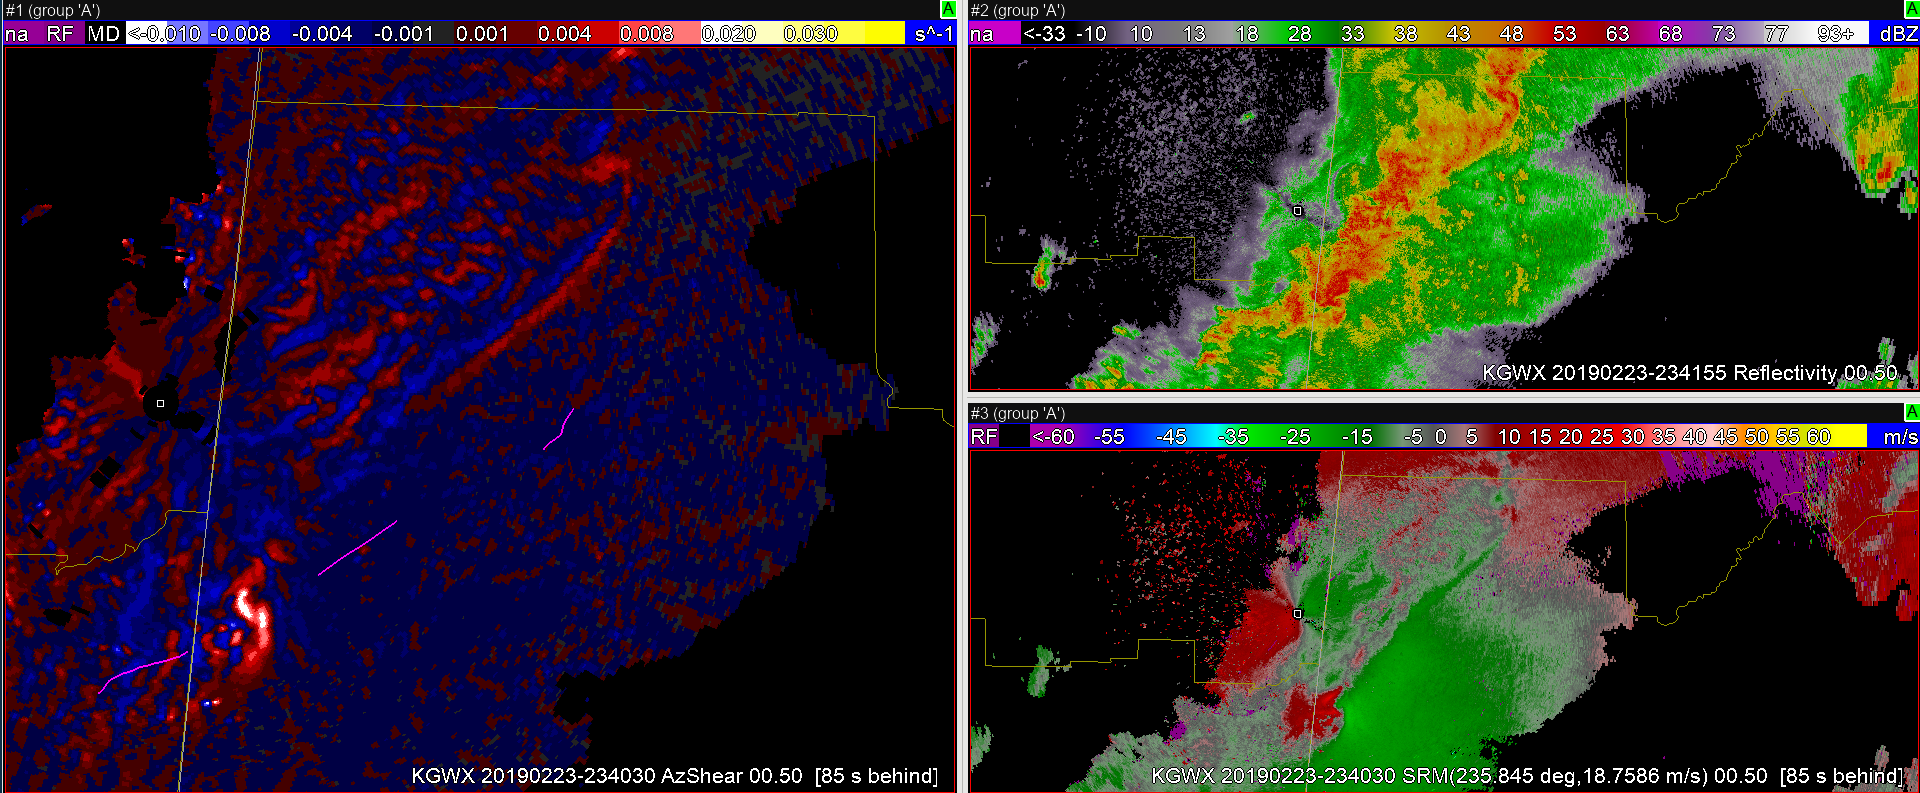
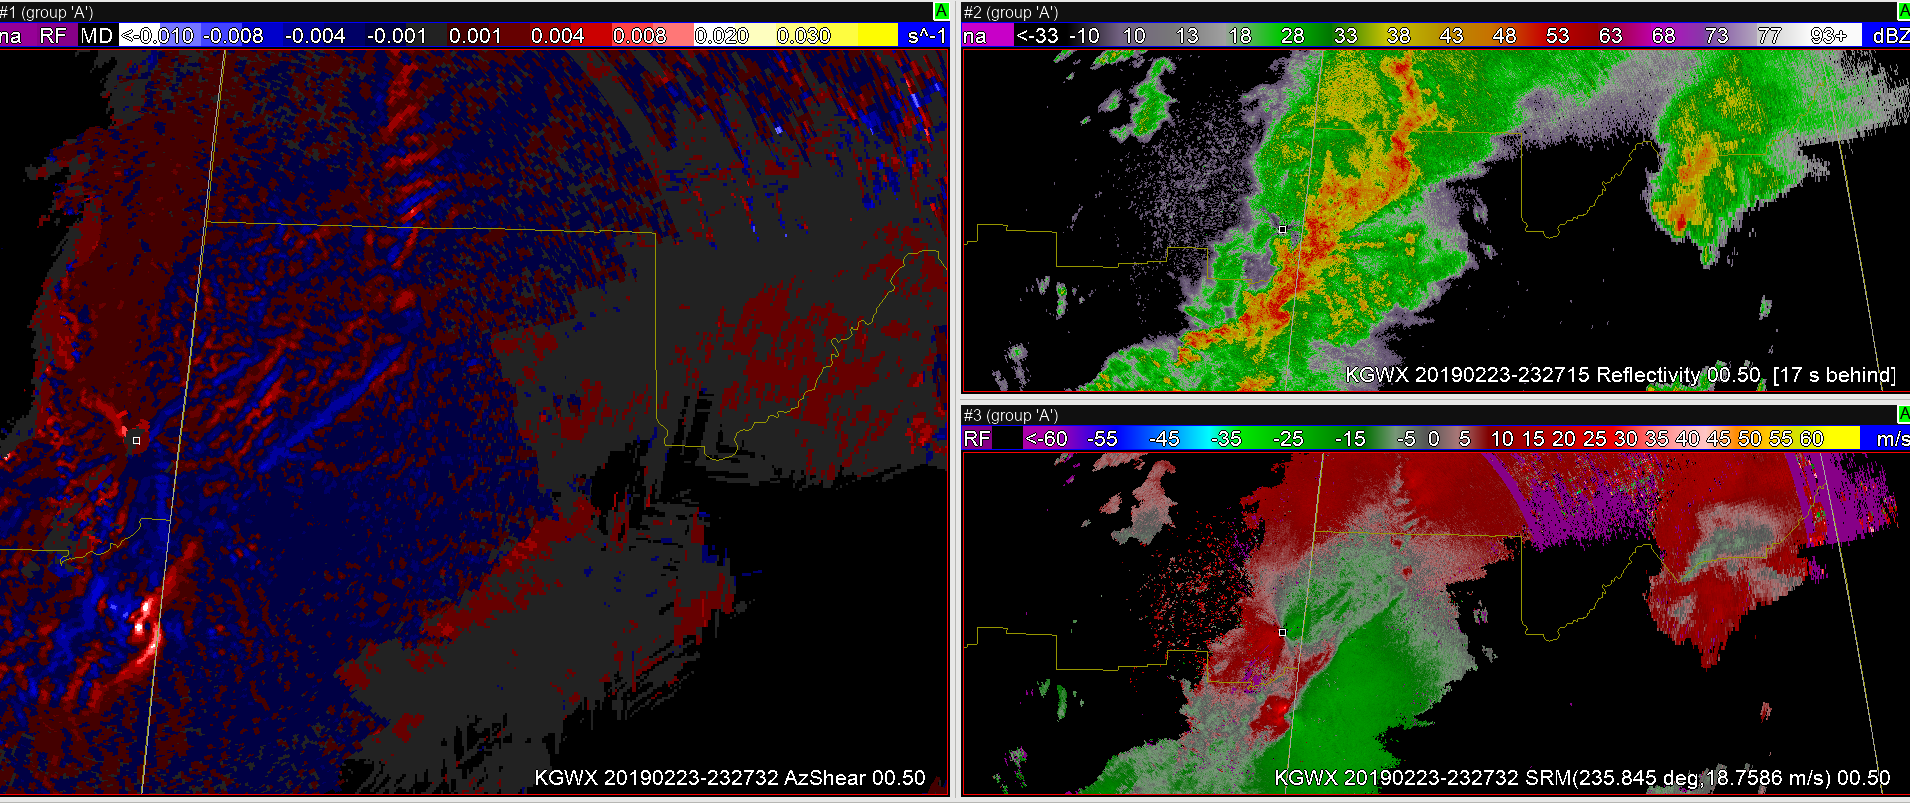
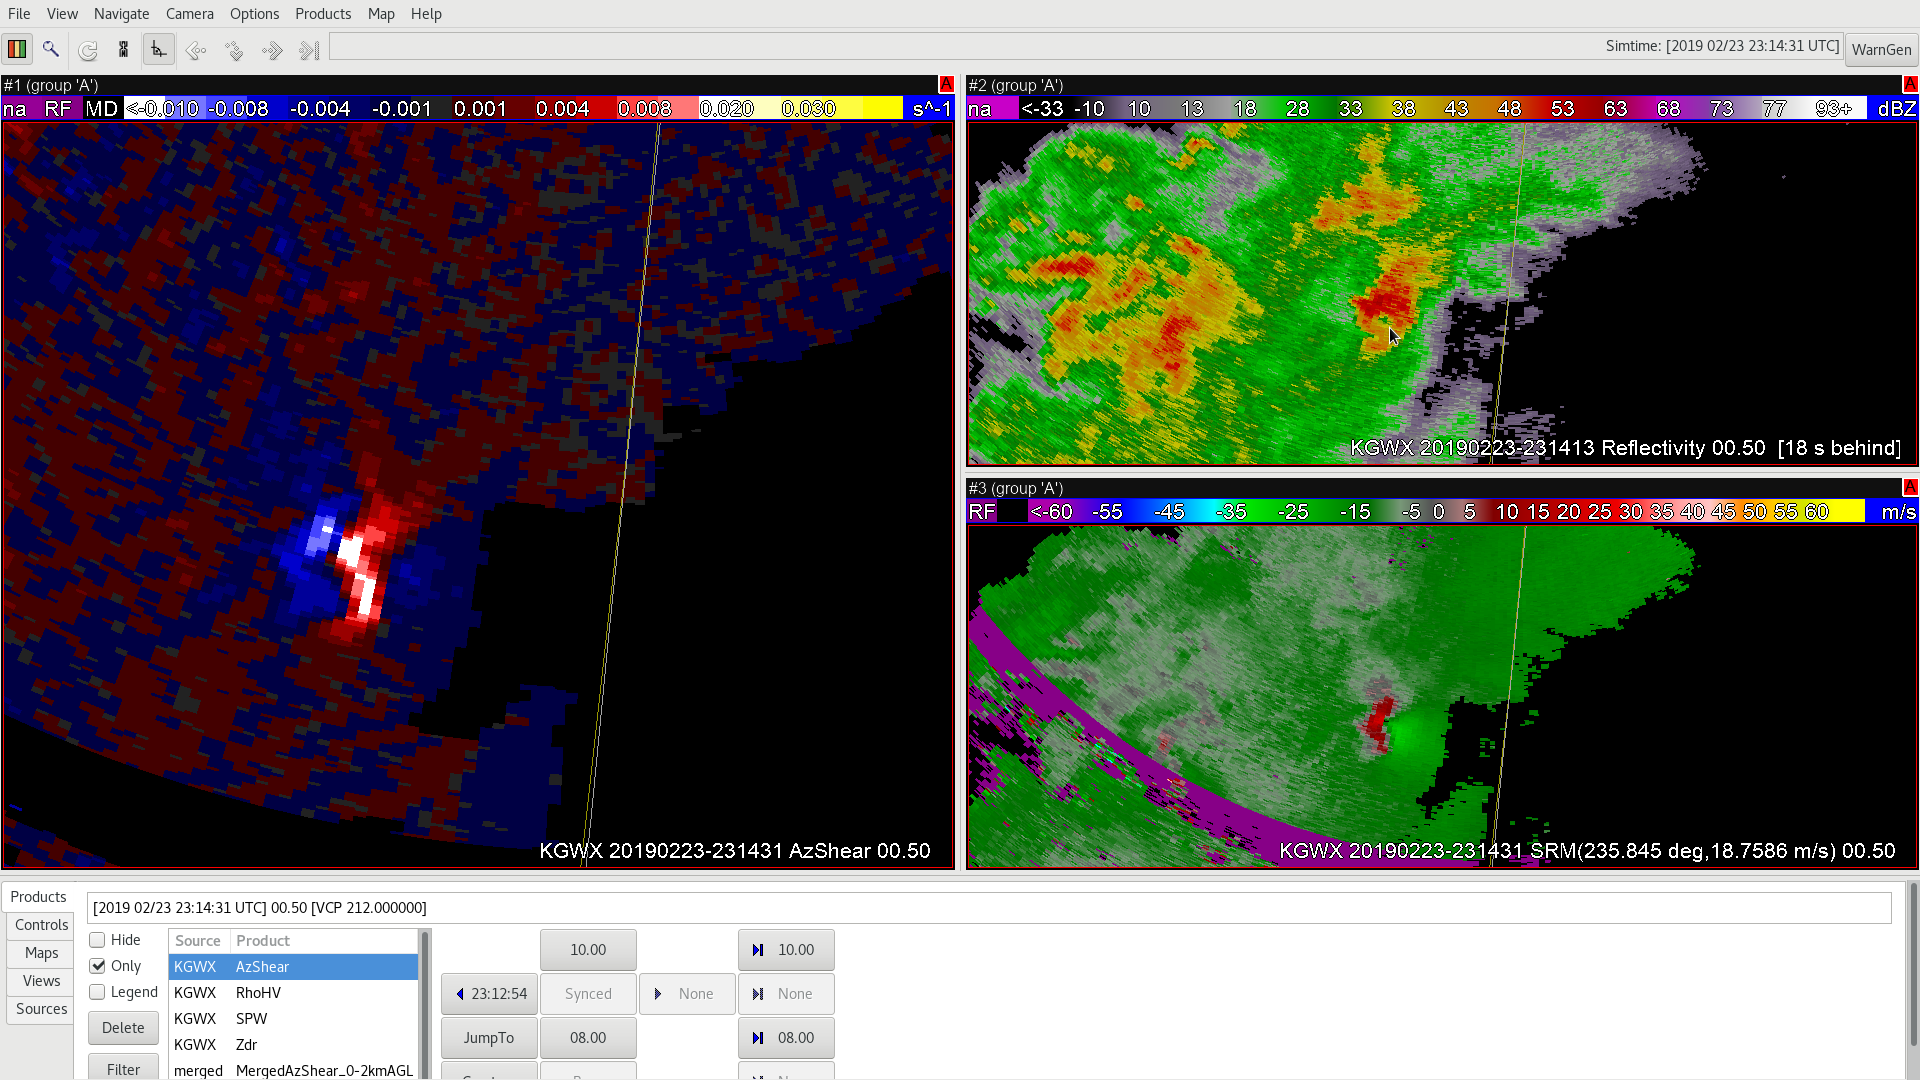
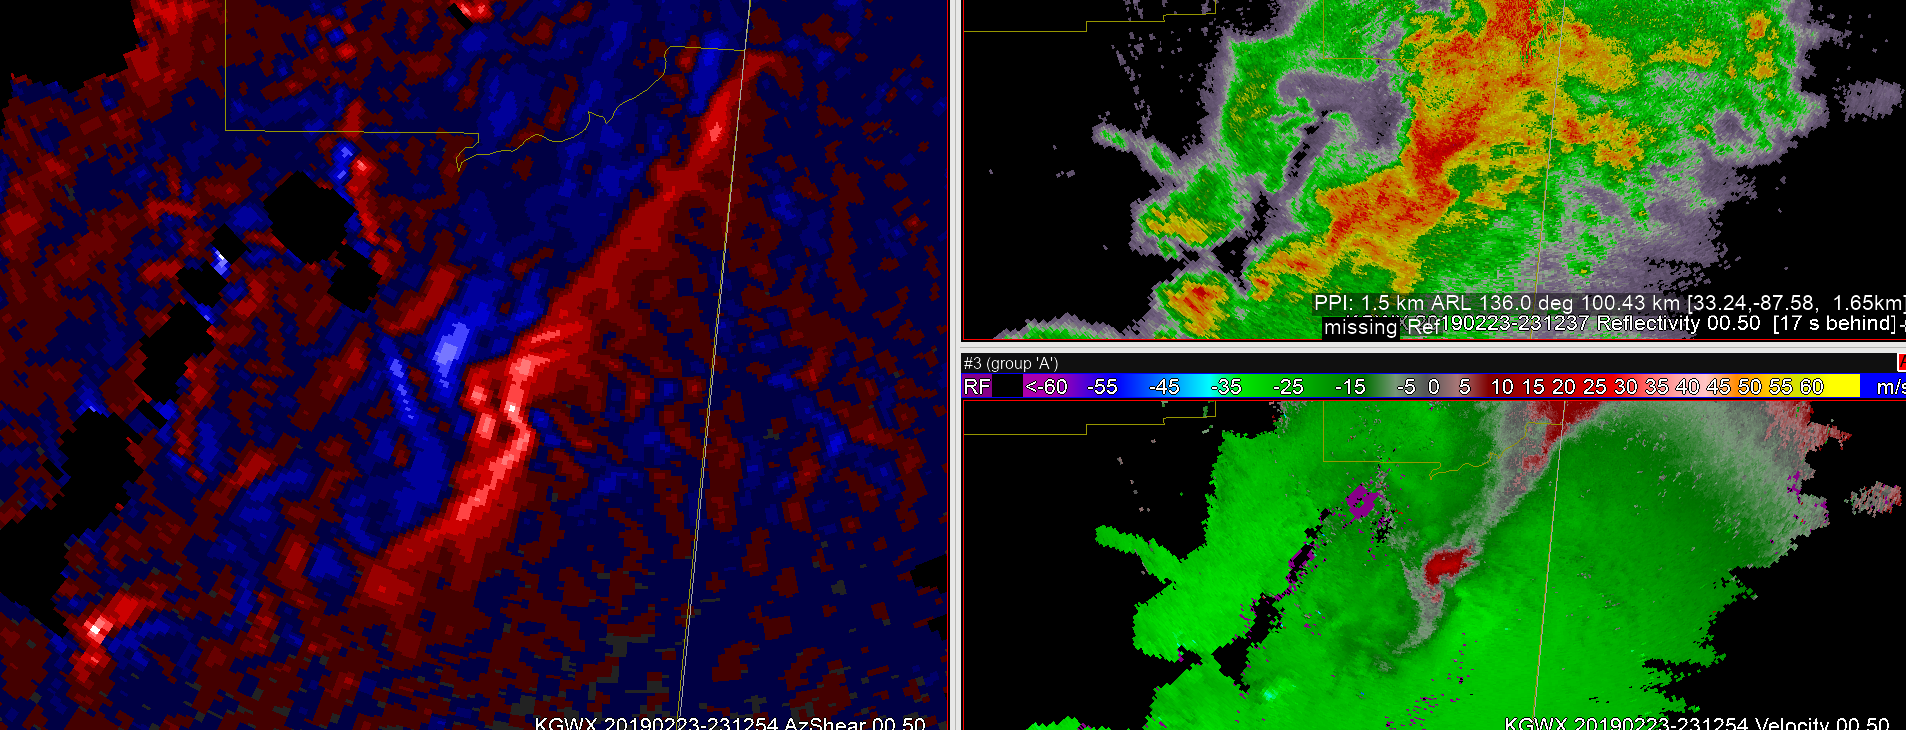
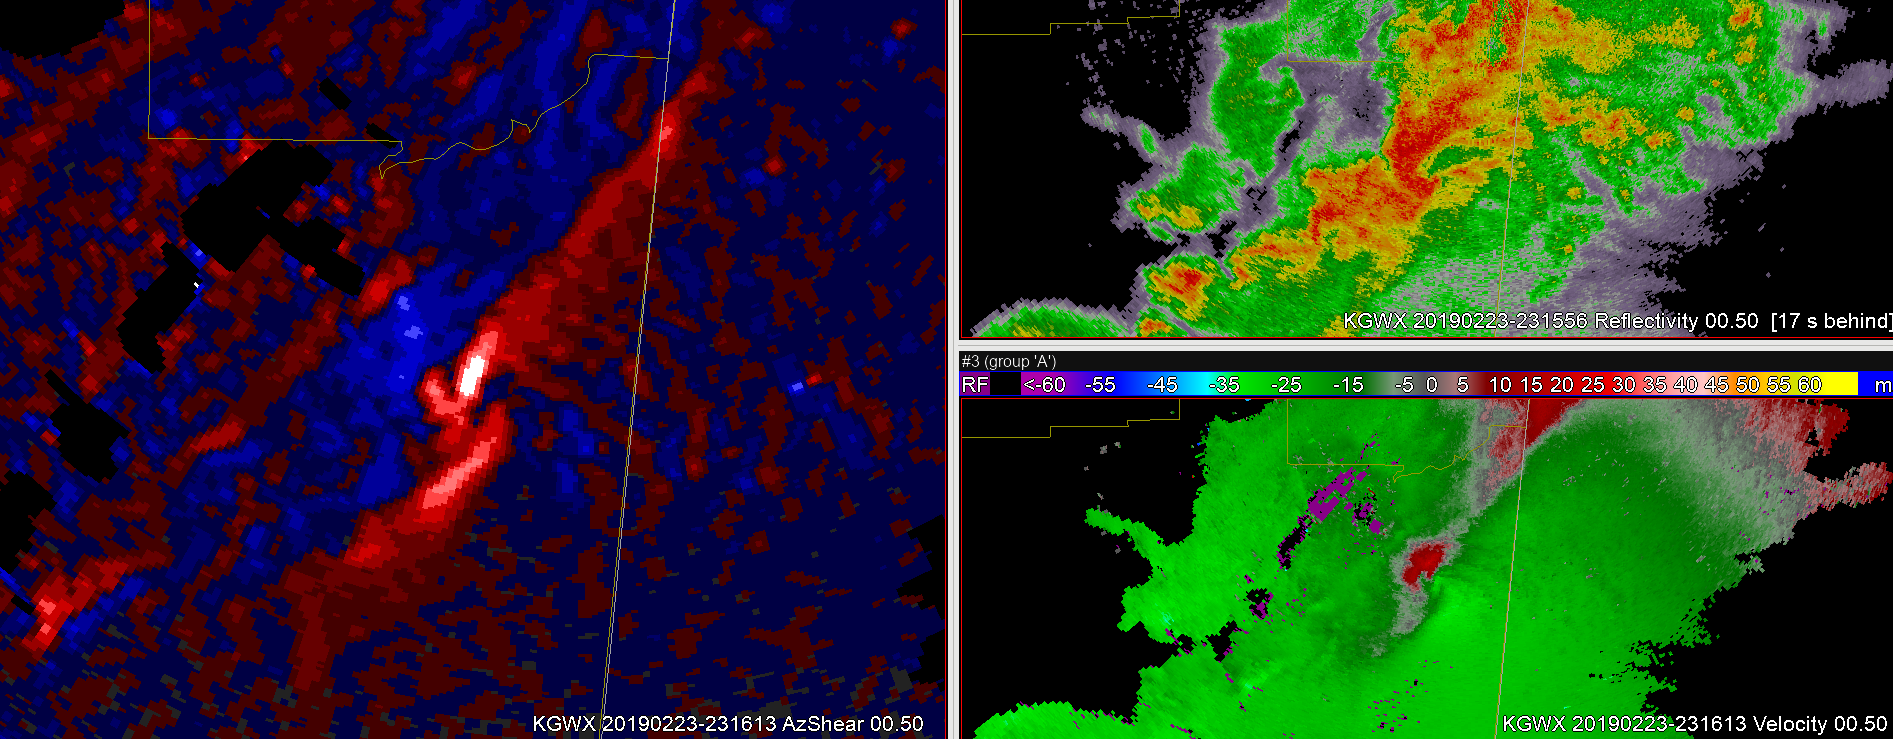
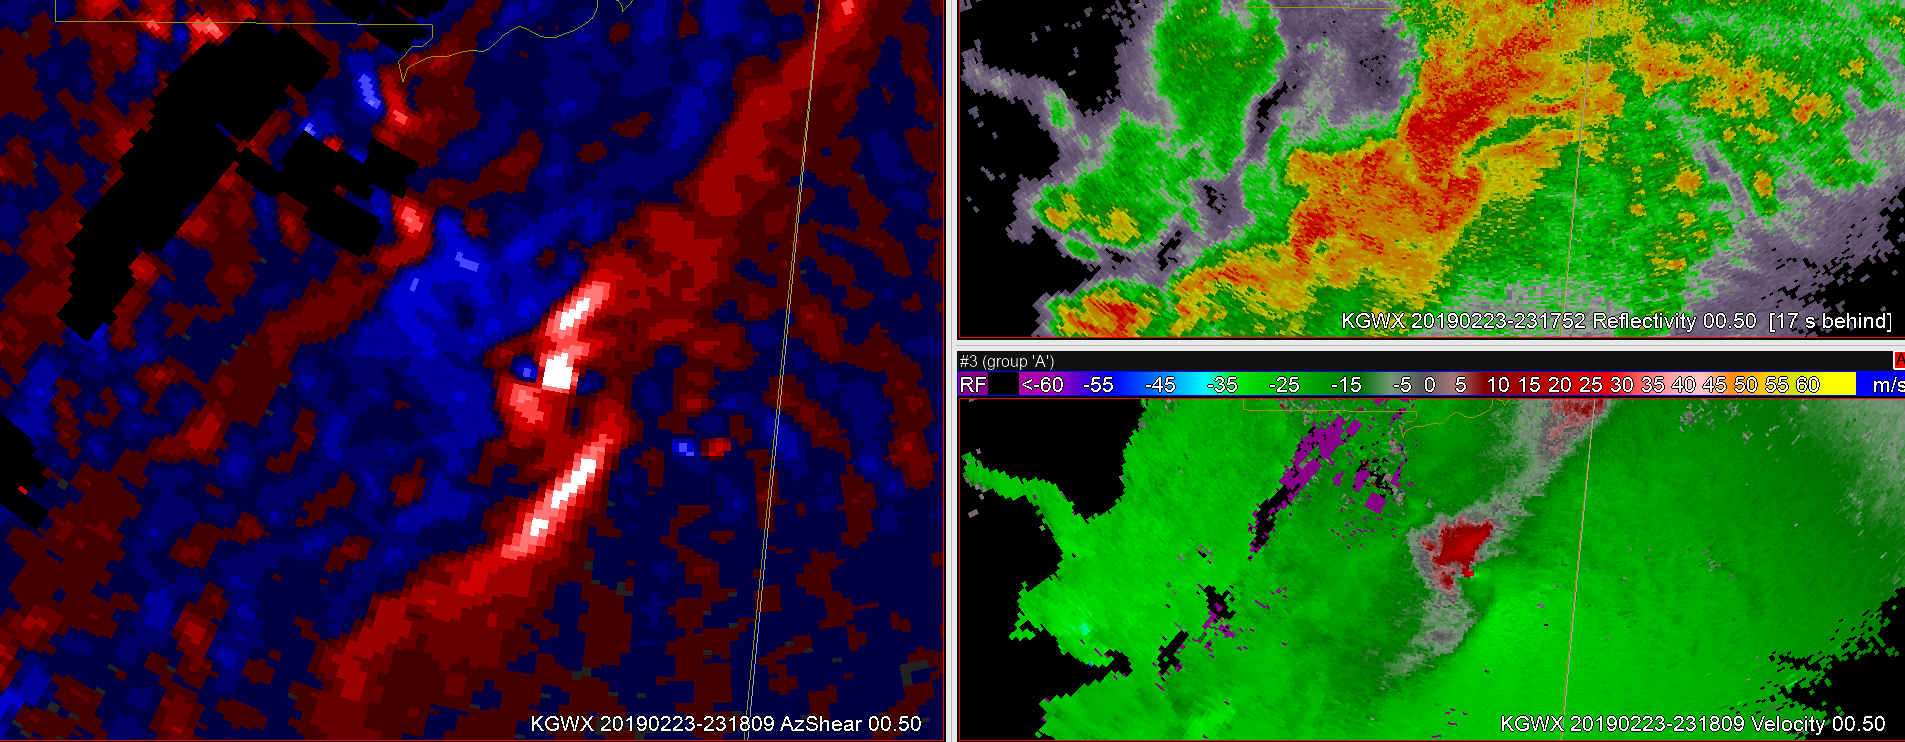
The single-radar AzShear product is quite useful in grabbing my attention to areas of high shear that could indicate the presence of tornado or higher level rotation. While not the best in indicating the location of the tornado (Velocity provides more precision), the AzShear helps identify those areas within the storm cell with strong shear, see Fig 1 below.
Figure 1: Single radar AzShear on left, Reflectivity top right, Velocity bottom right. The cursor indicates the center of the tornado based on Vel, but is more in the center of the highest shear on the AzShear product. 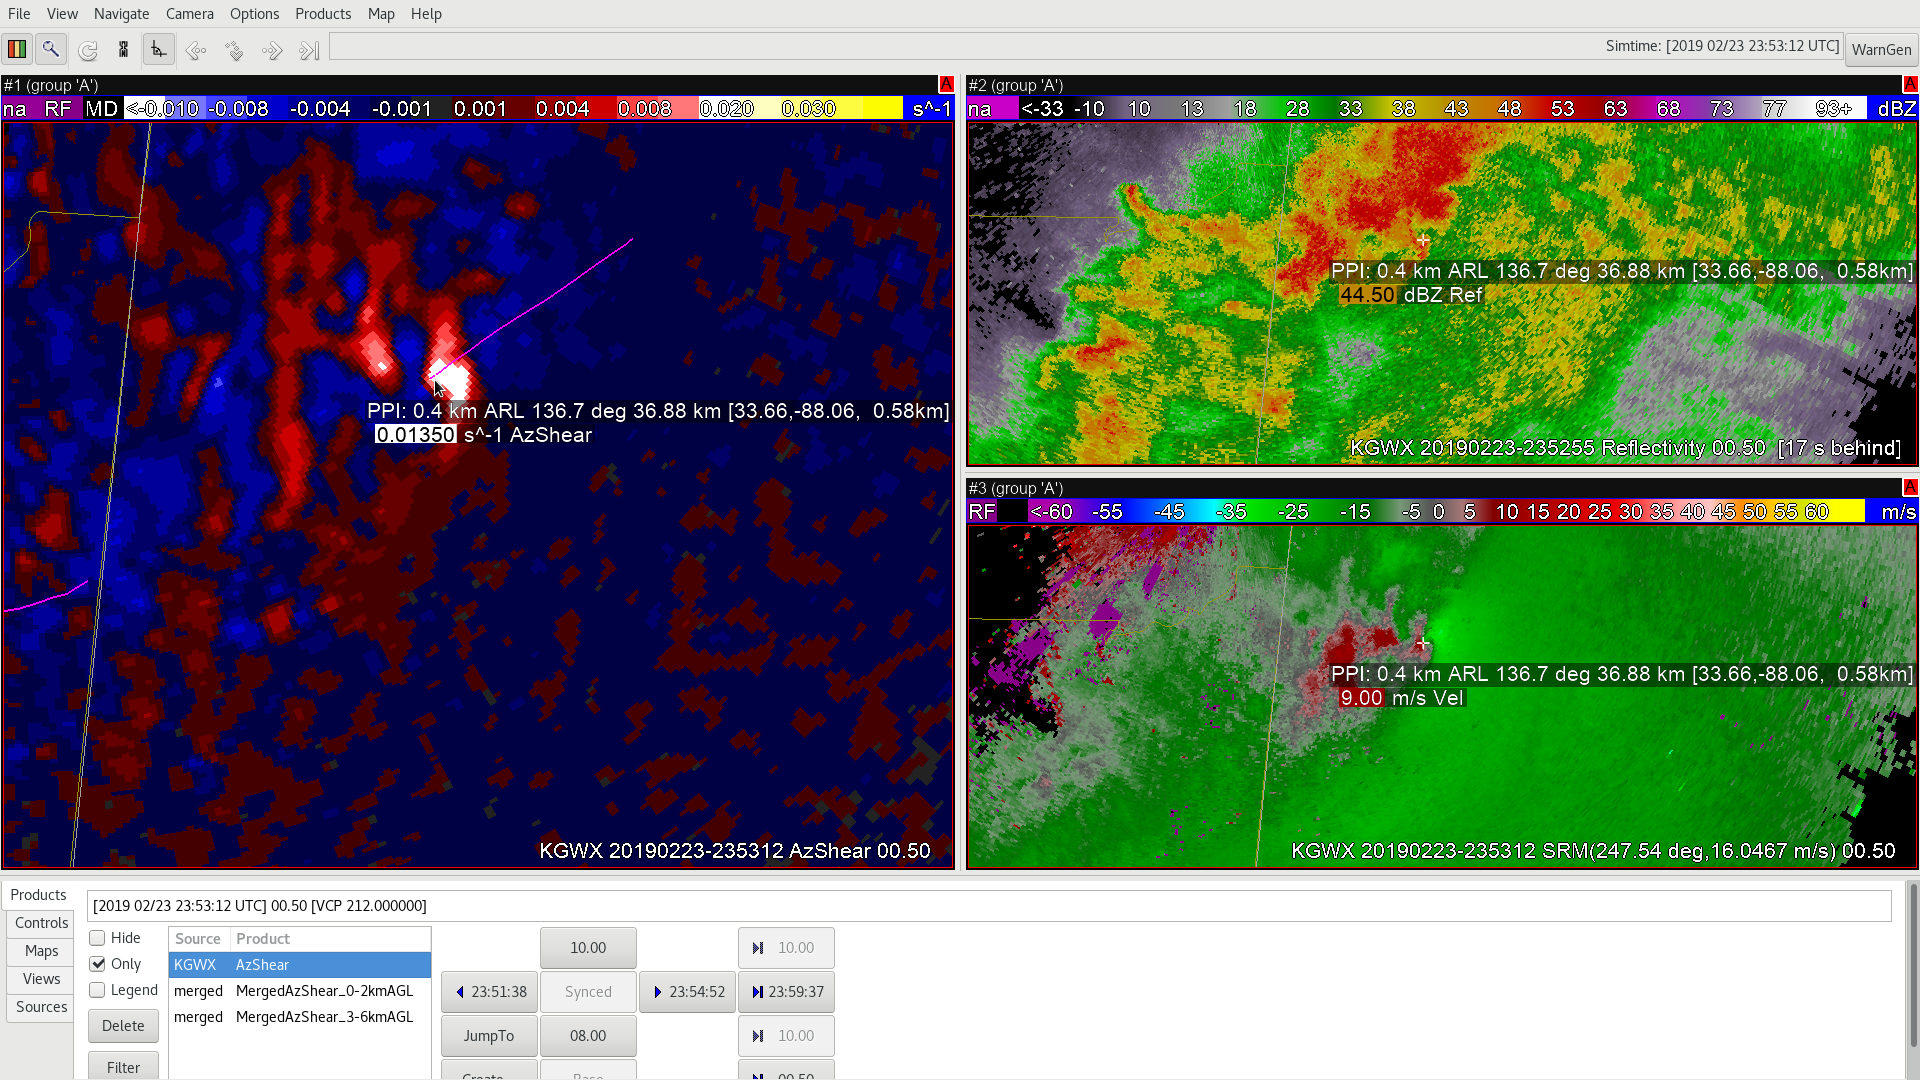 Other ‘hotspots’–whites/light blues in the AzShear product may send forecasters on wild-goose chases, looking for tornadoes, but having velocity data on hand quickly helps toss out the non-tornadic areas.
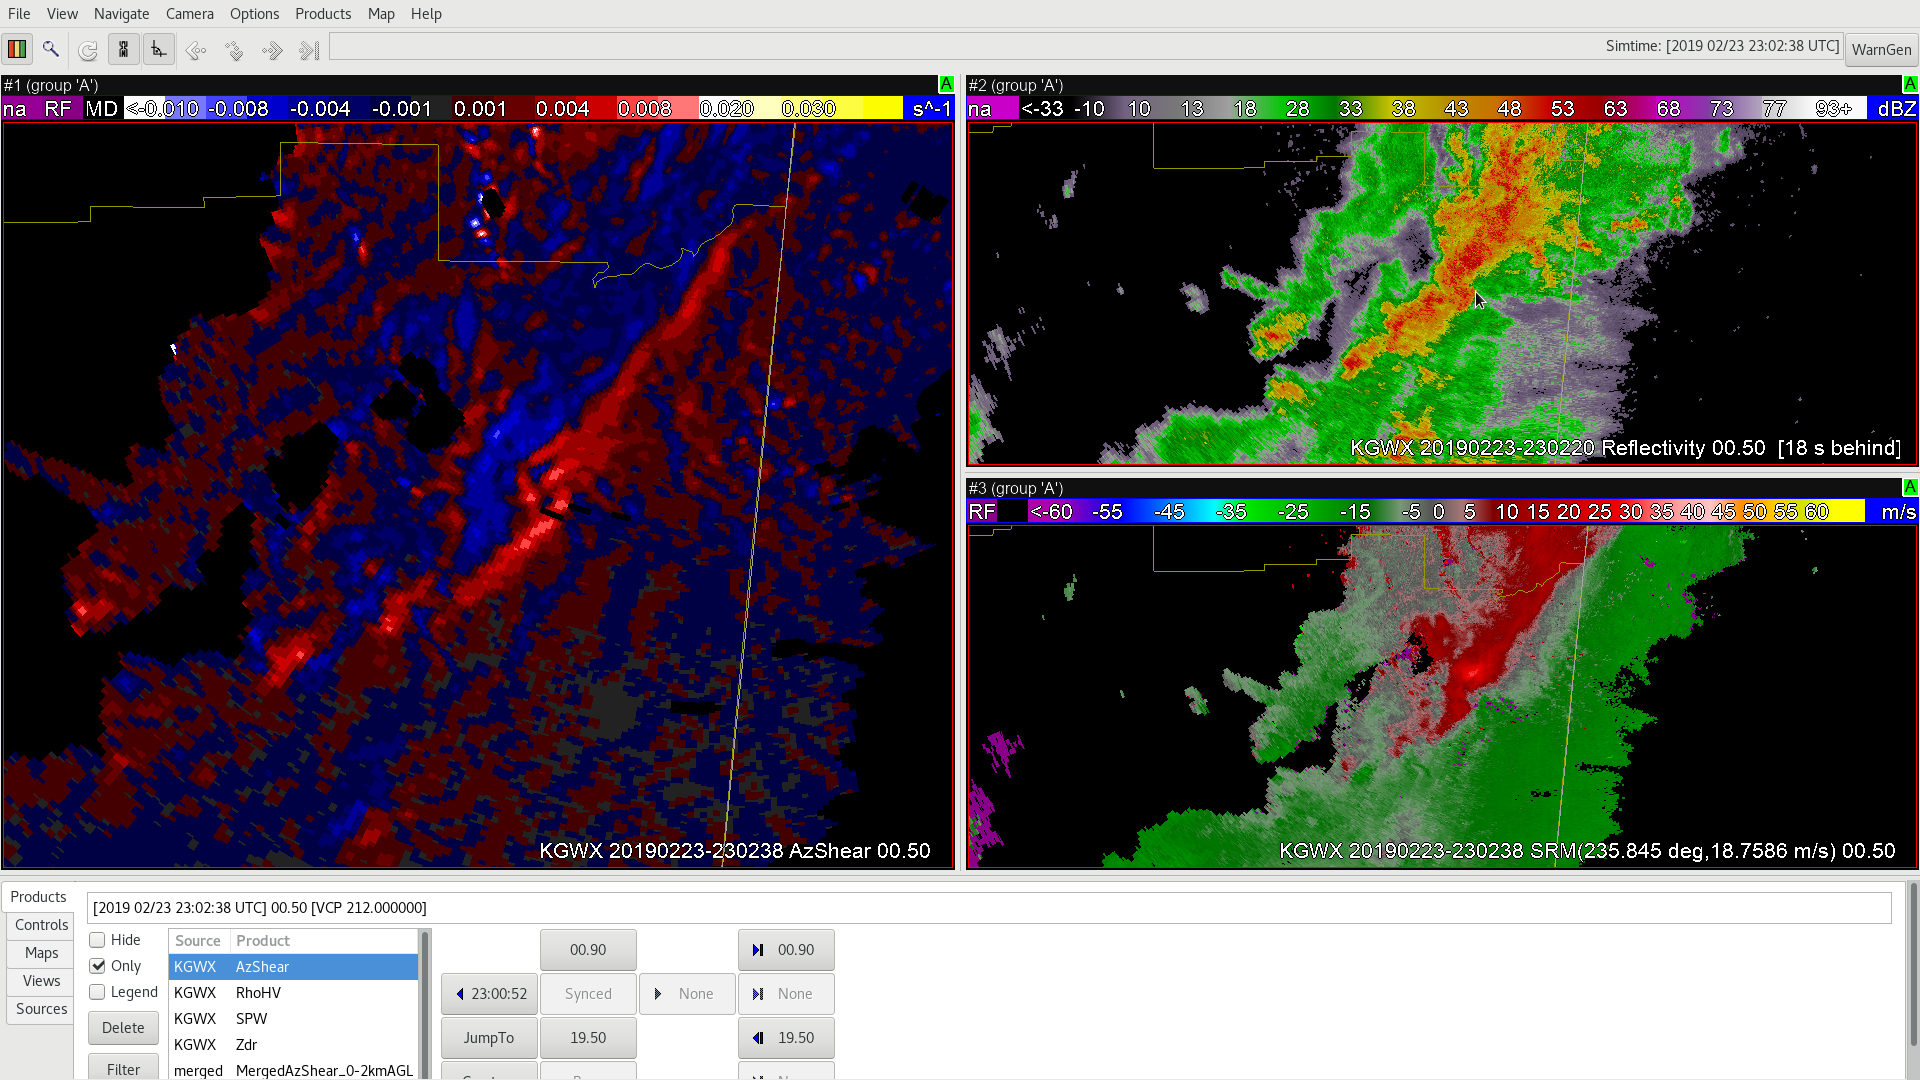
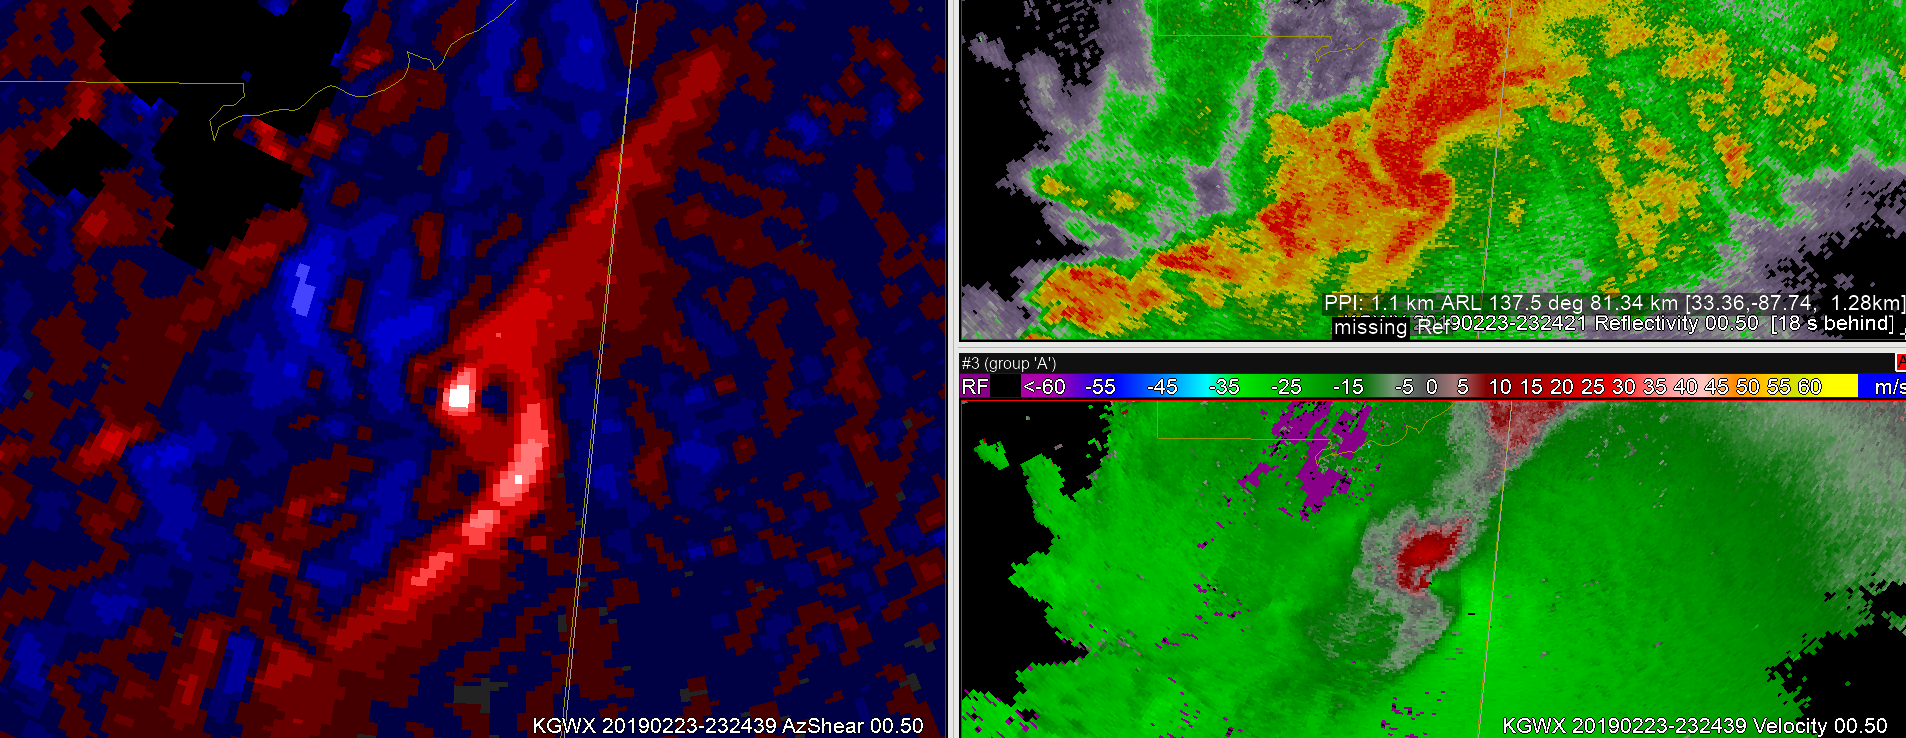
The MergedAzShear (MAS) product is useful in a broader sense of scale, but probably not as useful as the single radar AzShear. An MAS couplet often becomes distorted with the blending of multiple radar cuts from different radars. Sometimes a single couplet could show 1 or 2 echoes that will resolve into 1 couplet after another scan. For short-fused monitoring of a tornadic storm cell, its position could be misleading. Higher-level MAS, while useful in a broader storm environment seems less likely to depict a tornado, although it will indicate a broader area of high shear and changes in the wind fields. (See Fig. 2).
Figure 2: MergedAzShear (MAS) 3-6km AGL on left, Reflectivity on top right, Velocity on bottom right. The computer cursor is placed near the center of the Velocity-indicated tornado center.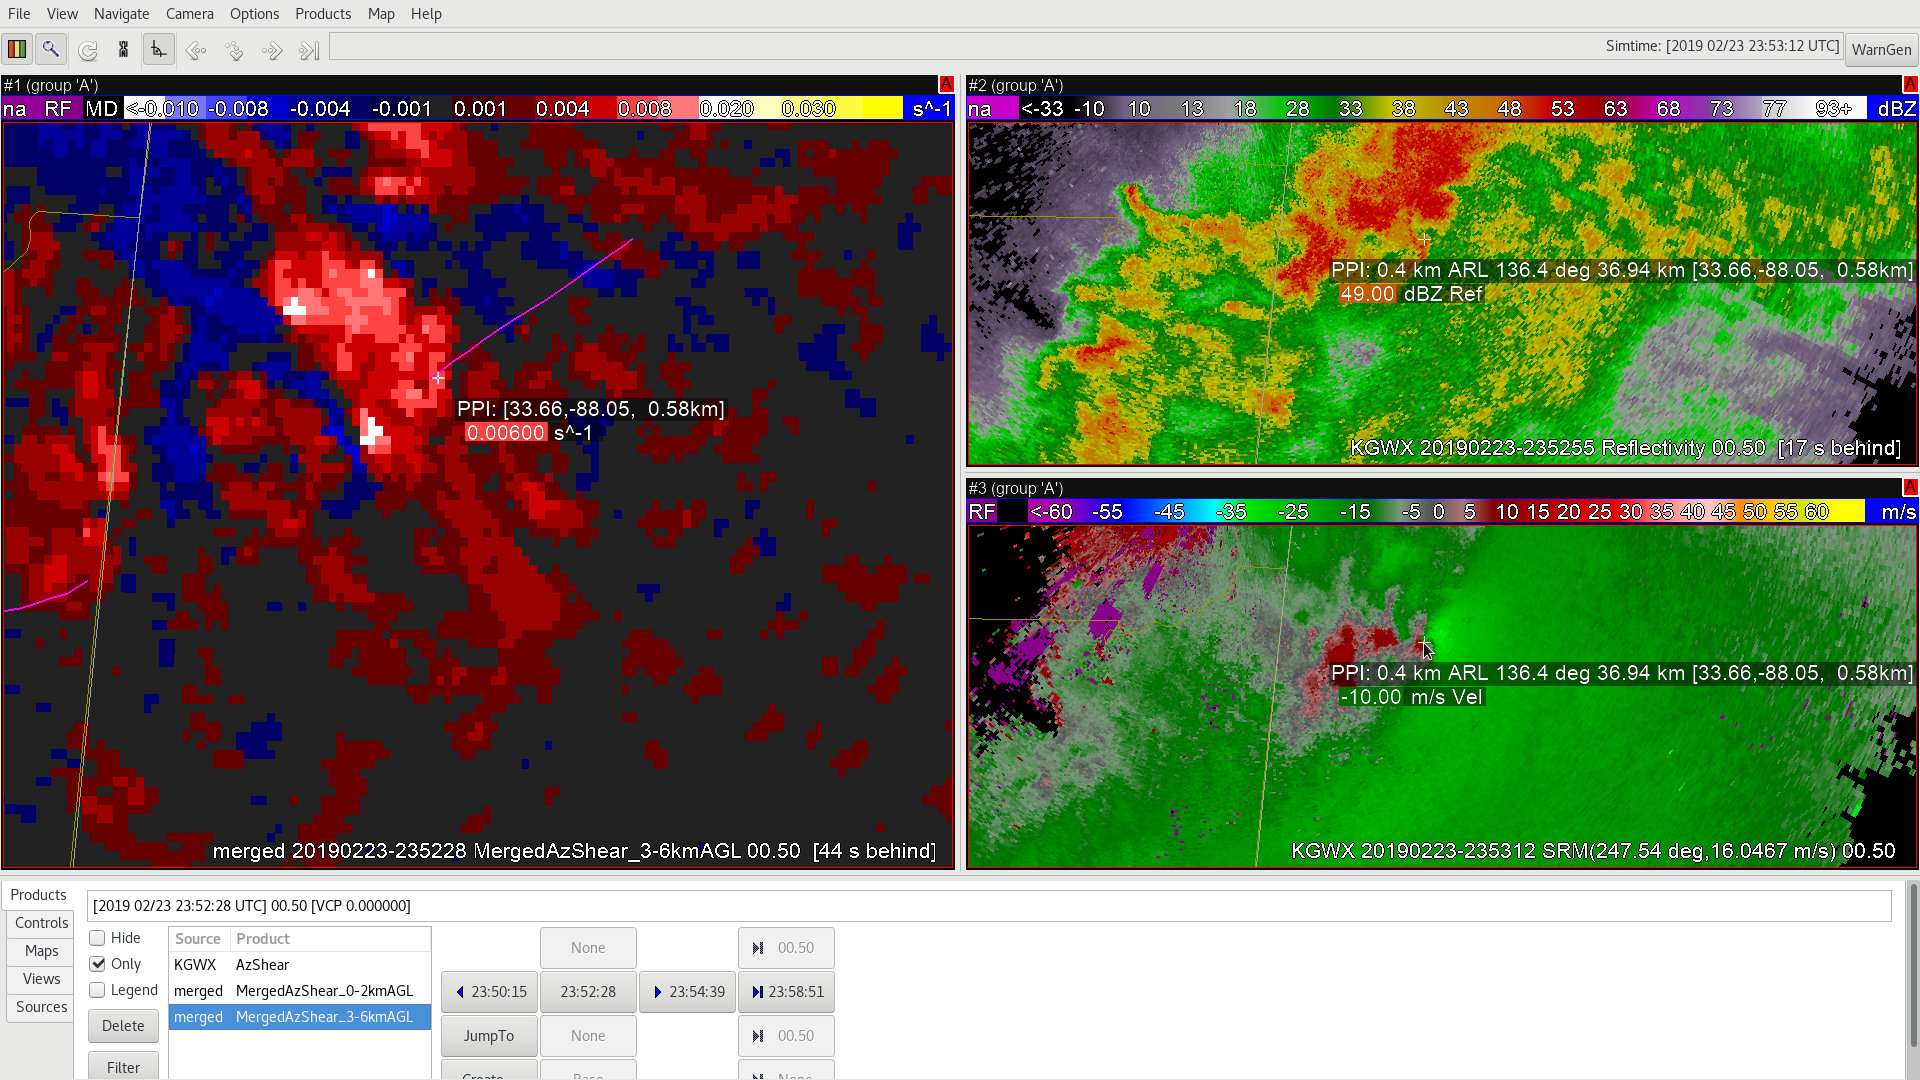 Ultimately, the AzShear is a good tool to use along with Velocity data to get an overview of what is going on within the atmospheric layer (0-2km or 3-6km), even when there is no tornado on the ground, but should be used in tandem with other radar data to help weed out false signals that may be due to ground clutter, etc.