

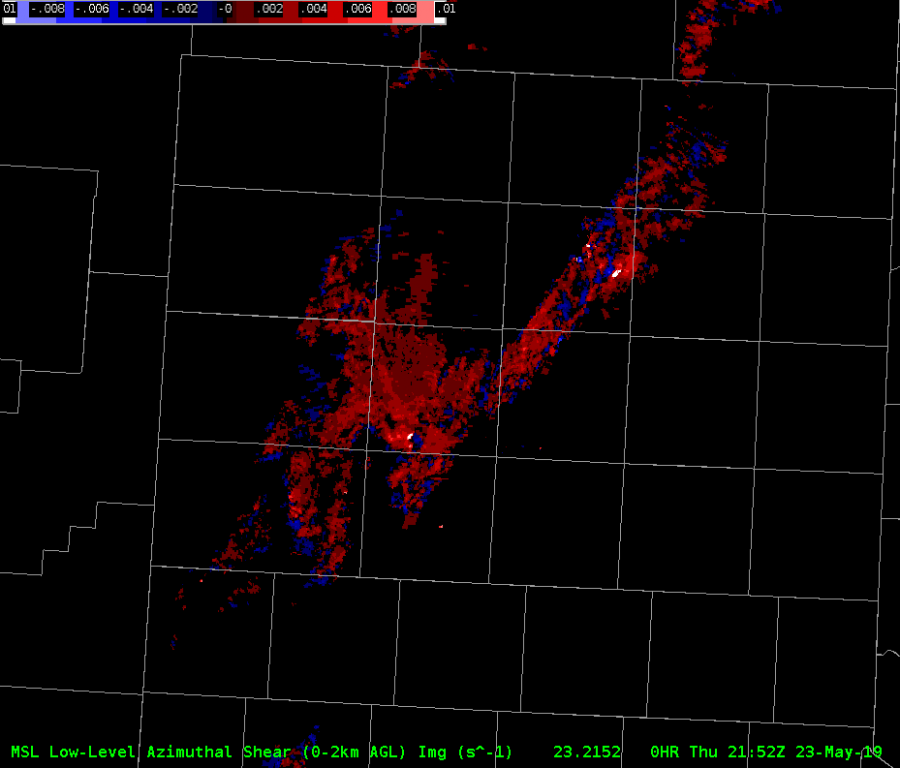
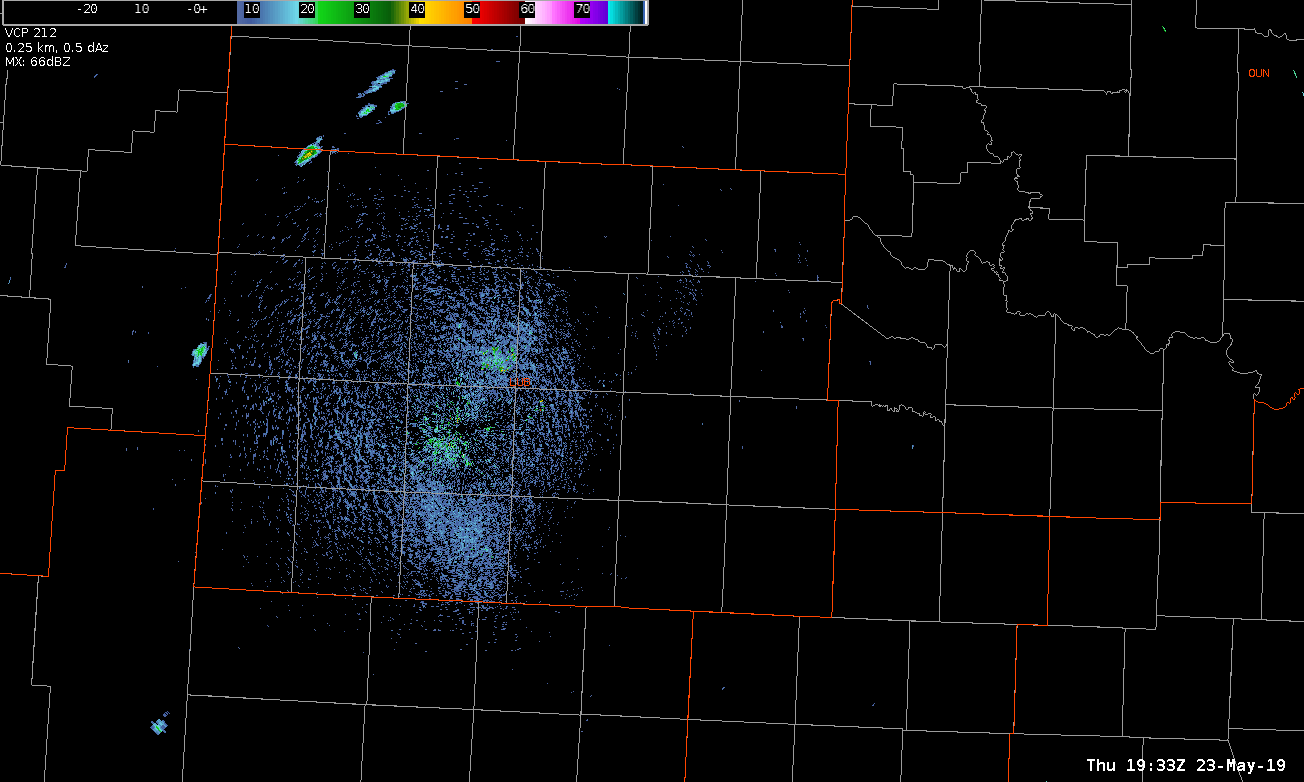
For the first HWT exercise, I’ll be taking a look at the AzShear products, including a single radar AzShear product and two (MRMS) merged radar products at the ranges (0-2km) and (3-6km). This is my first time as a forecaster seeing/evaluating these products, and the case was mainly used as to build knobology on the local evaluation platform while also discussing potential conceptual uses for said products. Thus far, the single radar AzShear product seems to help illuminate areas of enhanced rotation nicely in an easily depict-able manner. It doesn’t, however, seem like it should be considered as a replacement for a velocity/SRM display in the near-term environment. This was proven true in several cases where it was hard to pinpoint exactly where the center of rotation was in the display (See image below).
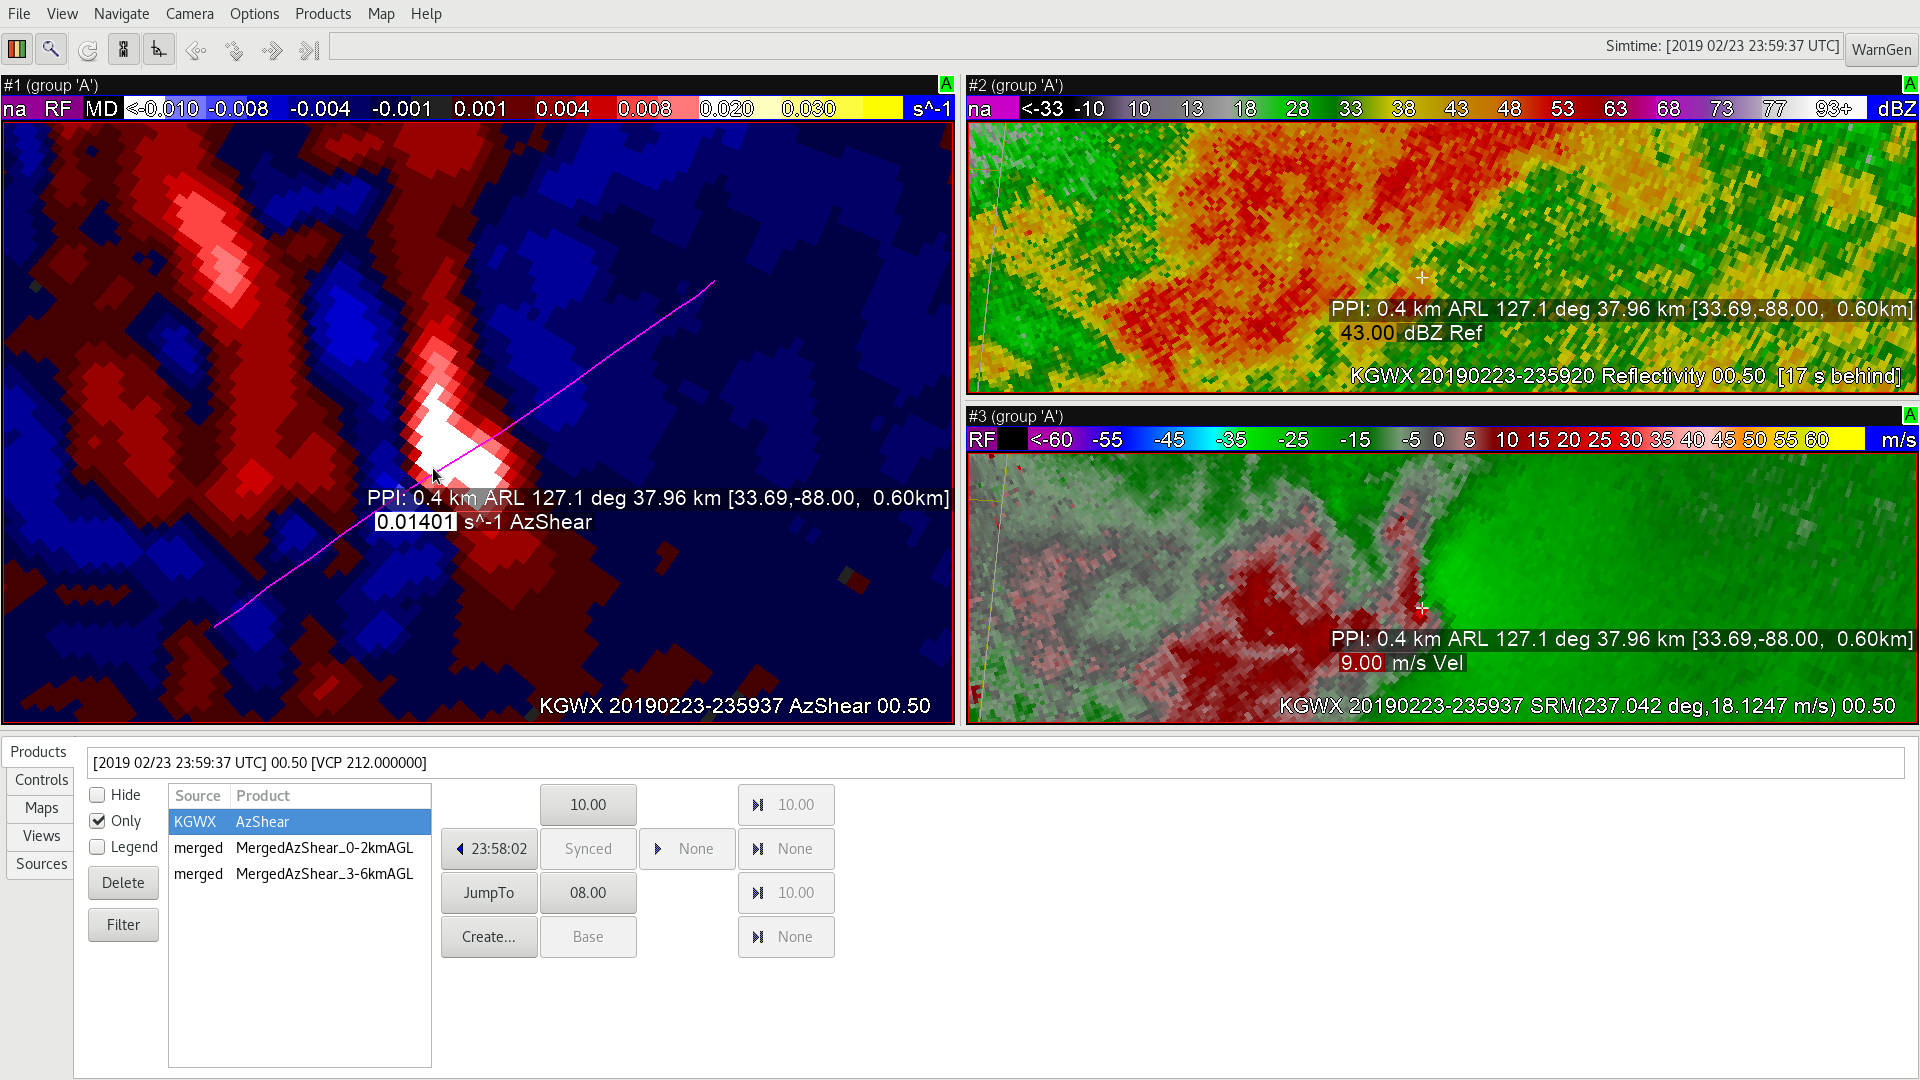
If I was a forecaster trying to draw a tornado warning polygon, I wouldn’t necessarily want to do so using the AzShear product alone, the use of SRM/BV would allow for a more finite tornado warning polygon to be drawn, which would result in a lower FAR with respect to those within said area who have the best chance of encountering a tornado on the ground. Also, I feel that this product will need a rather extensive color table to make it useful, and I’m just not convinced that there is enough precision to allow that to be possible knowing the resolution and reliability of the input.
With that being said, I do see some utility in this product, specifically as a supplement/tool for a radar operator in the near storm environment. Being able to pick out and follow areas of highest shear through the evolution of an event could be extremely useful, especially in linear or a cluttered storm type environment where picking out couplets using SRM/BV could be more difficult.
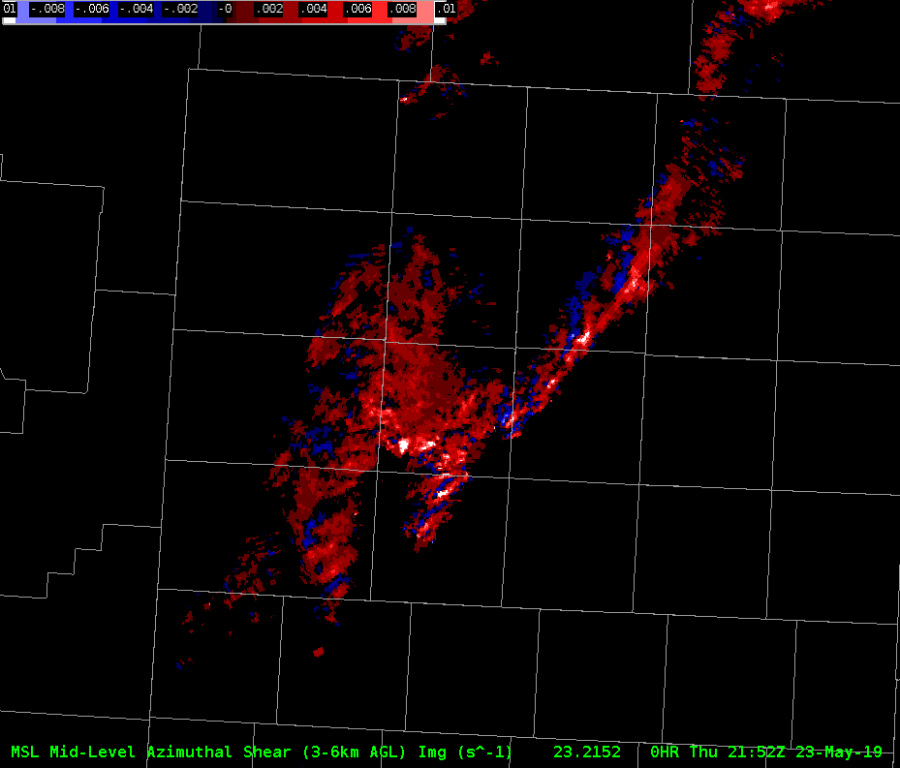
Briefly evaluated were the merged AzShear data-sets within the case. Generally, even more features which would be beneficial to a warning forecaster are being lost in the process of creating this product. On a CWA scale, the primary benefit for this would be for situational awareness purposes, or possibly through the use of the (0-2km) product in a tropical-type environment where low/mid-level rotation may indicate a pre-cursor to a short-lived weak tornado. A huge downside at this point is the incorporation of the “Sails” slices, which tends to make the product rather messy in-between. A suggestion would be to try to eliminate the sails slices, even if that ultimately limits the amount of time between new data production.
—————————————————————————————————– Mountain Bone
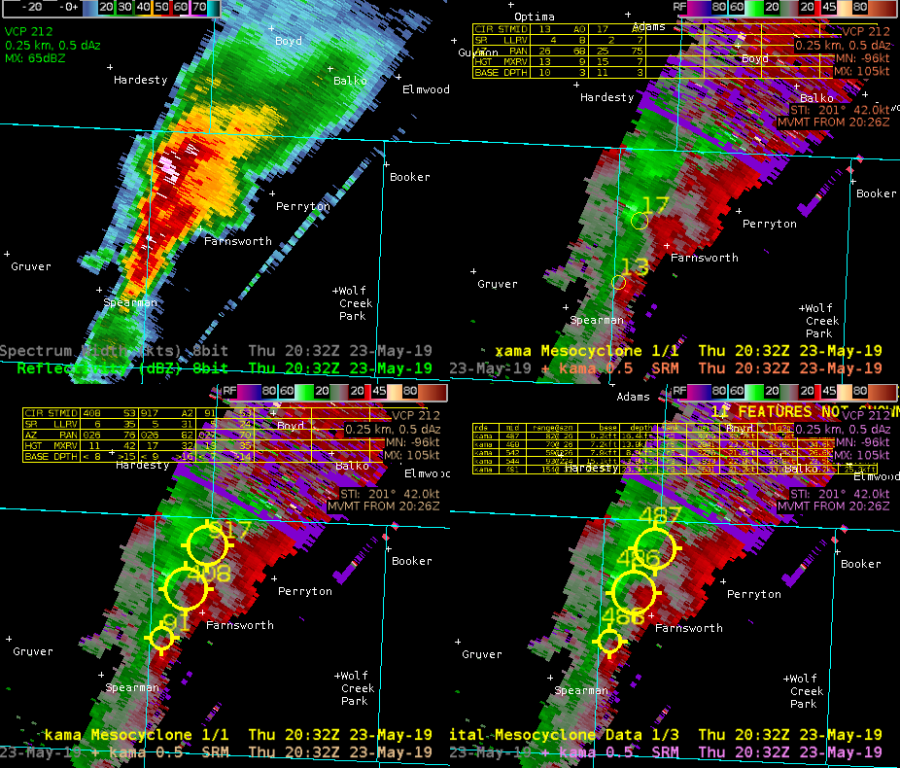
 CPTI upper left, New MDA upper right, legacy MDA lower right, digital MD lower left.
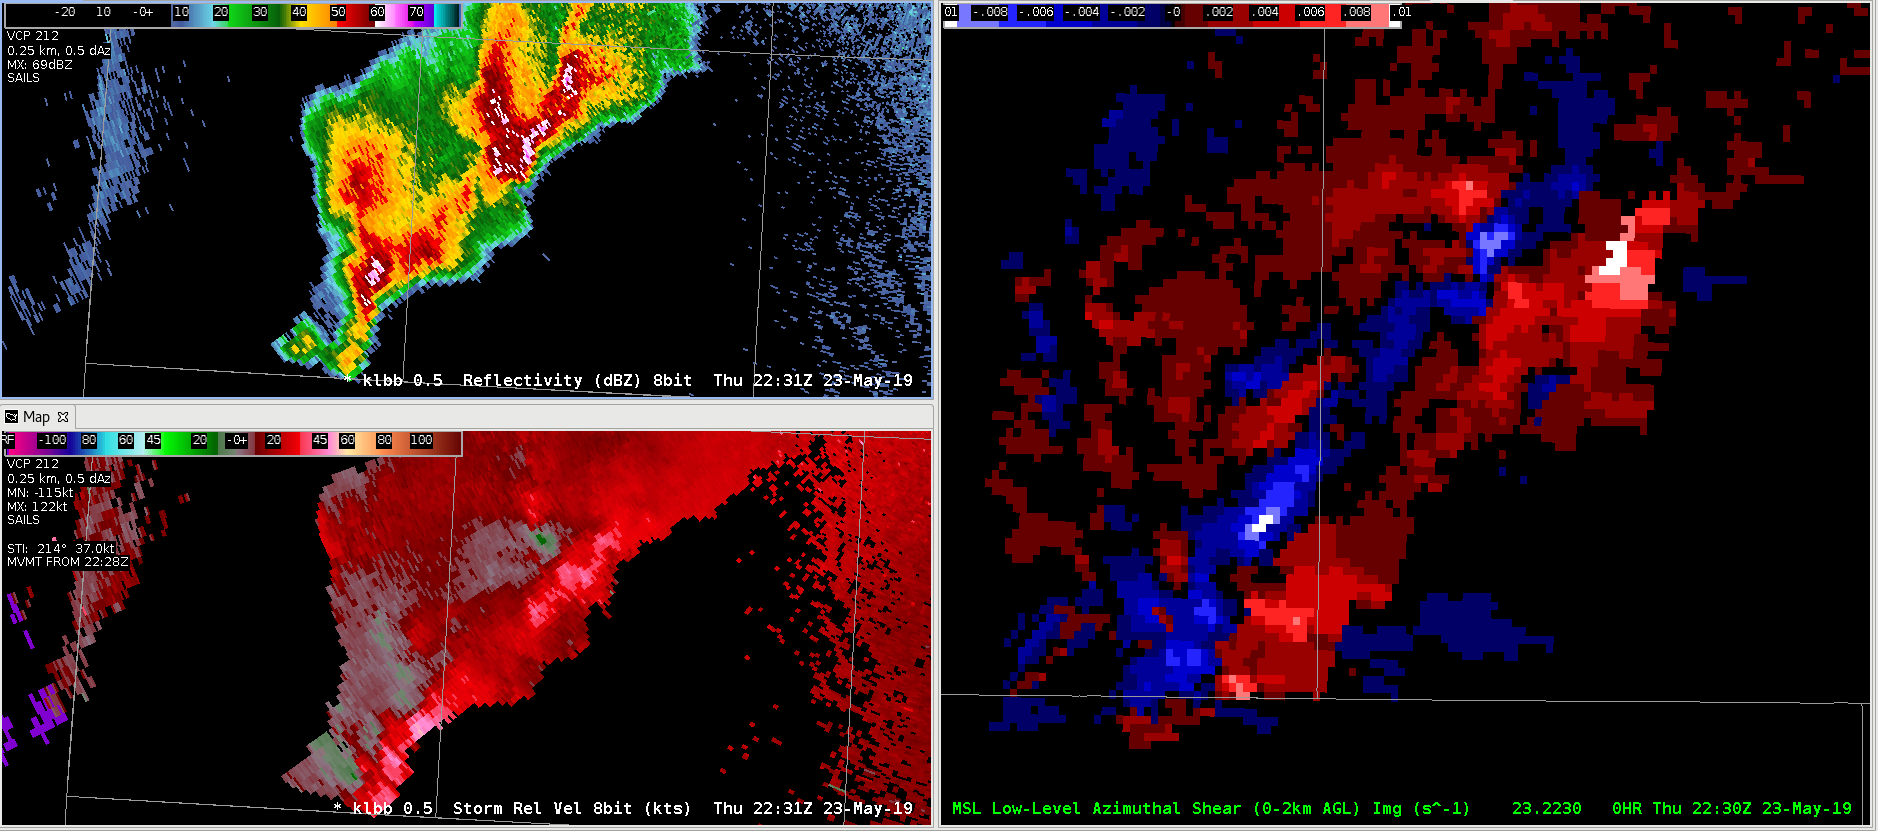
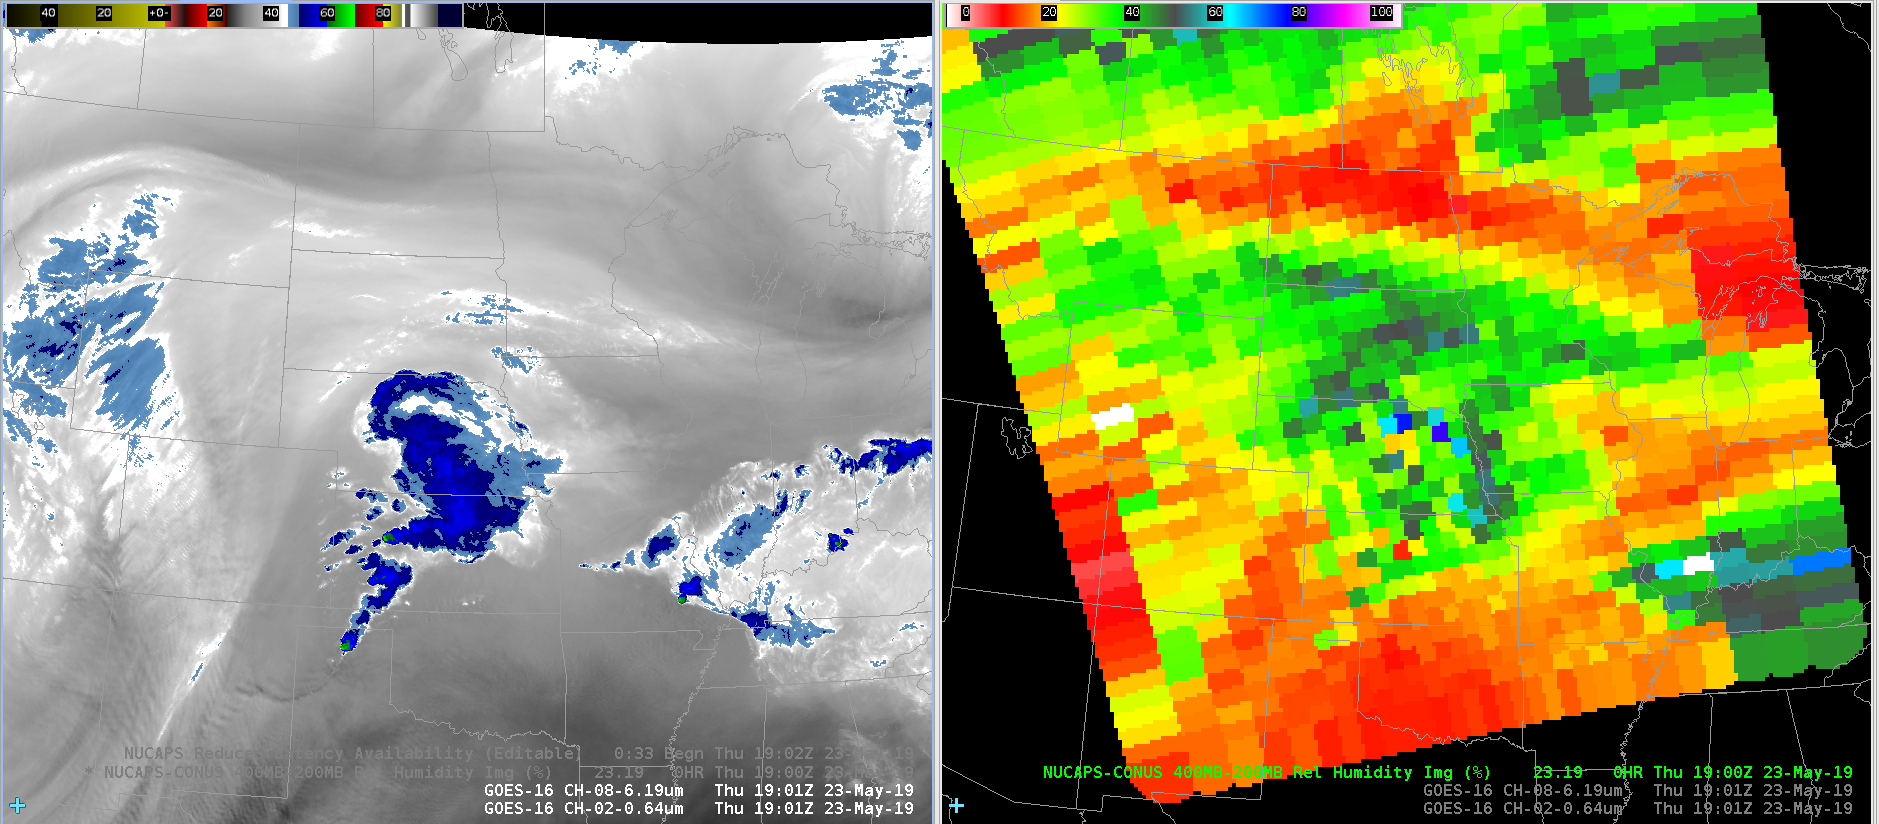

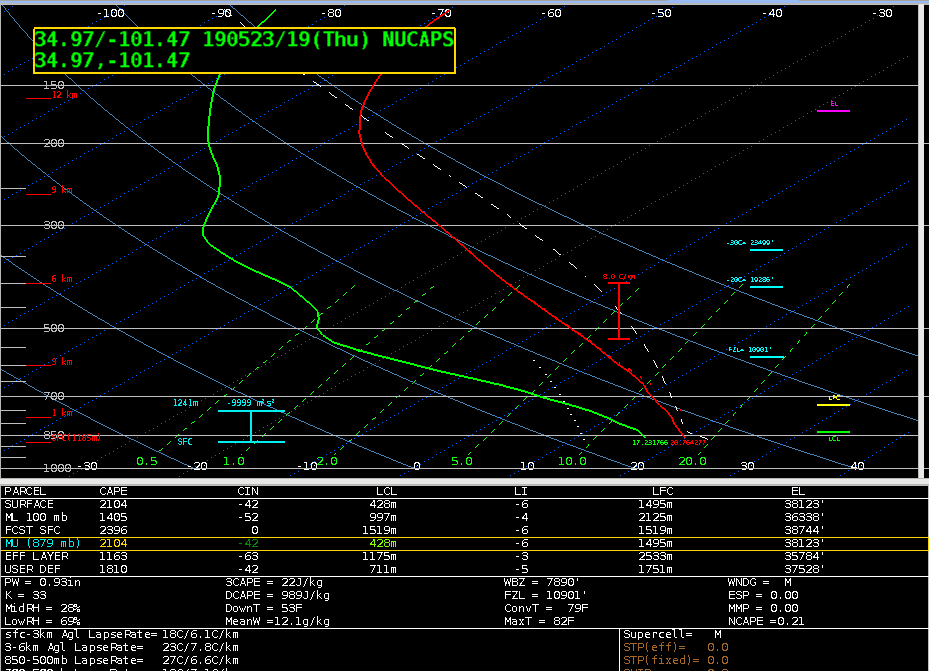
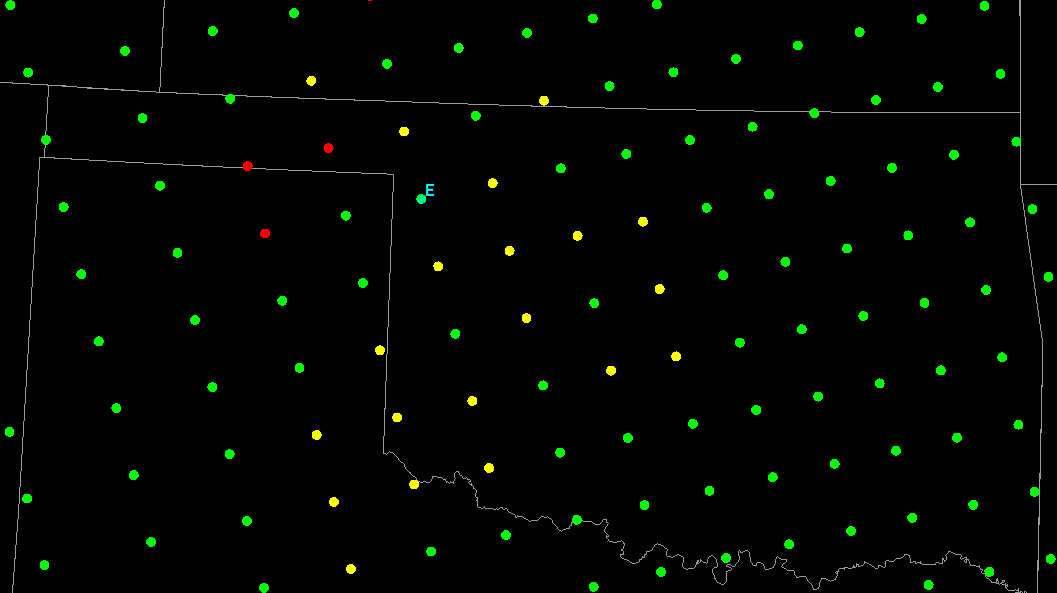
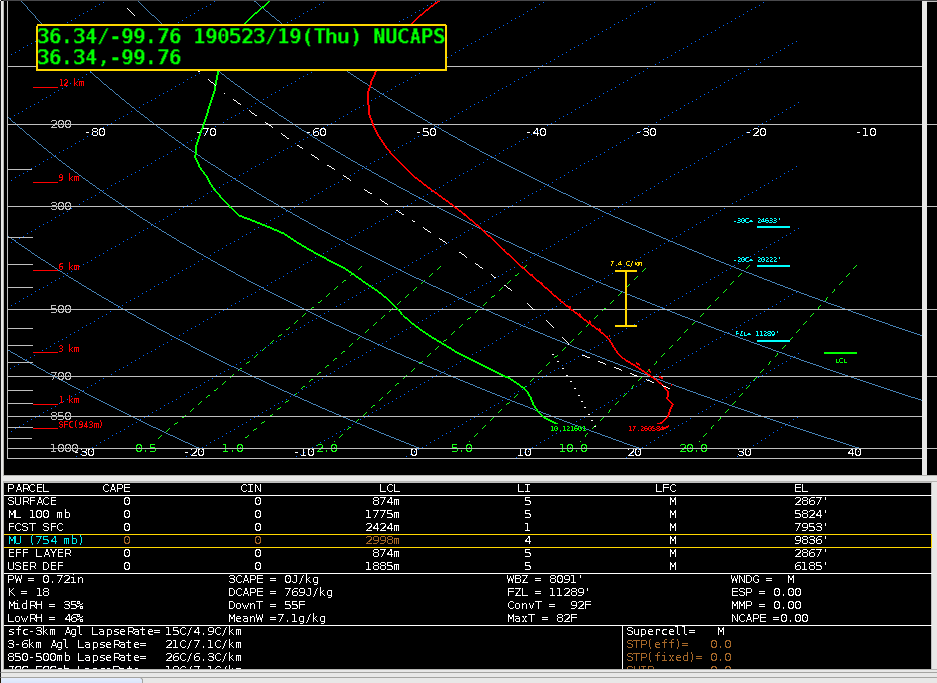 It uses a surface temperature of 63F, and a surface dew point of 50F, both more than 10 degrees below the nearby observations. These inaccurately low values give, as one would expect, no sign of instability (CAPE=0). Looking at the modified NUCAPS gives a different picture, however.
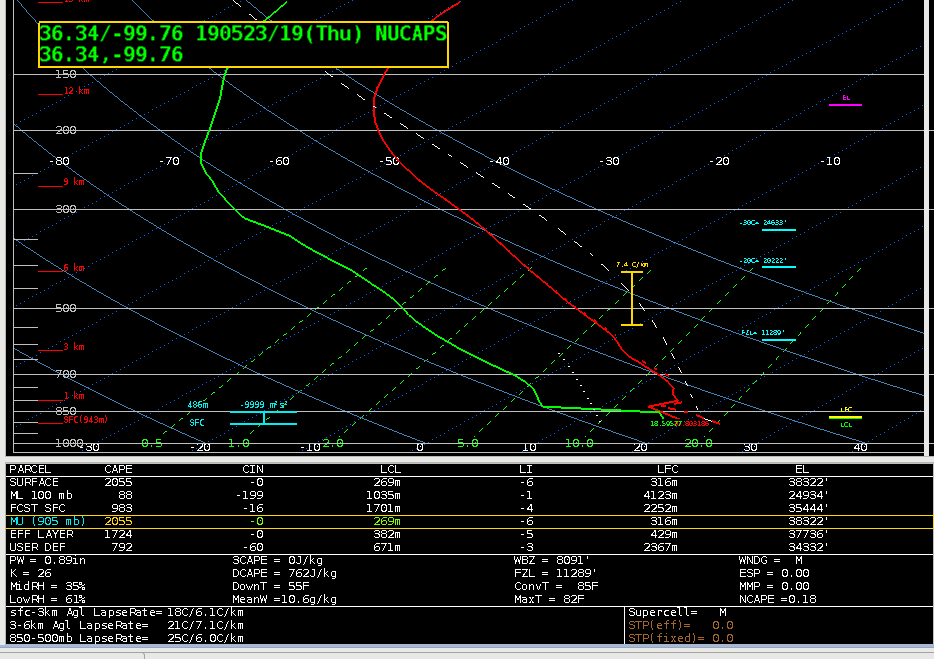 In the modified sounding, the surface temp is 69, and the dew point is 65, which is much closer to the observed surface obs. This changes your surface-based CAPE to 2055 J/kg, vs. 0 from the unmodified. It also has a sharper low level inversion, which one wood expect based on the stratus deck in place.
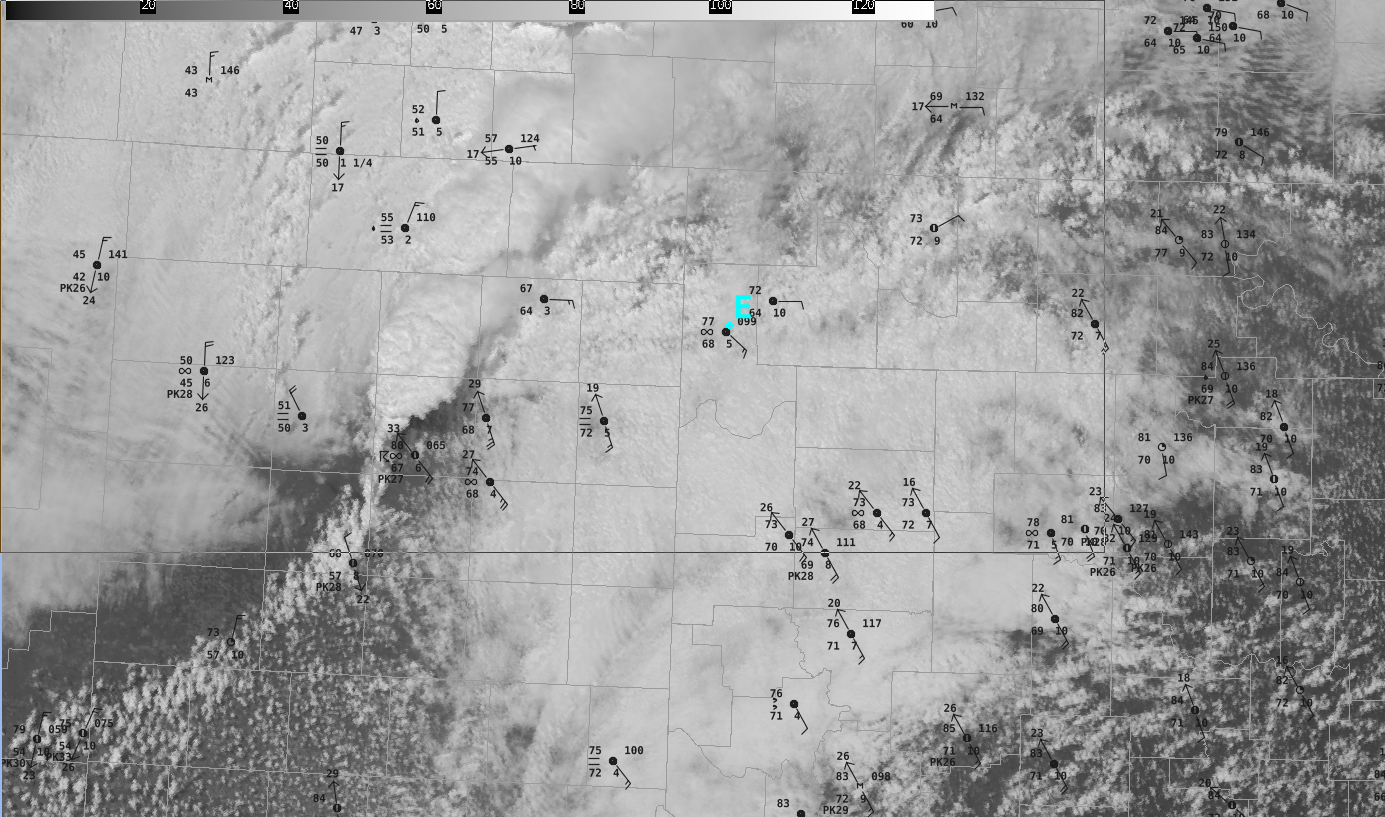
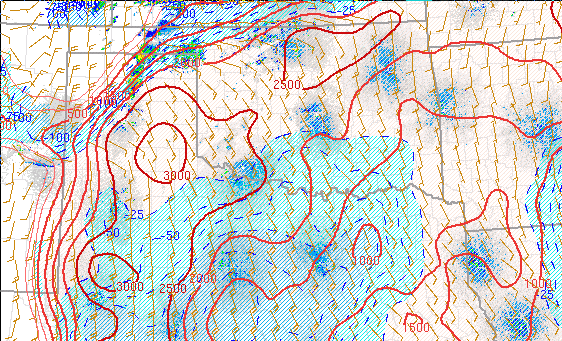 Sure enough, the mesoanalysis shows CAPE at around 2000 J/kg. Clearly, this is another case where the modified NUCAPS sounding is a noticeable improvement over the unmodified sounding.