
So, it can be refreshing to see when NUCAPS data agree with model data, but I’m often more interested in those cases where there are differences, and potentially important differences. Notice in the images below the comparisons between NUCAPS 850-500 mb lapse rates and various model data.
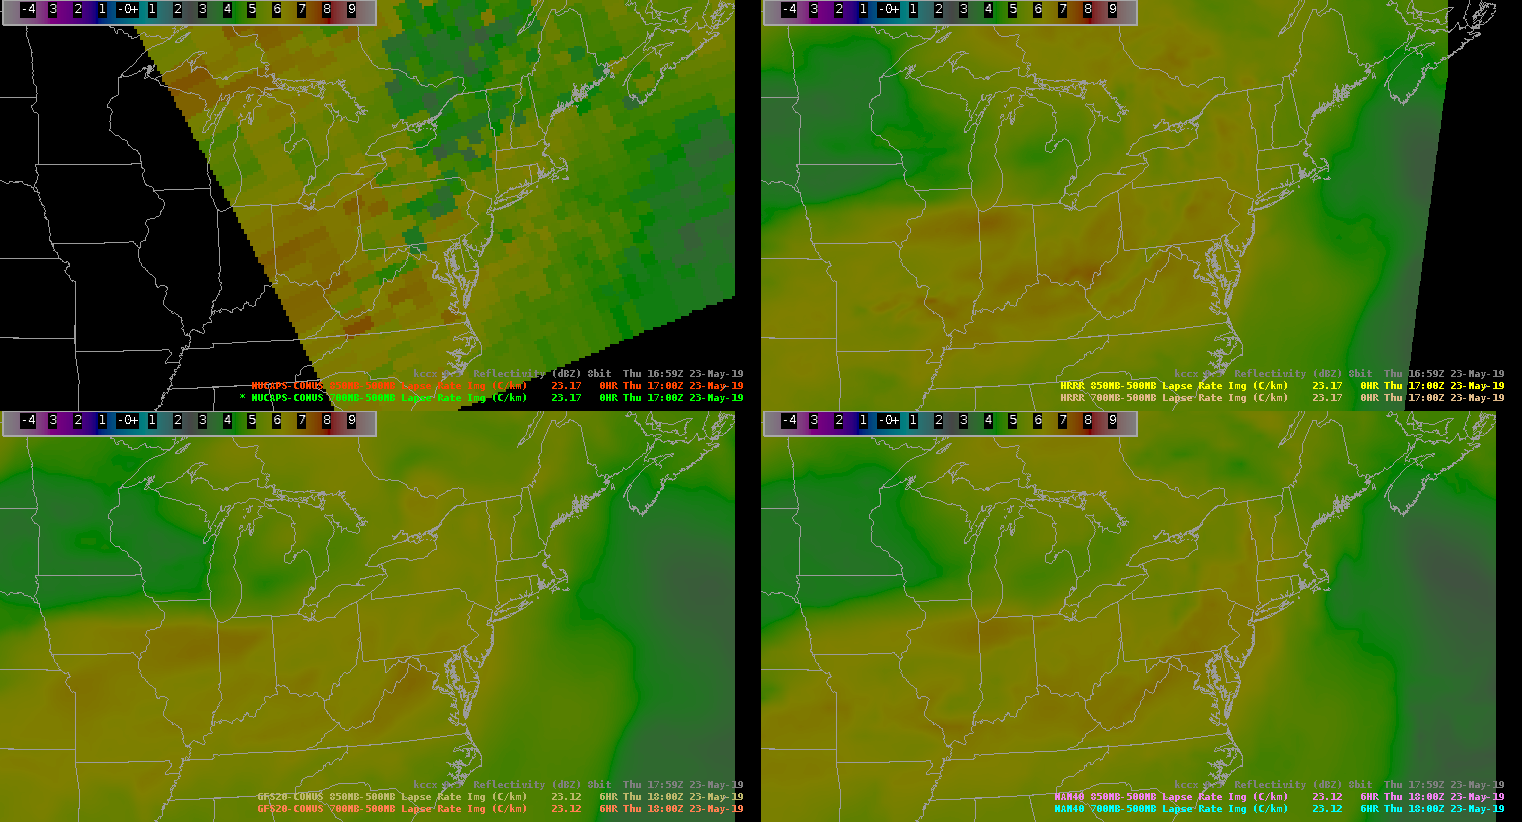
Notice the relatively large differences that stretch SW to NE from central W VA into New England. Taking a look at nearby radar imagery, it’s clear why this area had significantly lower lapse rate values in the NUCAPS data than the models; a line of showers and thunderstorms were present along this path of lower values that was displayed in the NUCAPS gridded data (Image 2).

Of course, the NUCAPS retrievals certainly would have been affected by this area of denser clouds and precipitation. Nevertheless, lapse rates would be affected (lowered) by the convection in those locations, which is depicted in the NUCAPS data only. So, the lack of this feature in the models would then affect their forecast in this region going forward. It will be interesting to see the NUCAP-Forecast data in this type of scenario. In fact, one of the forecasters here is taking a look. Anyway, let’s imagine a scenario where this convection had dissipated and left behind a boundary or gradient in temperature/moisture. The detection of these types of boundaries, that often occur in pulse type convective events especially, can be important for predicting where convection will take place subsequently.
Oh…one more thing, it was interesting to notice the quick air mass recovery and advection of steep lapse rates and instability behind the area of convection in the OH Valley. So, given ample forcing, further convective development is possible even behind this line. In fact, the NUCAPS indicates lapse rates ~7 C/km across a broad area on the edge of the swath in the OH Valley.
-Kris W