I initially wanted to compare model data, especially skew-t’s, that I usually use, to the NUCAPS products. My purpose was to ascertain the feasibility of replacing or supplementing point based model products with NUCAPS. As I was unable to access the model data I use daily I decided to compare NUCAPS with NAM and GFS.
First the comparisons in the rapidly changing thunderstorm environment in which I interrogated a large MCS over the Illinois/Indiana border.
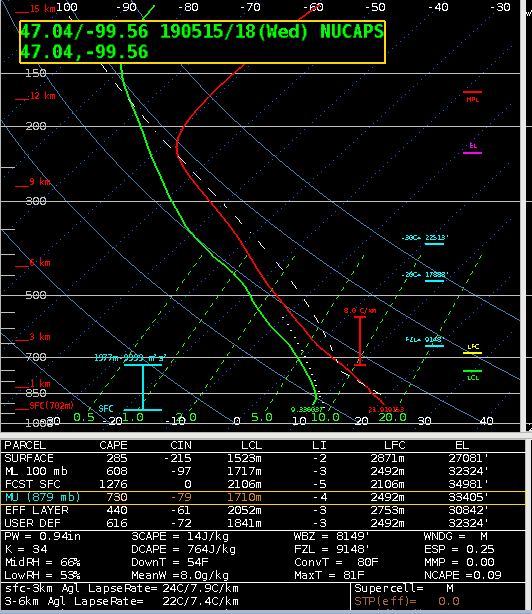
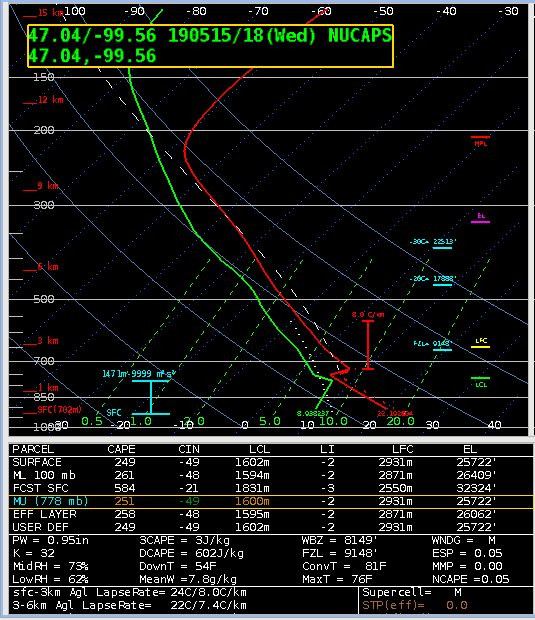
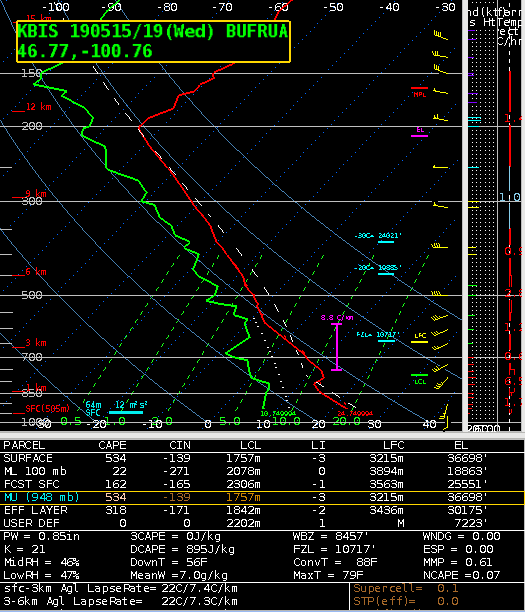
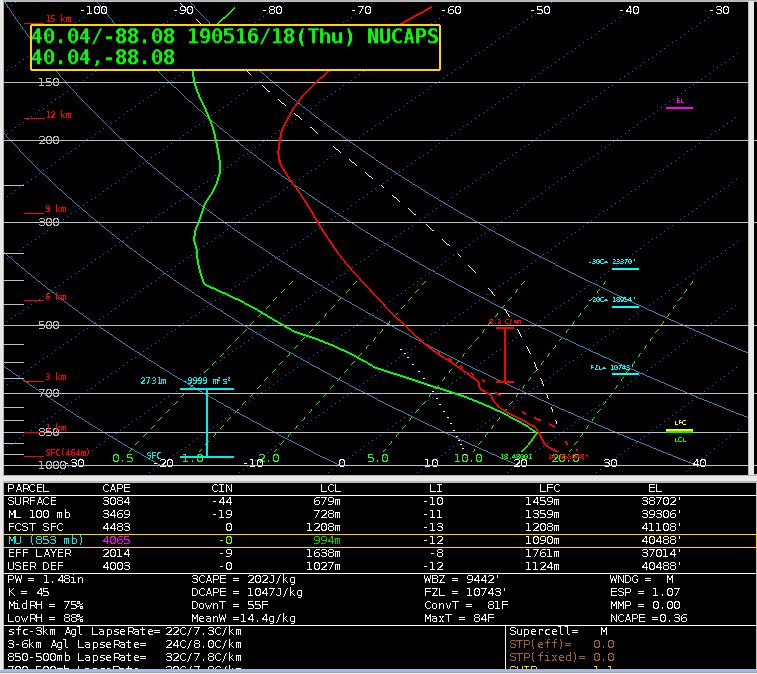
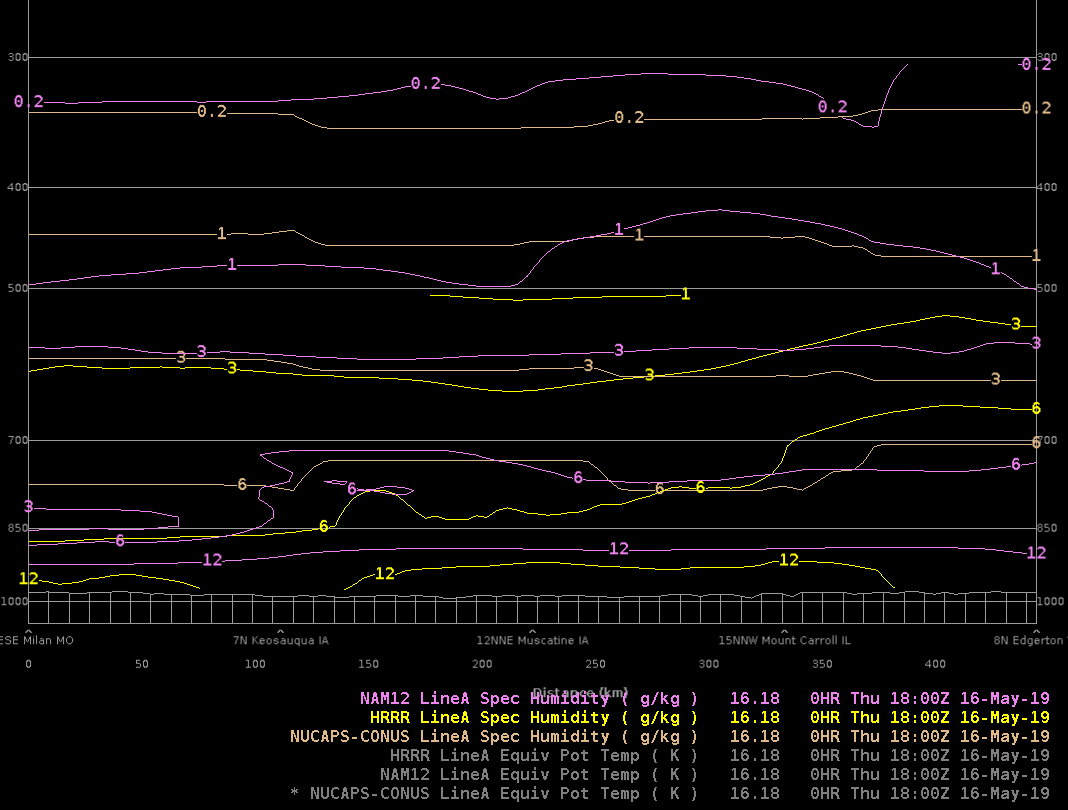
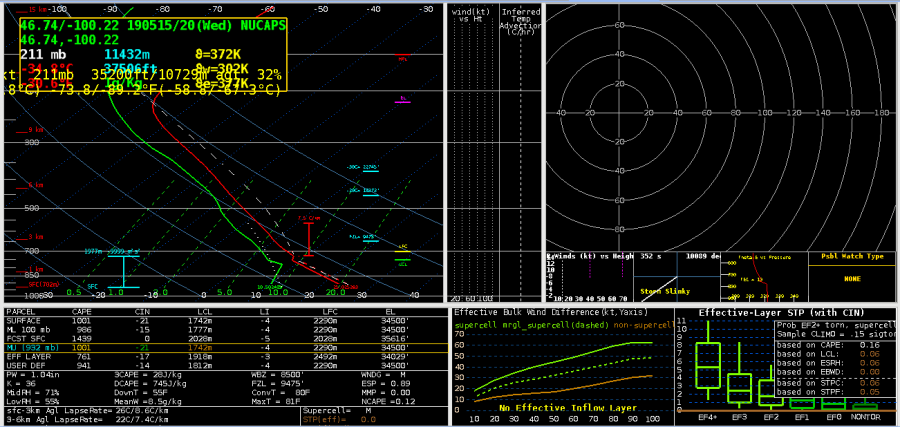
I compared NUCAPS 18z skew-t (from clear air area) to NAM and GFS skew-t’s, at the same time and location.
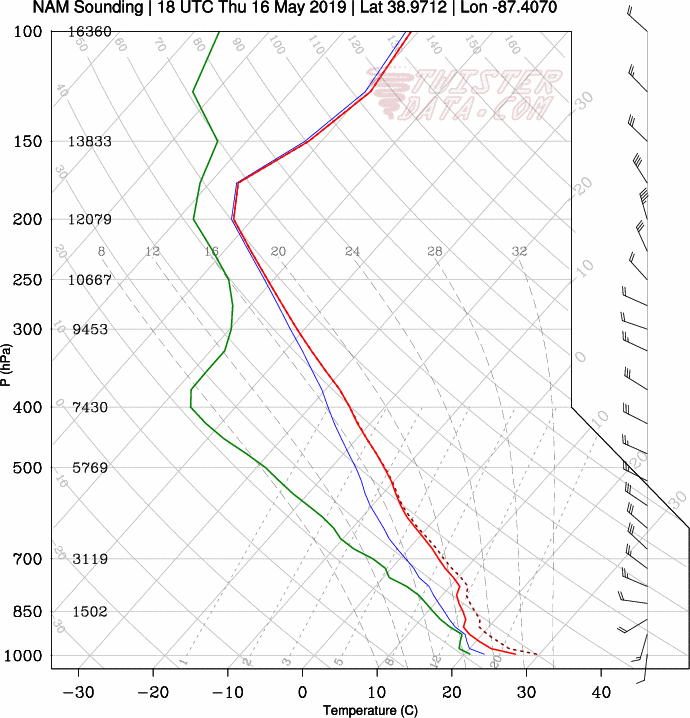
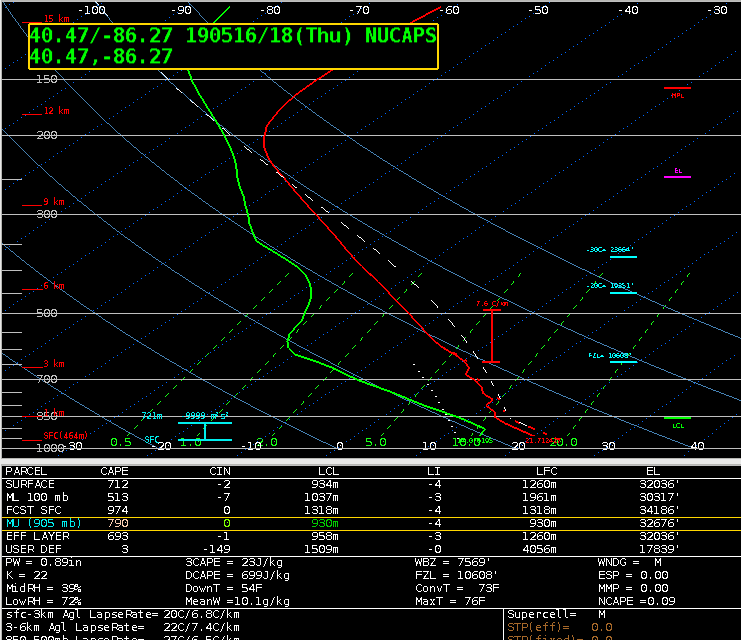
NUCAPS presents a much more stable and dry environment than the model skew-t shows, and also much more stable than the actual current environment considering this storm has already produced hail, tornadoes and heavy rain.
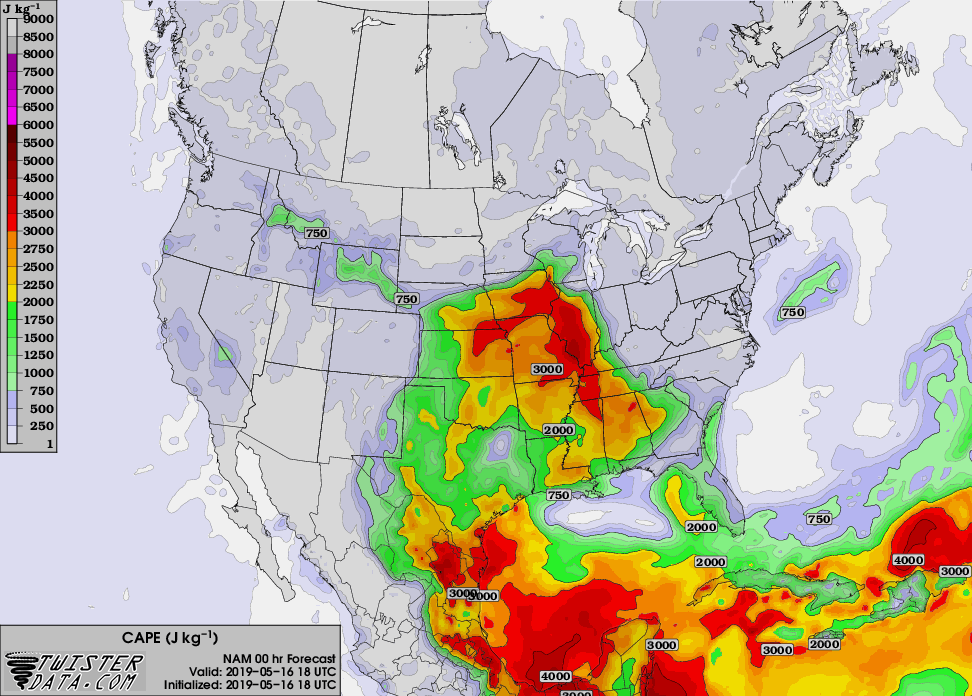
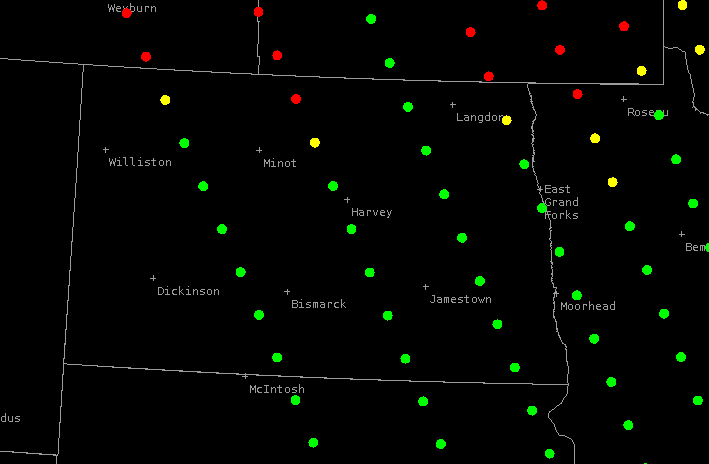
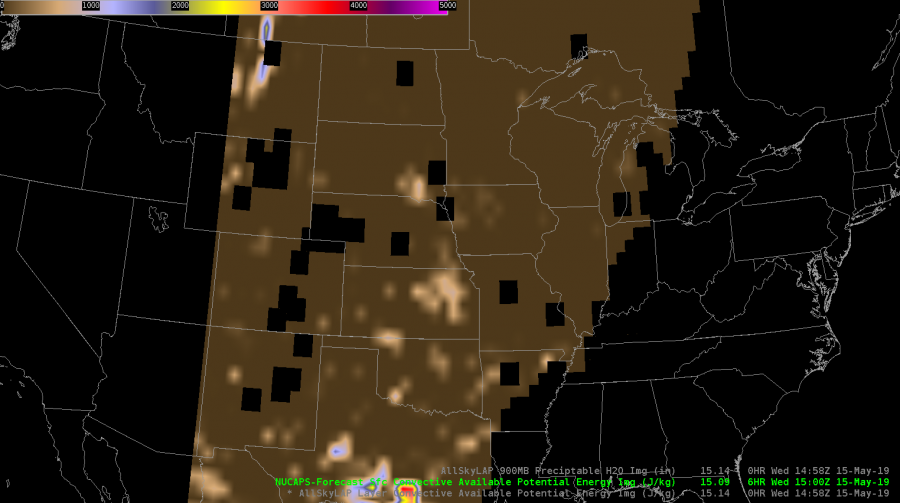
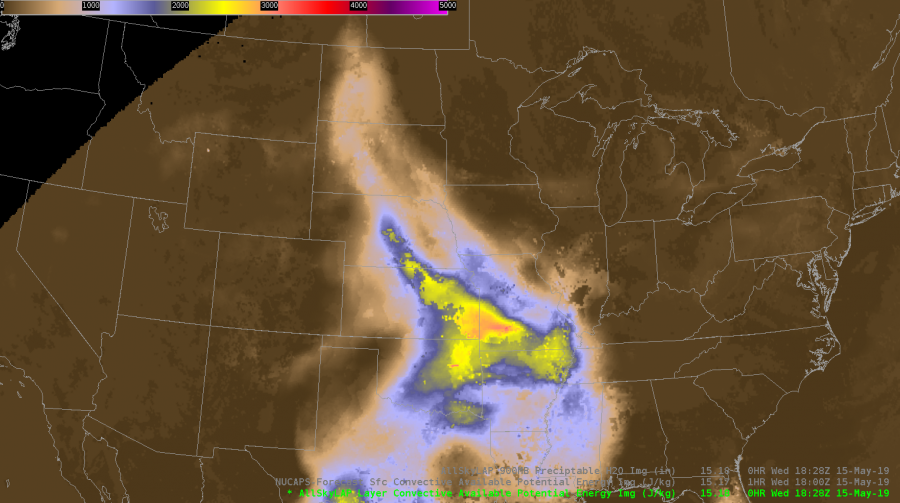
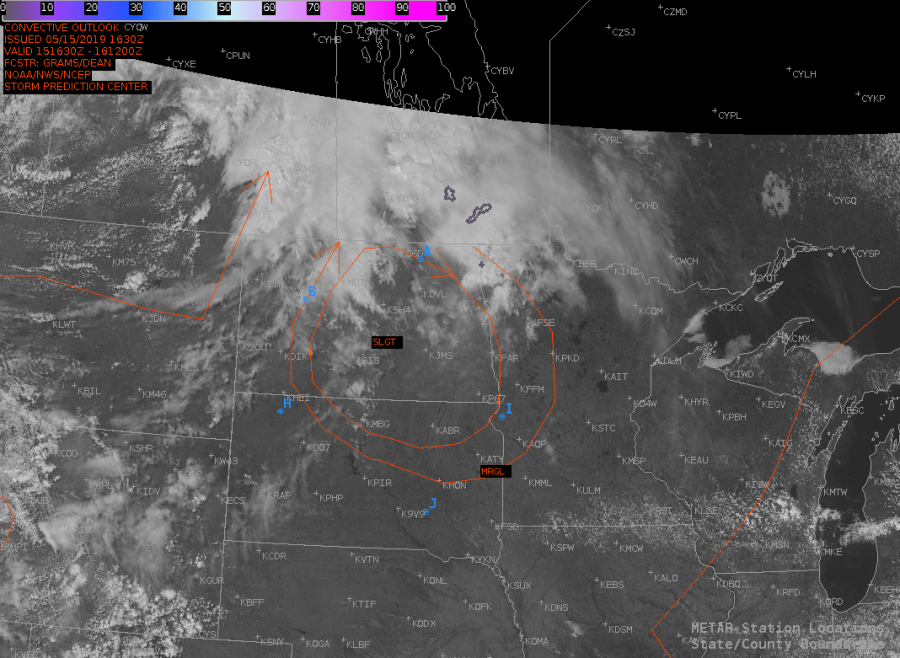
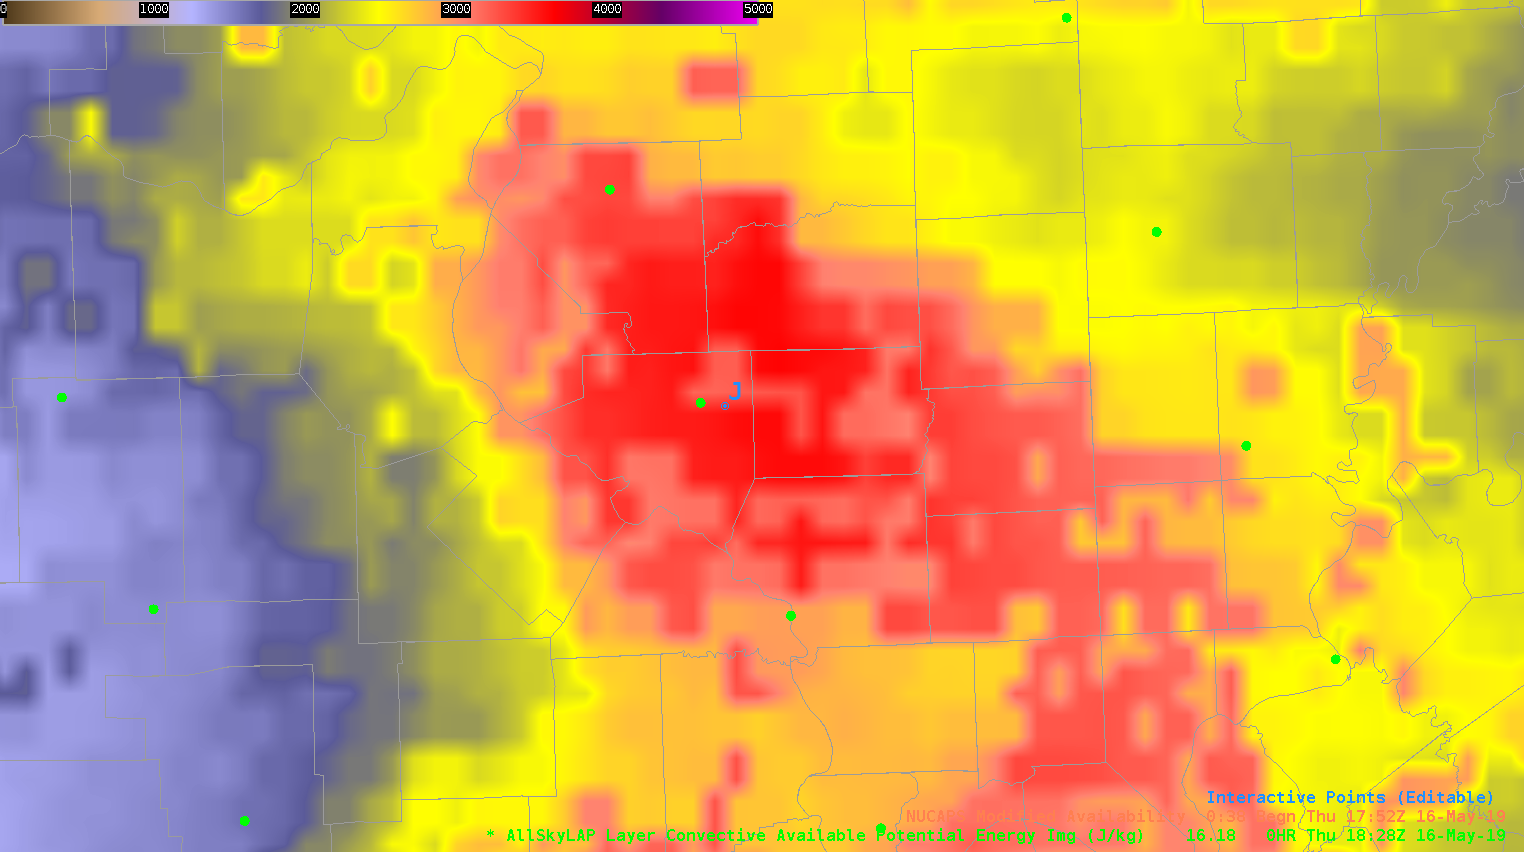 Next, I compared an AllSkyLAP CAPE img at 18z (point J on the above picture), to a NAM CAPE map over the same area/time. AllSkyLAP seems to be about 500J/kg higher than the NAM CAPE map.
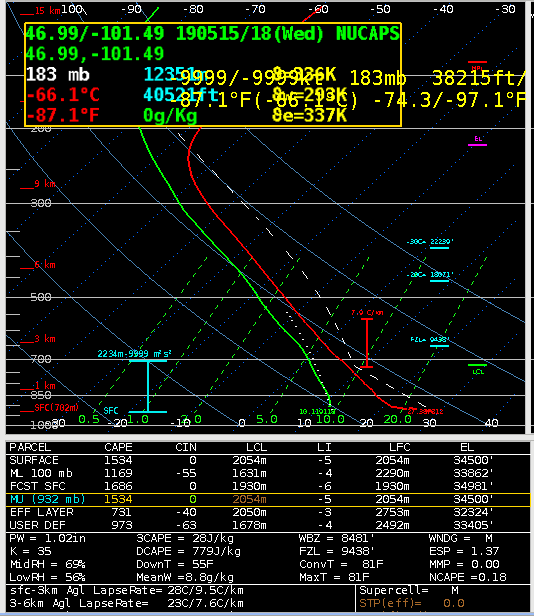
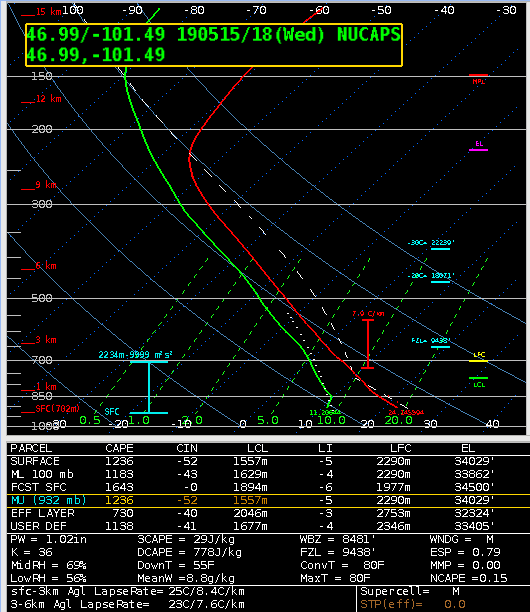
Finally, I compared a NUCAPS CAPE img and the NUCAPS Skew-T at 18z over the same area and there was a huge variance. The skew-t was higher than the CAPE img by over 1300J/kg.
Lastly I decided to compare NUCAPS and model data from a stable area, non changing area.
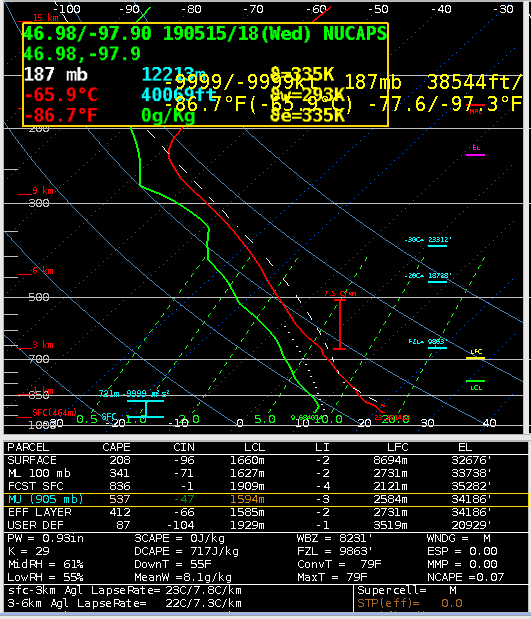
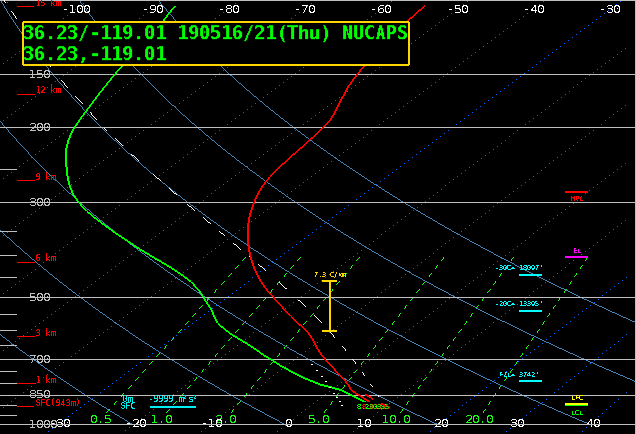
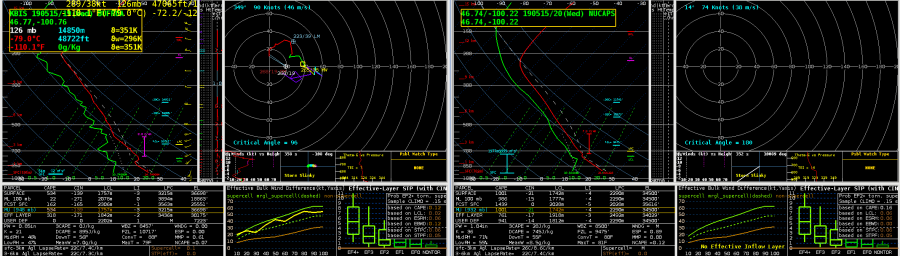
I compared an observed skew-t from the KS/OK boarder to a NUCAPS skew-t. There is a one hour difference in the data but for the sake of this comparison I think this will work. 
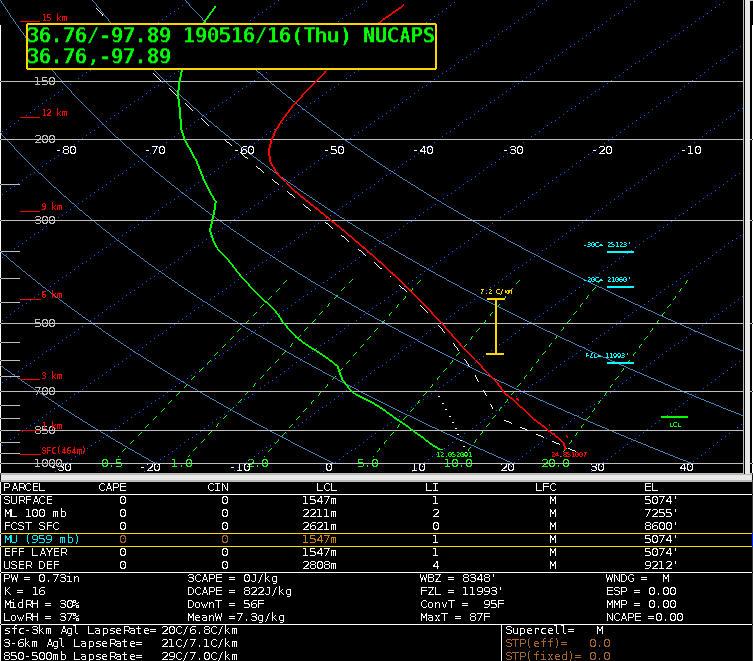
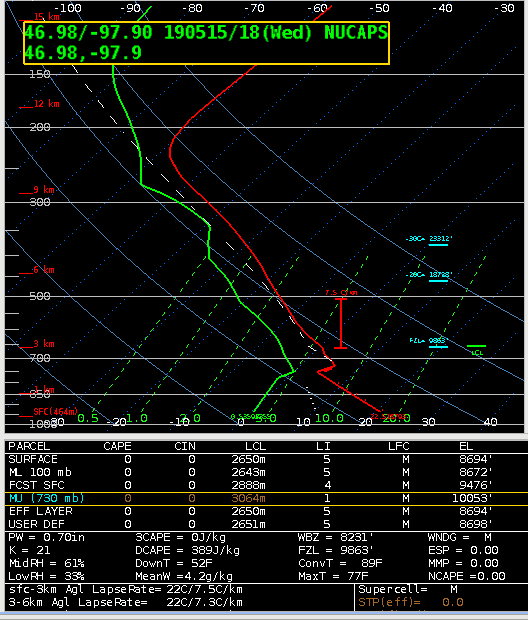
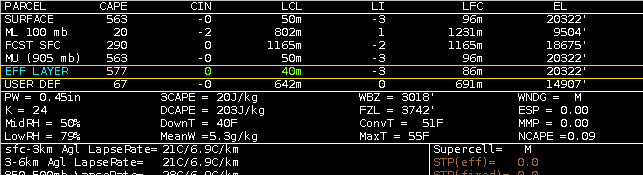
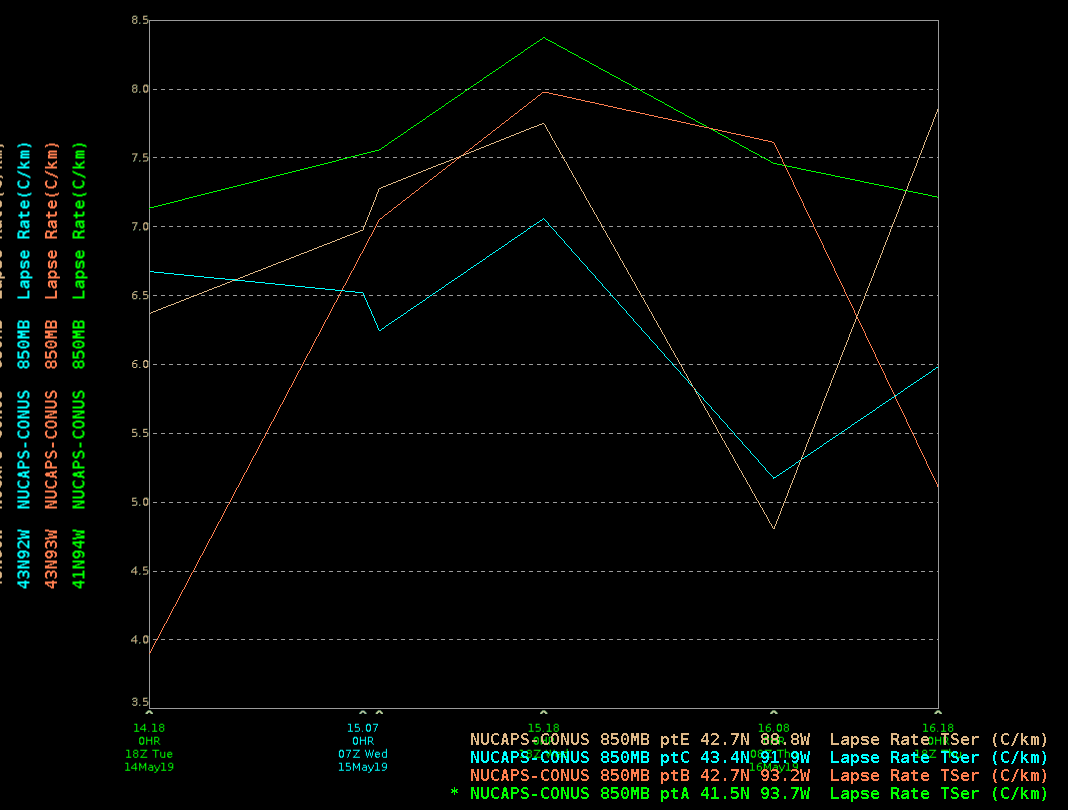
The observed skew-t is a relatively dry column with .87pw and a T/D of 31/20C at the surface and 10/-20C at 700mb. The CAPE is at a ridiculous 3746 J/kg. But with no moisture, lifting mechanism nor shear I wouldn’t expect development. When compared to the NUCAPS skew-t one can see a definitive difference. CAPE on the NUCAPS is at 0 with T/D at 24/11C at the surface and 7.9/-9.3C at 700MB which is a huge departure from what the observed skew-t showed…but how would the observed skew-t hold up to a model skew-t?
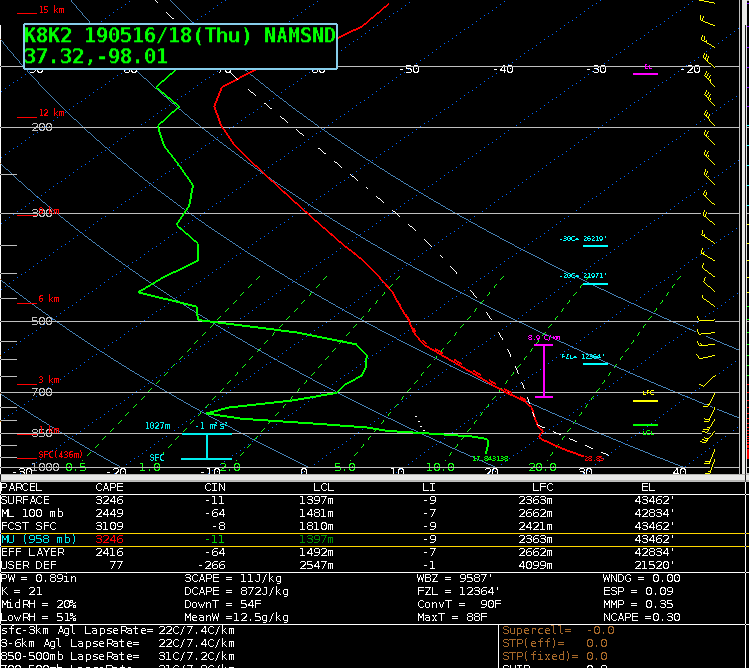 NAM 18Z model skew-t compared to the 17Z observed skew-t from the same area shows 28/17C SFC temps, only 3C off from the observed skew-t and at 700MB NAM shows 9.5/-8C only .5C off the temperature and 11 off the DP. Also, CAPE was much closer than when compared to the NUCAPS where SFC CAPE on the NAM is 3246J/kg and 3746J/kg on the observed.
Overall, after this small sample size of data, both severe weather and in clear weather, I believe that I would continue to use NAM/GFS over NUCAPS for my point based forecast needs.
***DESMOND***


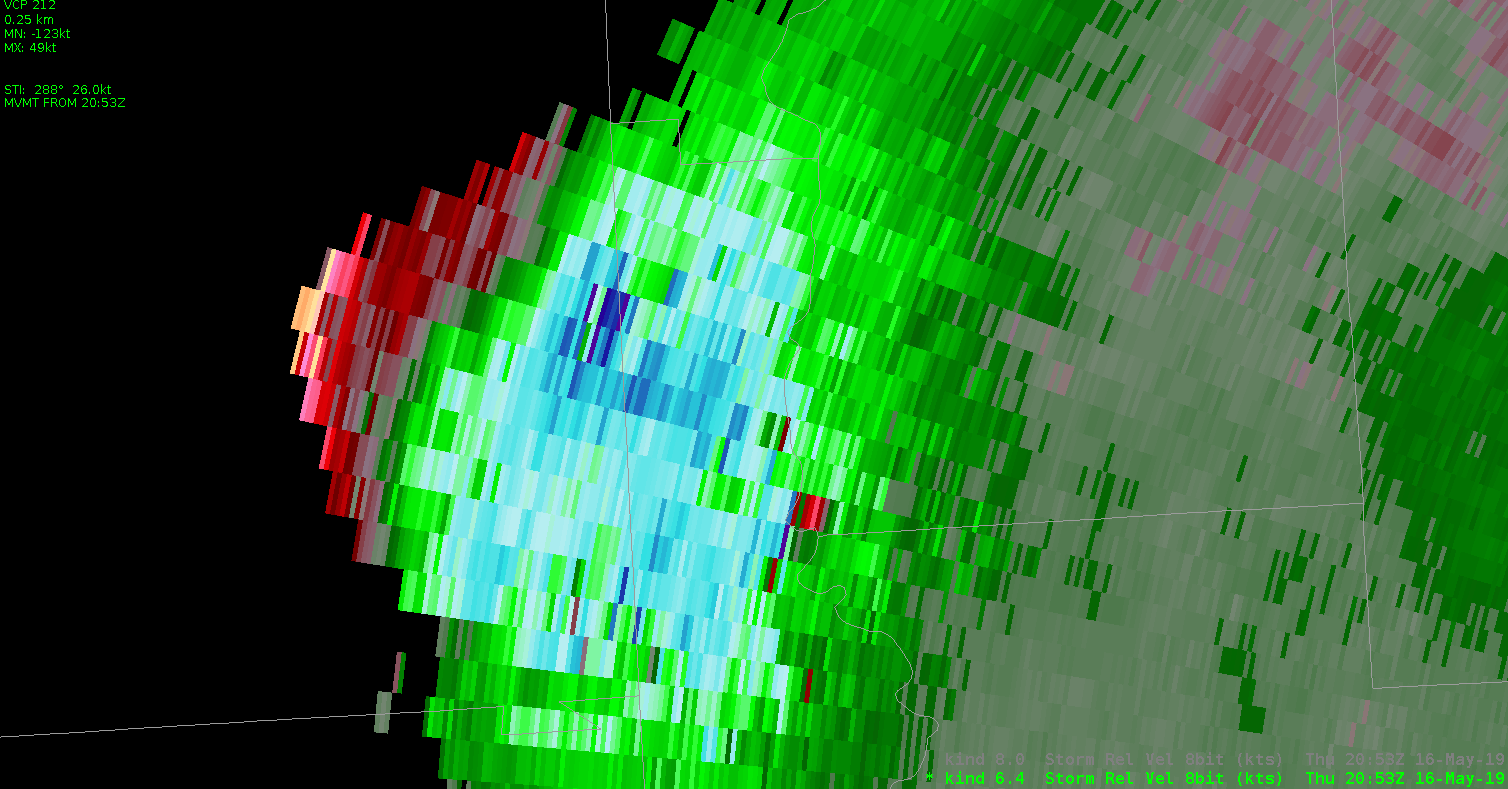
 15 min prior to 1.75″ hail and 20 min prior to baseball-size hail, a supercell tracked NNW-SSE through Vermillion Co, IL …the Probsvr nailed the values for ProbHail at 96%, VILD 4.3, and a well defined TVS (100kt G-G) and strong MESO on NEXRAD ~ 7k’
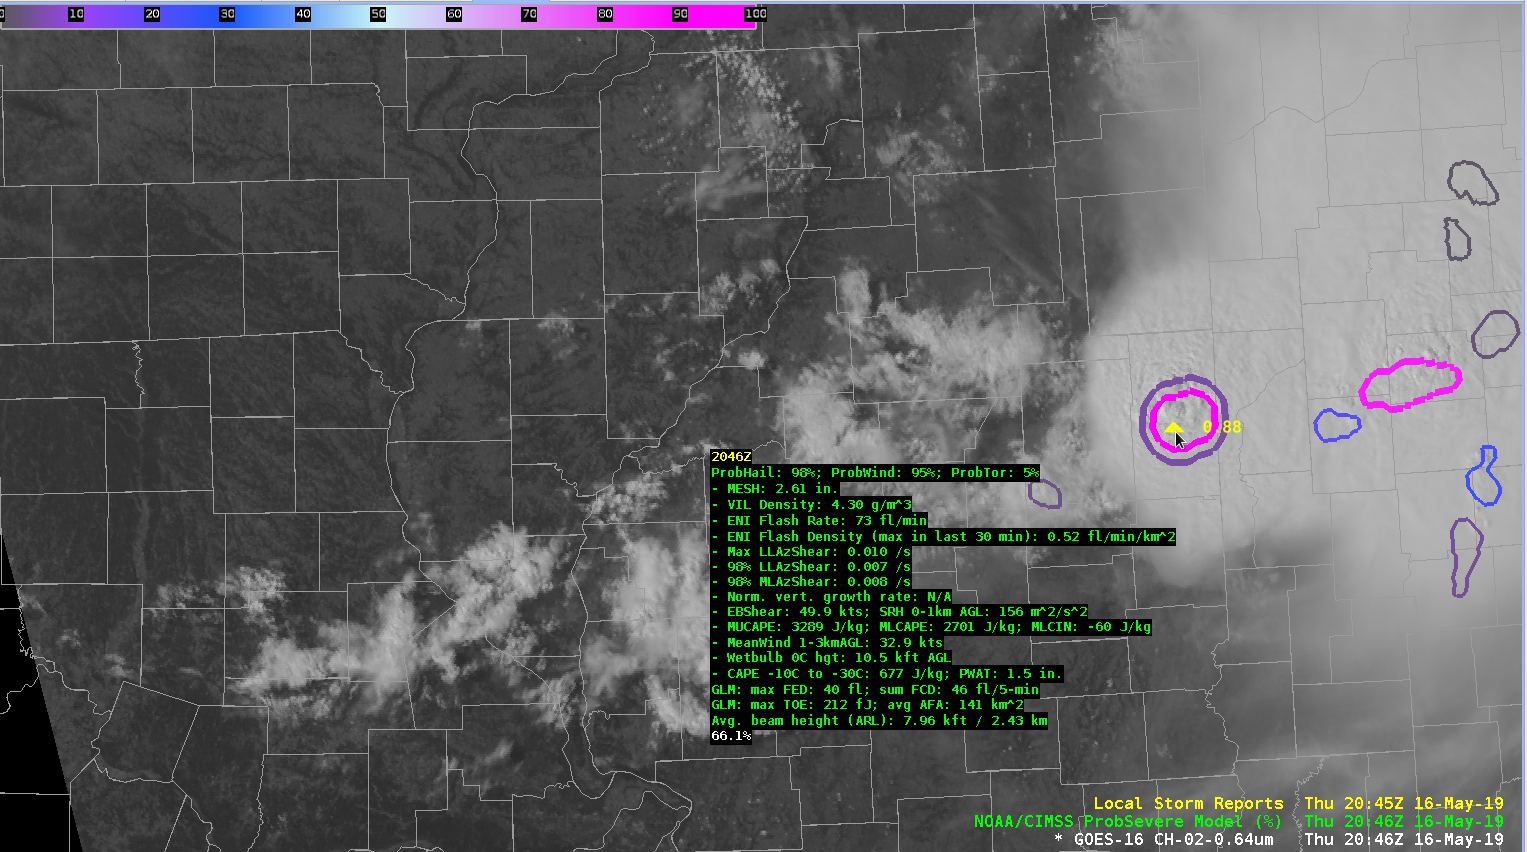 NUCAPS SVR TS values kinda nailed it in Ern IL :
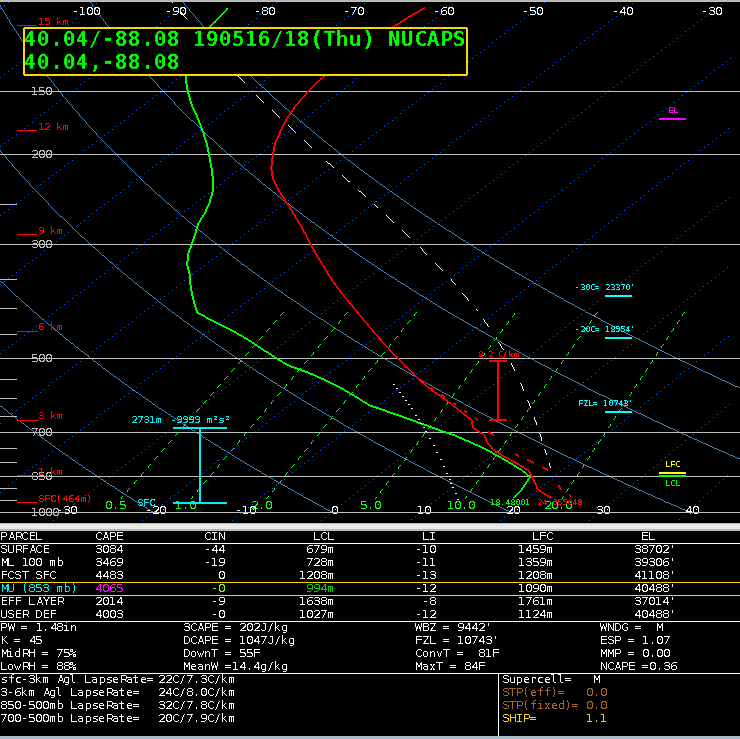
 This storm is not diminishing, with Storm Top DIV remaining well over 100kt
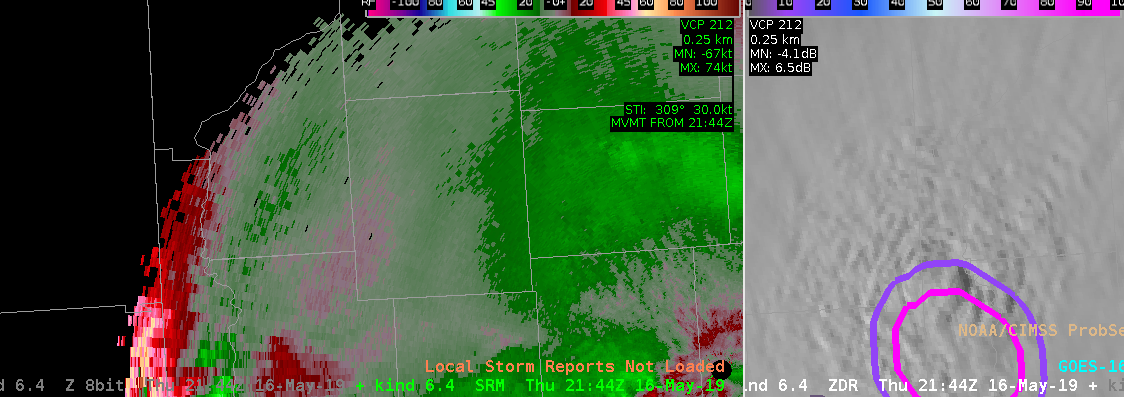 Eastern end of MCS continues to chug thru central IN (2130-2300z),
  ProbSVR ~ 23z looking good, more warnings on the way
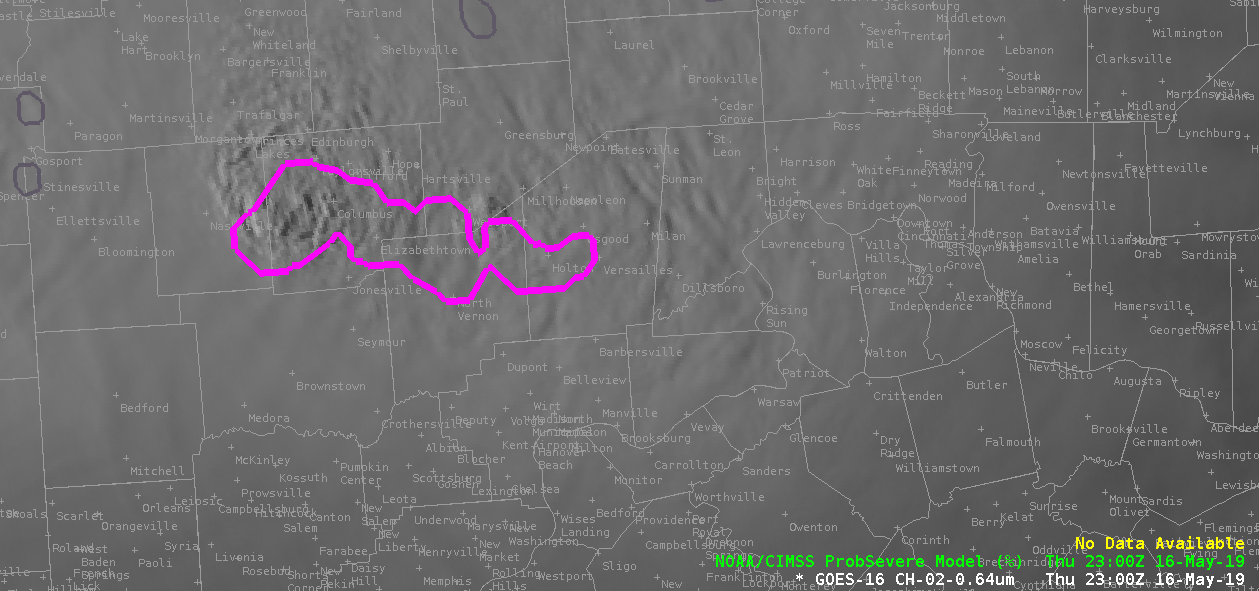
 Thru the period the SVRProb and SVRtor seemed to regularly over warn during this outbreak, BUT SVRHail was spot on, a little False Alarm-y, but it sure didn’t miss the Large Hail reports, with %s >90 both instances. The RGB Day Convection GOES product seemed to respond pretty well with the hail instances as well.
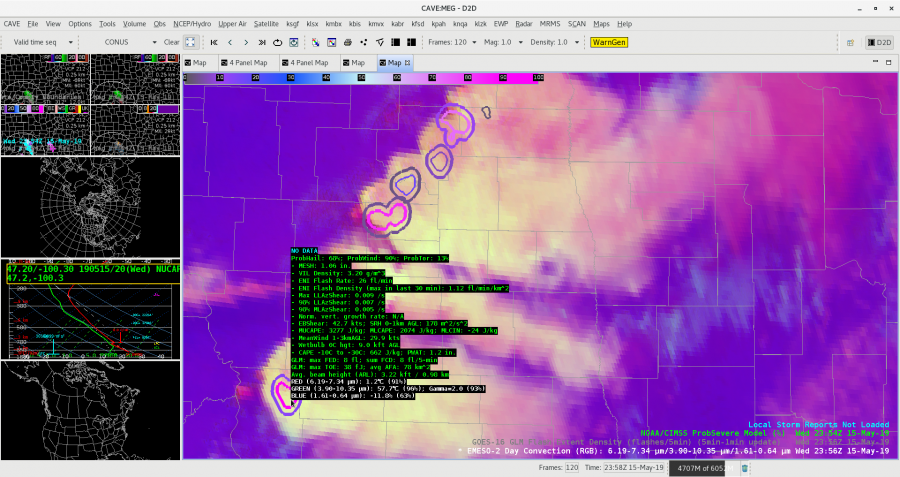
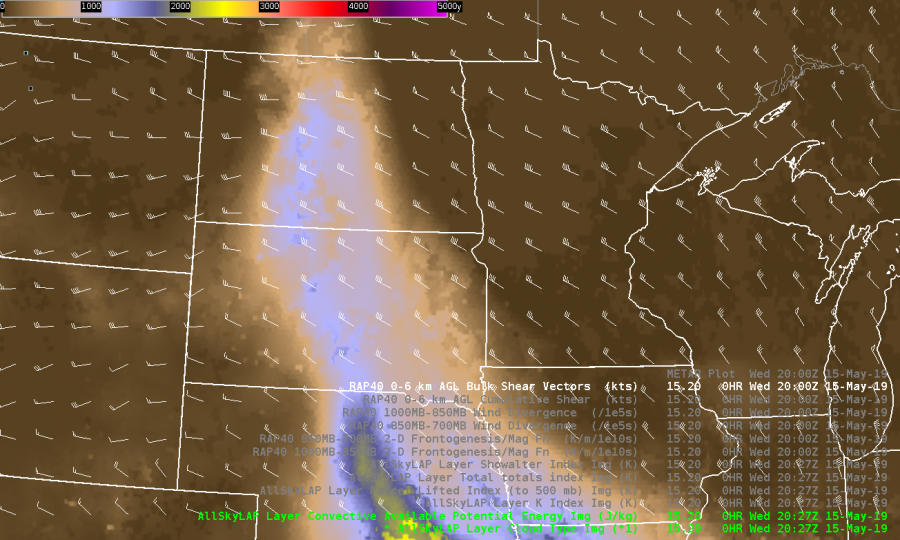
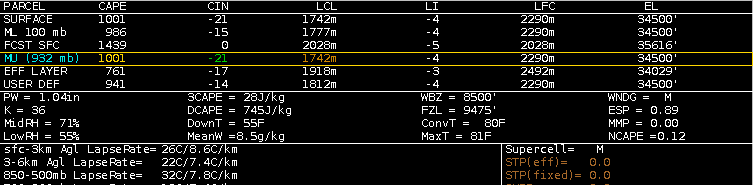
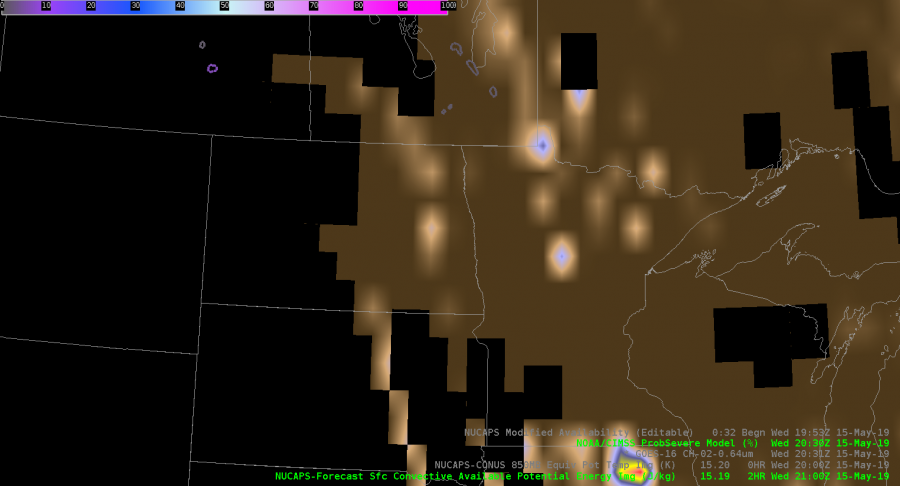 To further confuse matters the NUCAPS forecasted SFC CAPE values for the same location and time is 400J/kg…which is closer to the observed sounding than to the NUCAPS sounding.