An official website of the United States government
Here’s how you know
Official websites use .gov A
.gov website belongs to an official government
organization in the United States.
Secure .gov websites use HTTPS A
lock (
) or https:// means you’ve safely connected to
the .gov website. Share sensitive information only on official,
secure websites.
Below is a loop of the NUCAPS CAPE forecast for the afternoon across the CTP CWA.
Unfortunately, the product is very blocky, and makes it hard to use, especially since some of the missing data is in the time and place where high impact weather may occur. It’s clear that it is trying to show some elevated CAPE moving across central Pennsylvania, but the values are very suspect to me given the missing chunks of information.
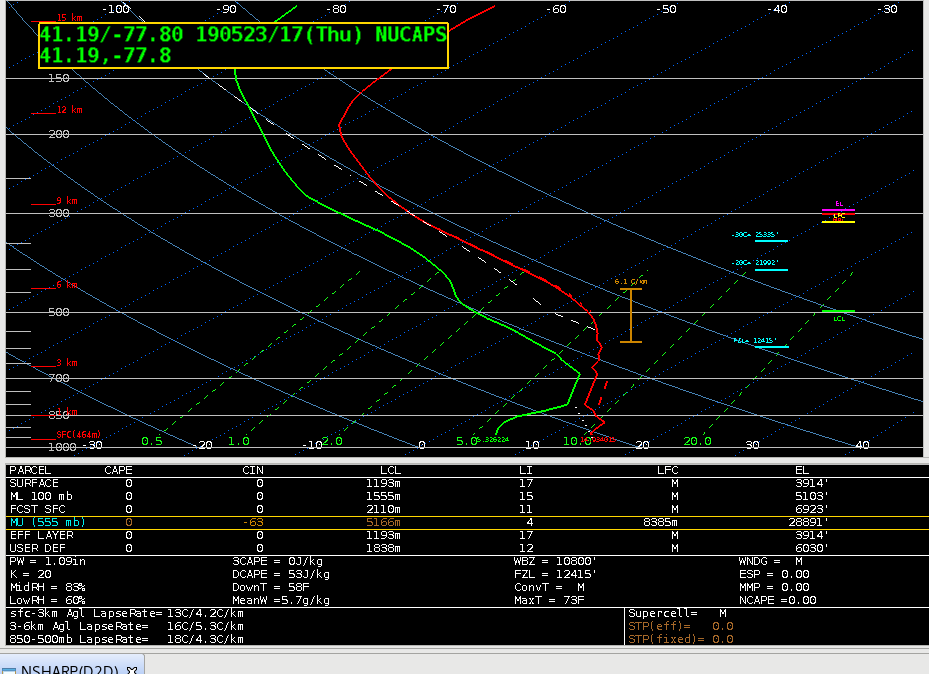
The air mass in the CTP CWA has been modified somewhat based on earlier convection. Here’s a NUCAPS sounding from central PA (note that it was yellow, meaning it IR retrieval failed due to clouds, but the microwave was successful).
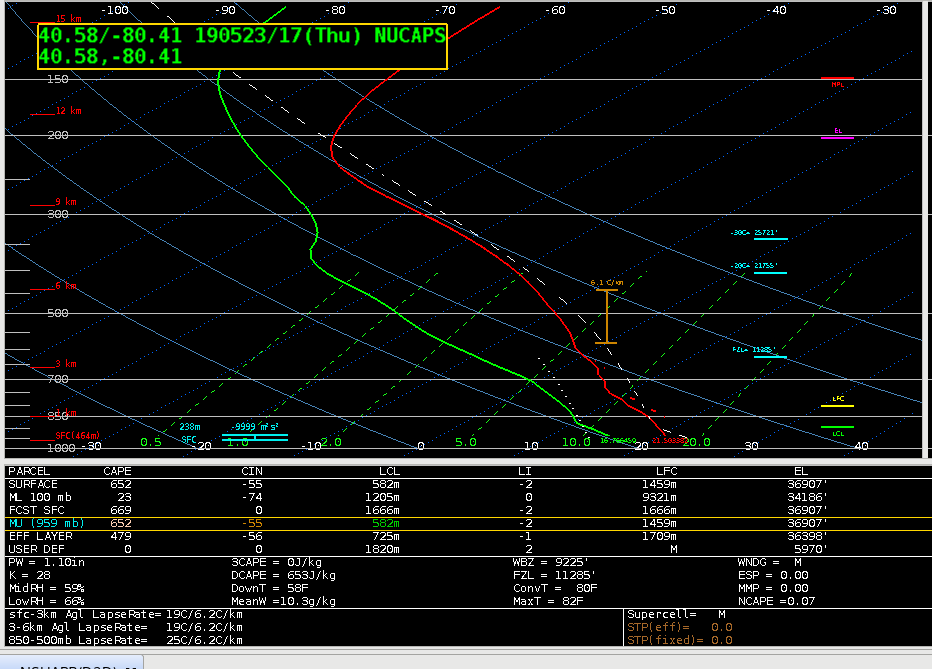
Notice the low level CAP, as well as the modest mid level lapse rates of 6.1 C/km. To get an idea of the air mass characteristics, I looked at a couple of NUCAPS soundings further to the west. The first was west of Pittsburgh along the PA/OH border.
The mid level lapse rates were the same as further east, but the warmer temps and higher dew points were supporting non-zero SBCAPE values. There was still some CIN, however, and the MLCAPE was a paltry 23 J/kg.
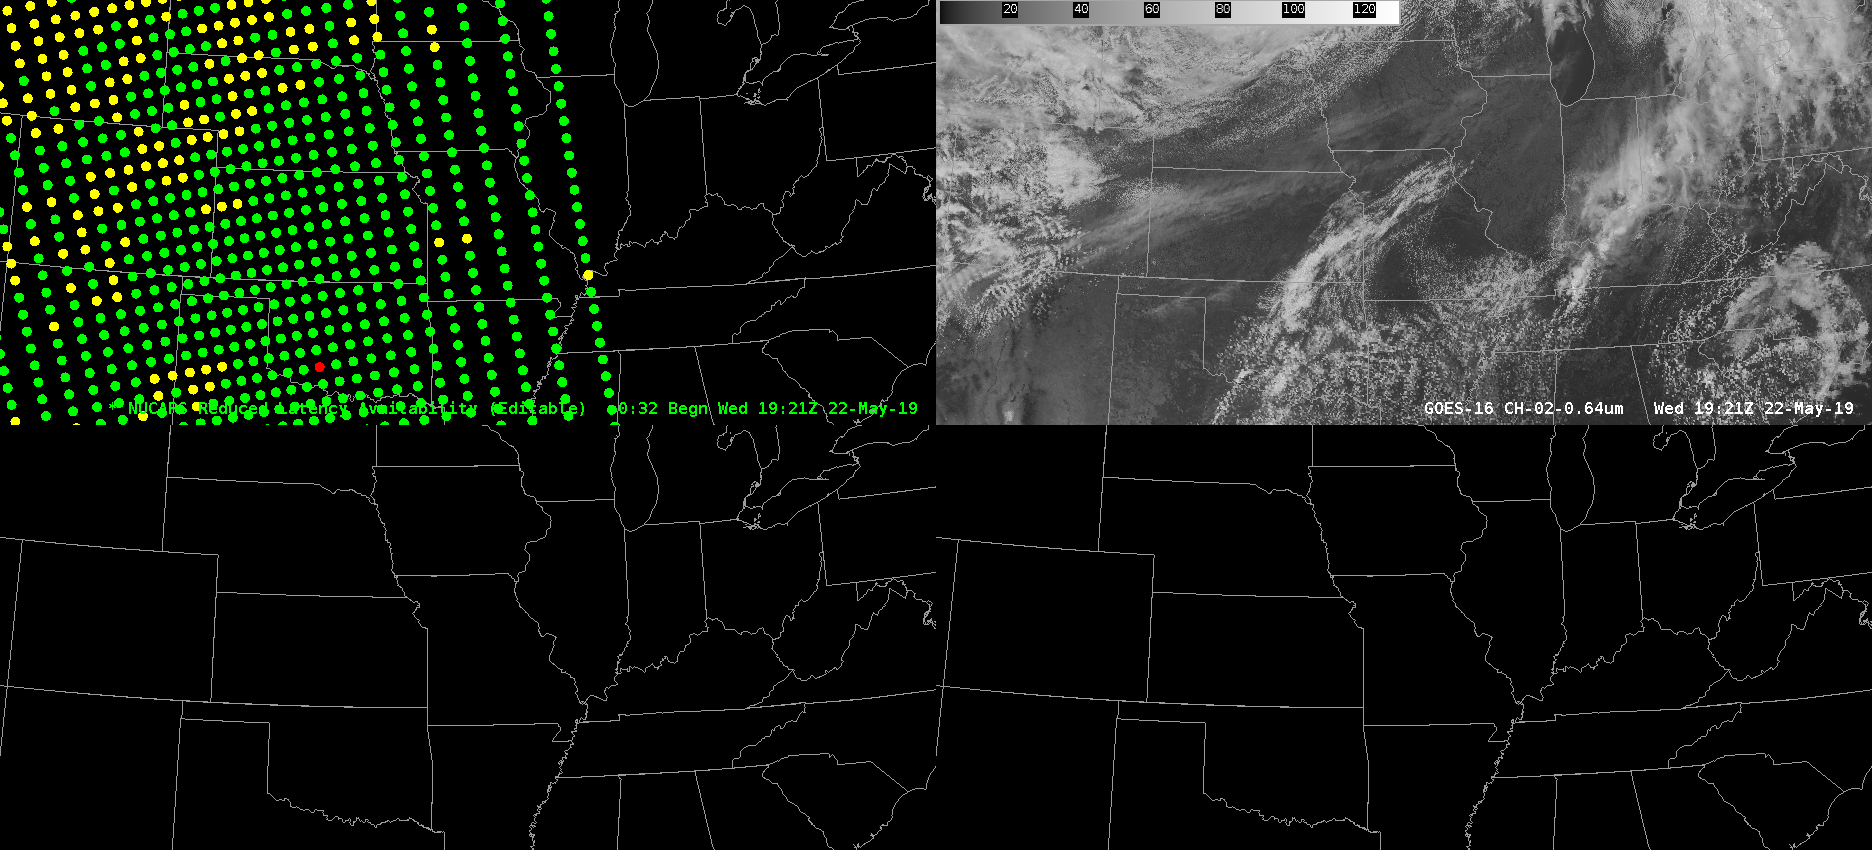
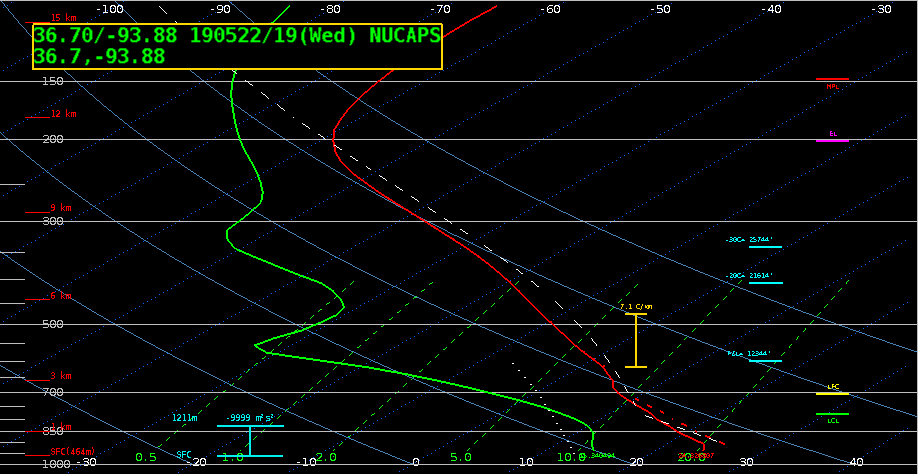
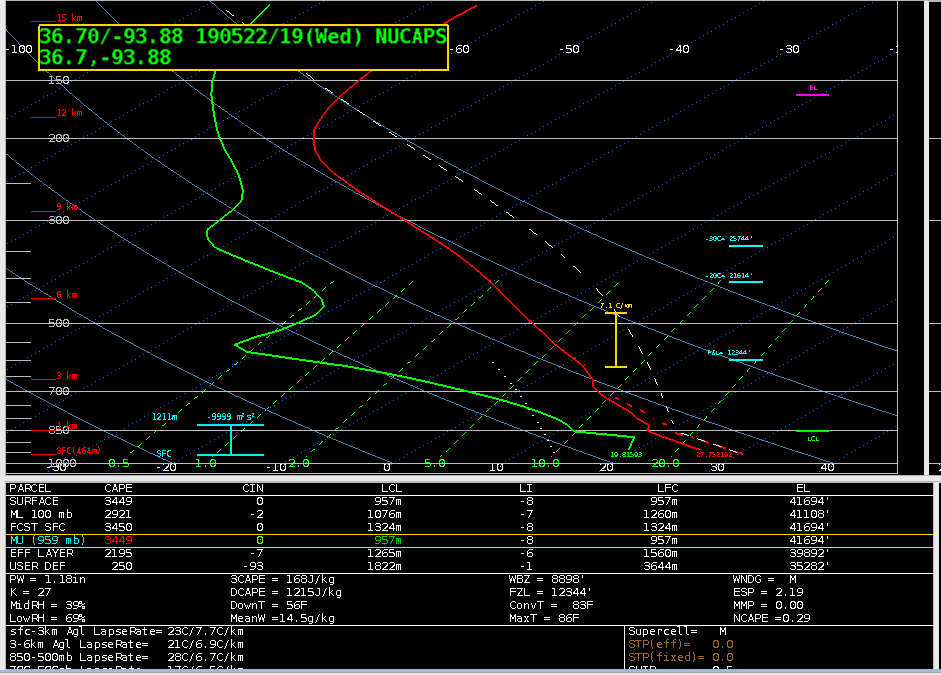
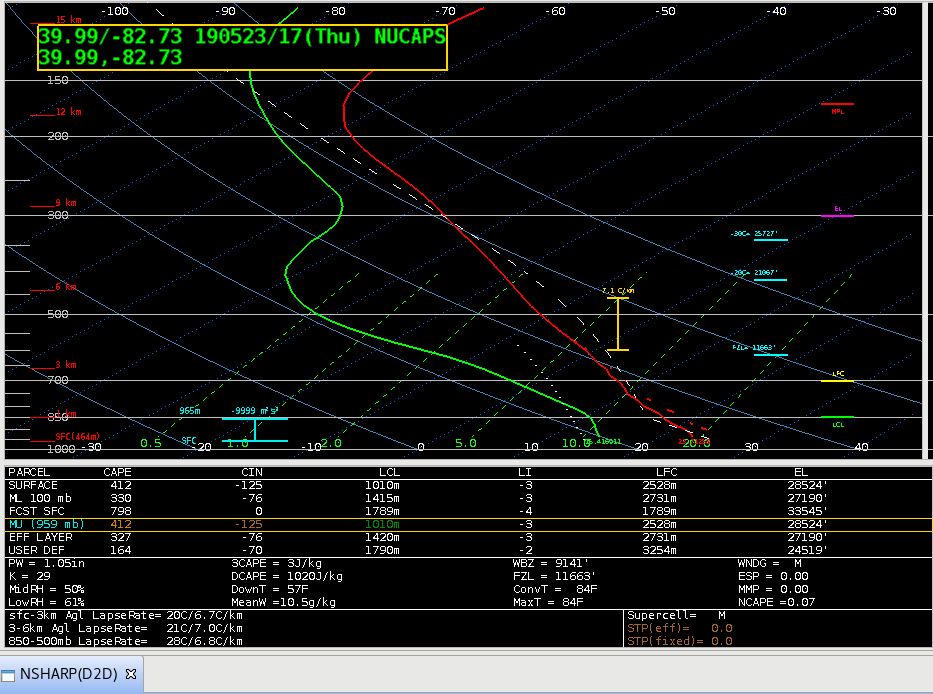
Moving further west, I examined a NUCAPS soudning in central Ohio, potentially indicative of the air mass that would move into the CWA later in the day due to the mean westerly flow at mid and upper levels.
There was a noticeable difference in the mid level lapse rates, with a more significant value of 7.1 C/km. Also notice the DCAPE was in excess of 1000 J/kg, compared to values of 500-600 J/kg further east. This would indicate that there will be at least a threat of severe winds with convection that develops later in the day in the CTP CWA despite the early in the day convection that modified the air mass during.
NUCAPS data points from a polar orbiting NOAA-20 pass matched up with clear skies. The following NUCAPS profiles were from the extreme southwest part of Missouri.
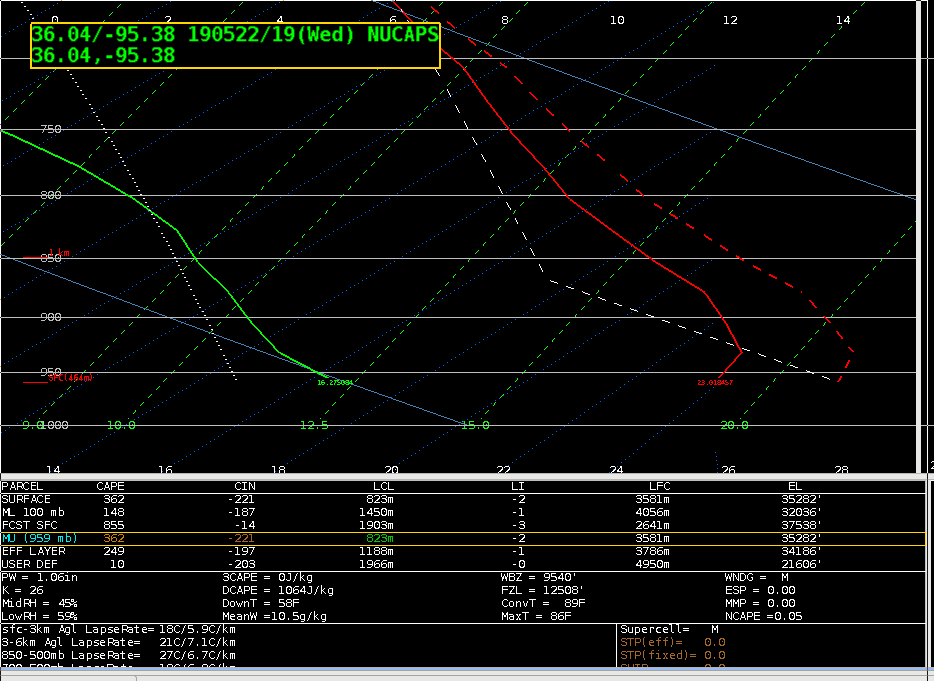
Unmodified NUCAPS profile from southwest Missouri, well south of Springfield. Surface dewpoint was estimated at 57-58 F. MUCAPE only up to 600 J/kg, with MLCAPE of 500 J/kg.
Modified NUCAPS data points from a NOAA-20 pass. Note data void through central Missouri….??? 🙁
Modified NUCAPS profile in same location as the unmodified sounding. Surface dewpoint was estimated at 67-68 F. High MUCAPE up to 3500 J/kg, with MLCAPE at 2900 J/kg.
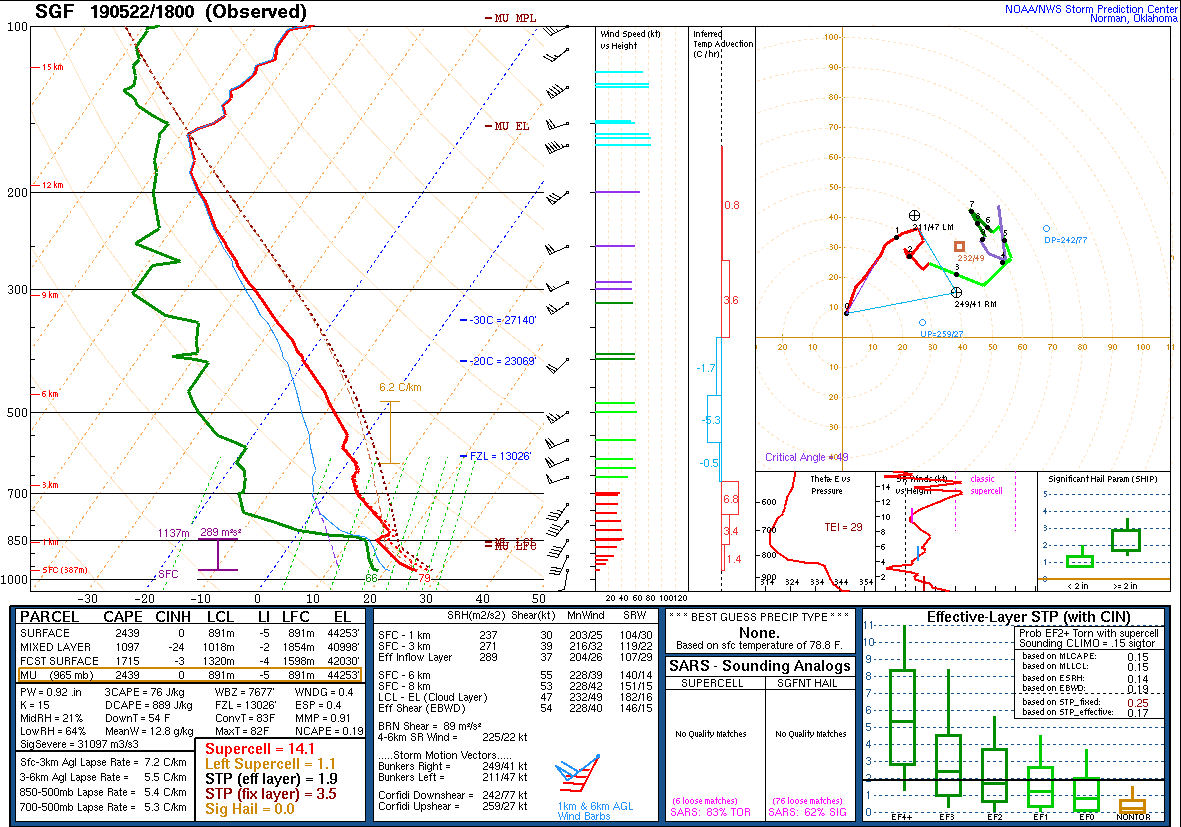
Observed sounding from Springfield, MO at 18Z. MUCAPE is 2500 J/kg, mixed layer down to 1000 J/kg. The surface dewpoint was about the same as that of the modified NUCAPS. But the difference in MU/MLCAPE is significant. I think the modified NUCAPS added value over the unmodified. Unfortunately, it seems a little overdone. With that said, the instability probably increased between the observed sounding time of 18Z and the satellite pass near 1920Z. An MUCAPE closer to 3000 J/kg is probably not too far off — maybe by ~500 J/kg. -Roy
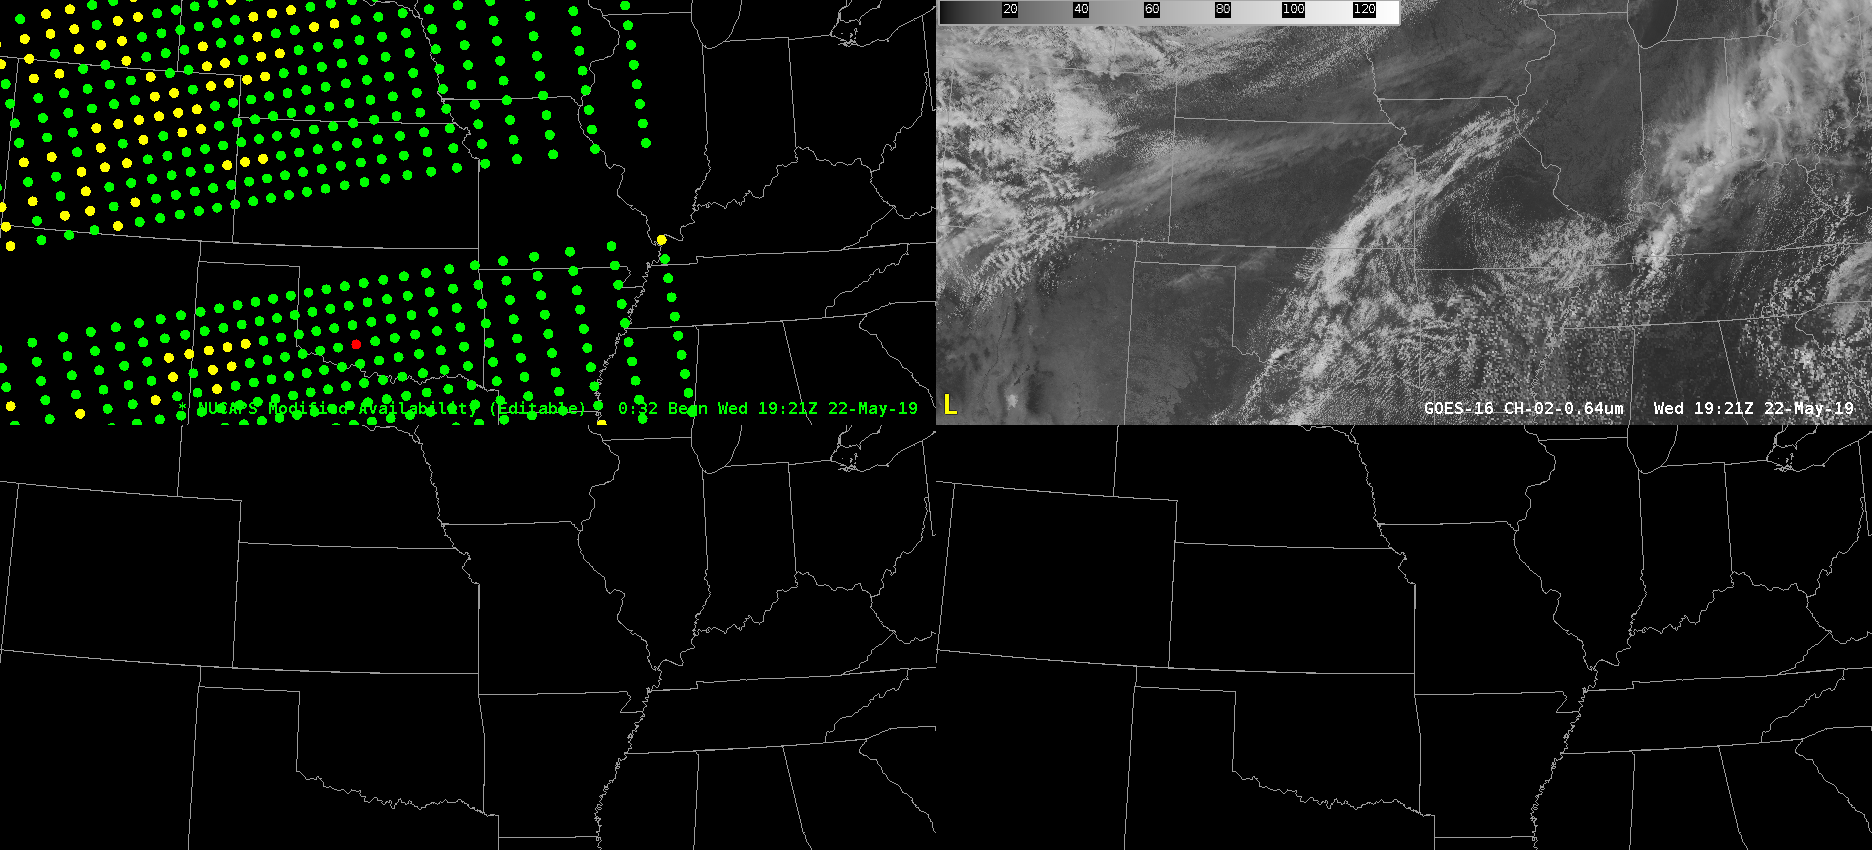
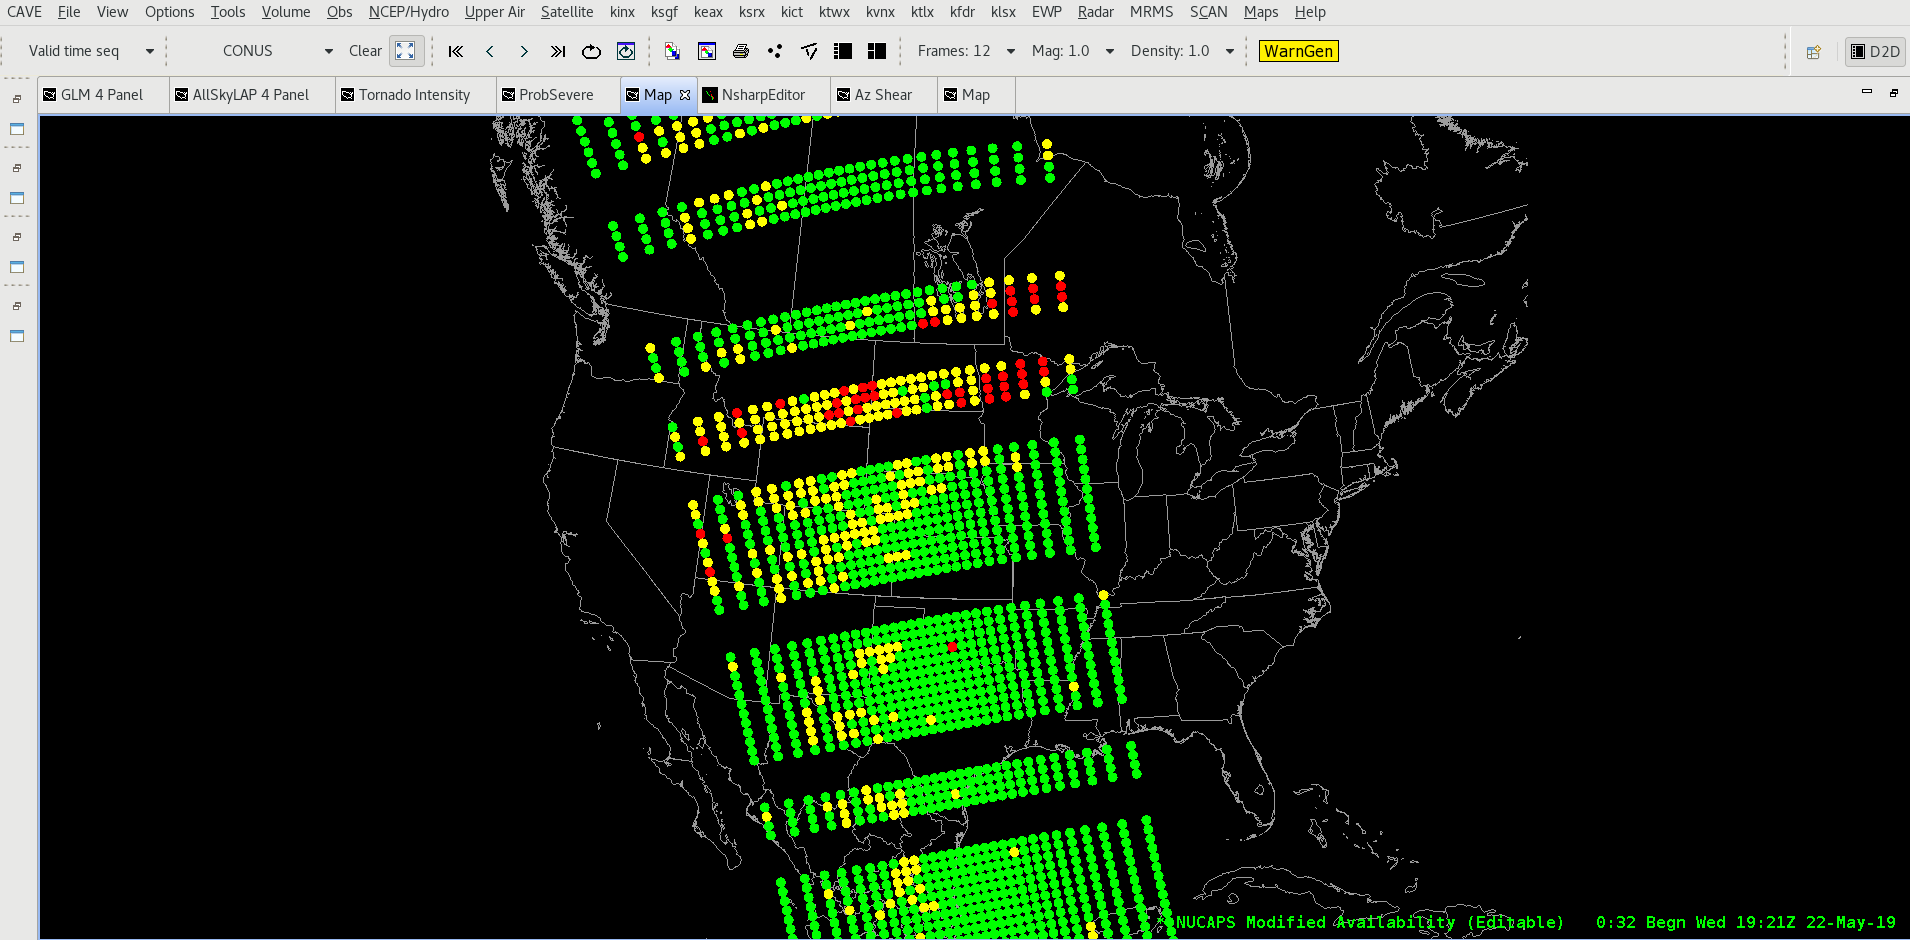
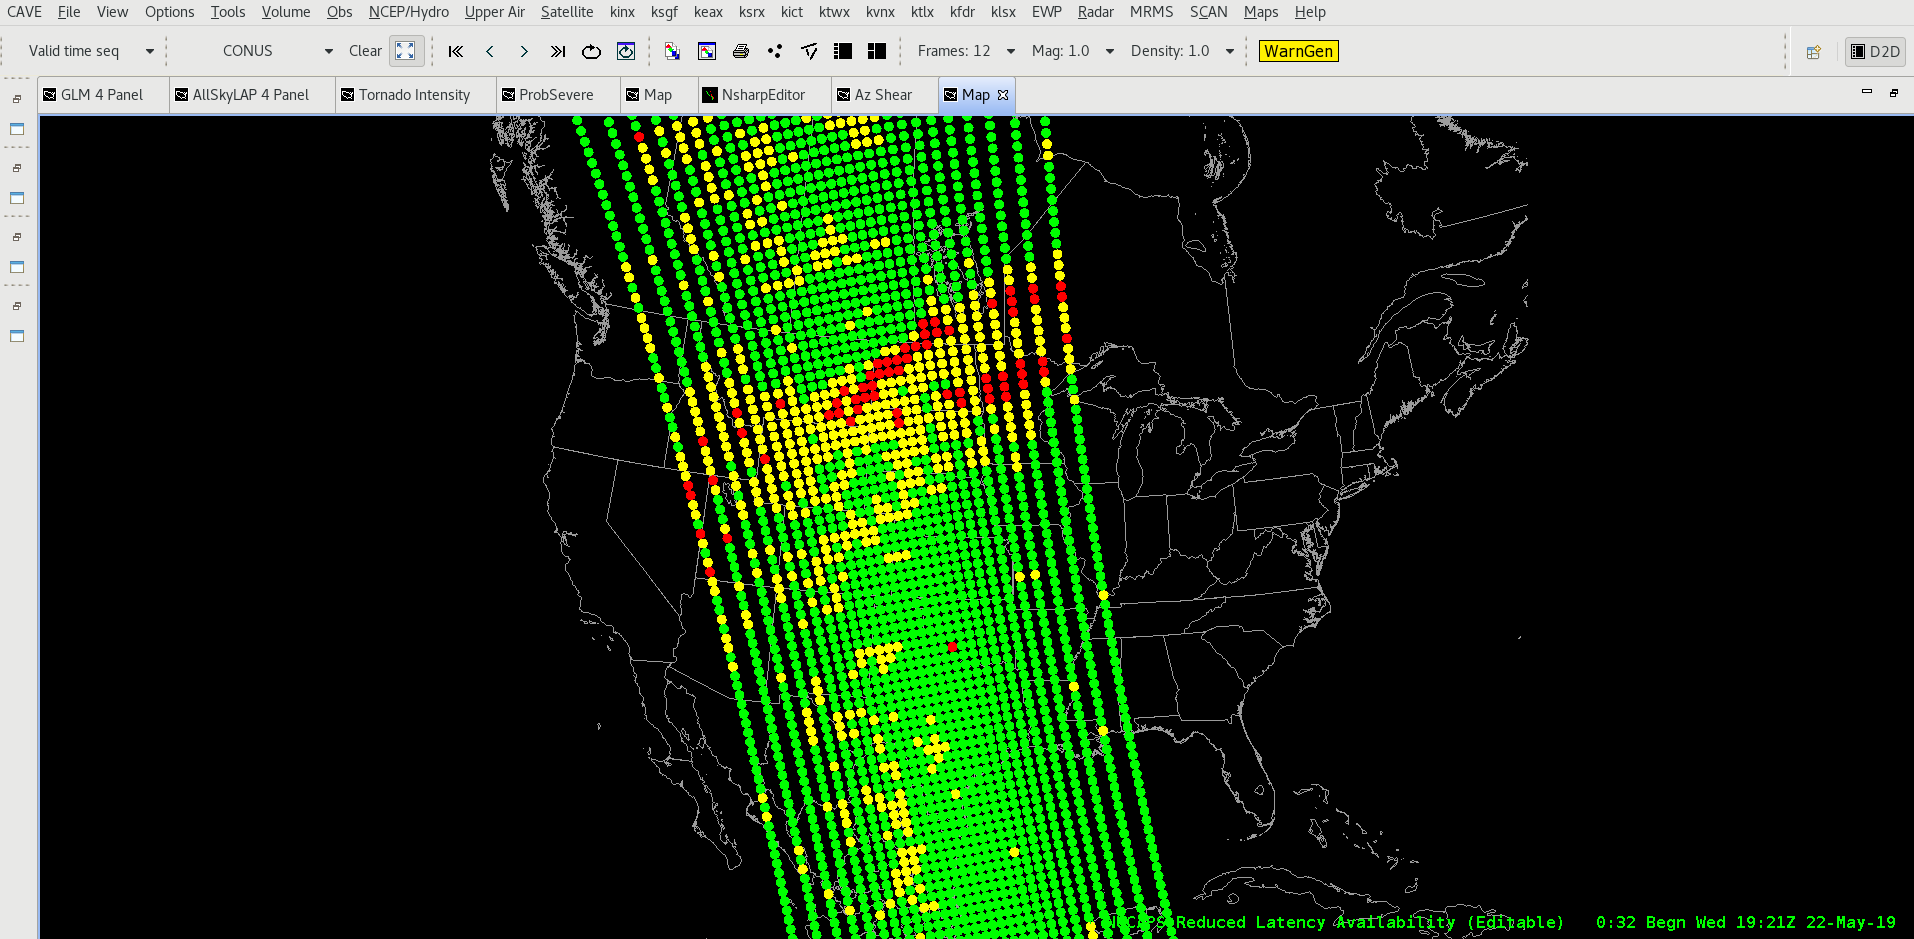
Working the SGF CWA this afternoon, I wasn’t able to use the modified NUCAPS soundings, as there was a gap in the availability coverage right over that area. Below are maps of the modified sounding availability vs the reduced latency availability.
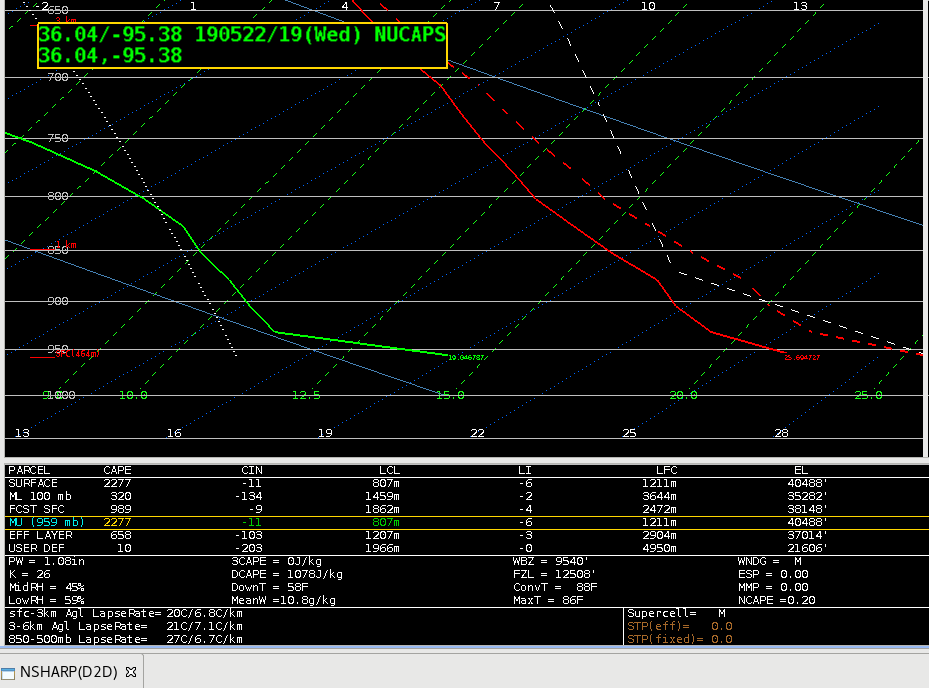
This post is going to compare the significant differences between the modified and unmodified NUCAPS sounding near Tulsa, OK at 19Z on May 22.
First a look at the unmodified sounding. It actually shows a small temperature inversion near the surface in the boundary layer, with a surface temperature of 75, and a surface dew point of 61. This resulted in a computed surface-based CAPE of 362 J/kg, and a mixed layer CAPE of 148 J/kg. Now let’s look at the NUCAPS sounding modified for the 19Z observed surface temp and dew point.
the modified NUCAPS soudning used the surface temp of 78 and surface dew point of 69. This caused a very large difference in the surface-based CAPE, with a value of 2277 J/kg (about 7X the unmodified). The MLCAPE also more than doubled to 328 J/kg. Interestingly, the All Sky CAPE (which is designed to match the MLCAPE more closely then the SBCAPE) at the same time in the same area gave an estimate of 1627 J/kg (not shown). That would indicate that both the modified and unmodified versions significantly underestimated the instability, but the modified gave forecasters a much better idea of the potential based on the much higher SBCAPE.
I also noticed that the mixing process the modified NUCAPS used for the surface observation produces a rather unrealistic near surface profile. I think an improvement in the mixing scheme could improve the use of the modified NUCAPS soundings further. Despite that, the current modified does give a better indication of the convective potential in this case.
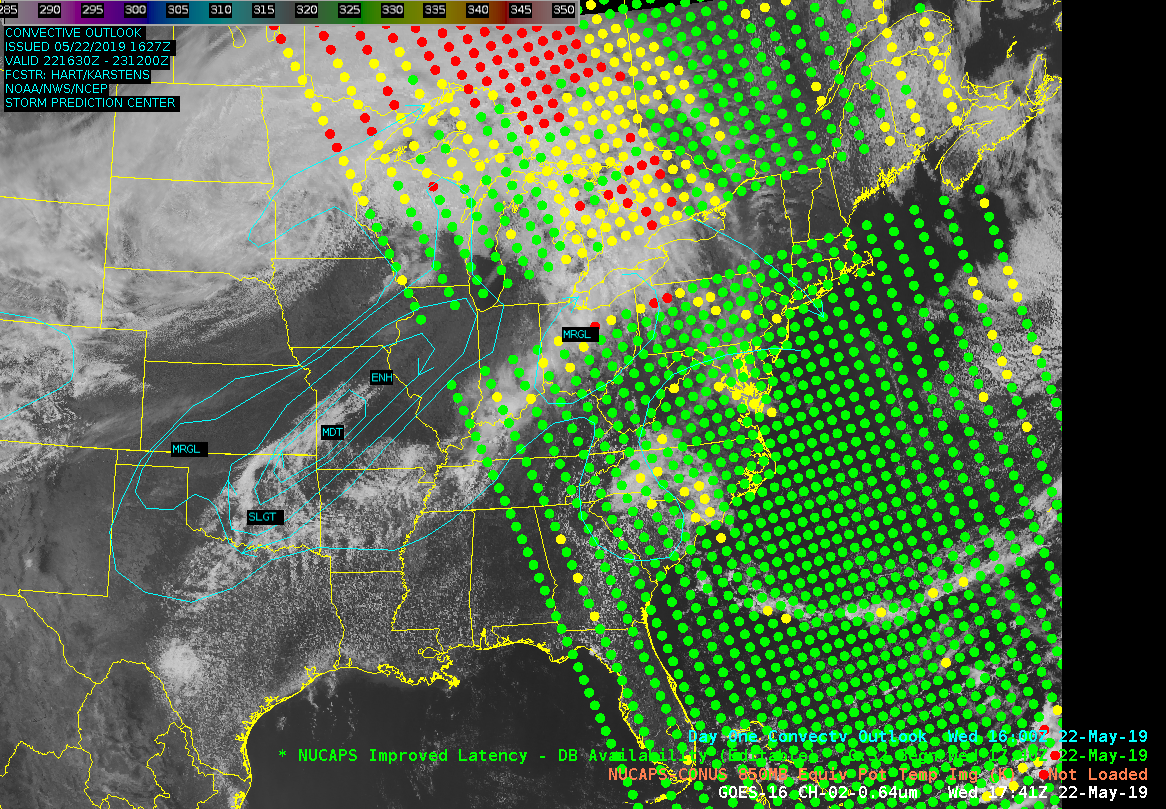
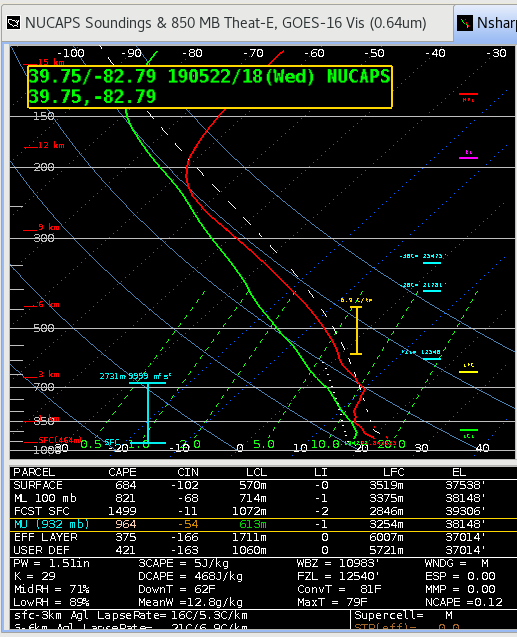
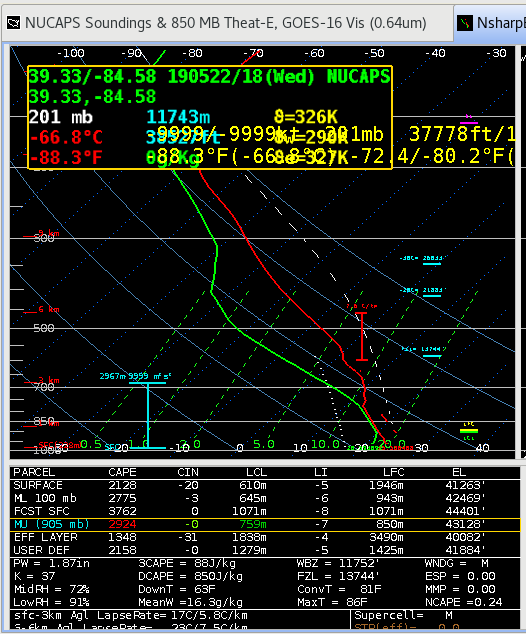
Just taking a quick look at the first NUCAPS swath over the CONUS. I did want to point out the dropout in the swath, that unfortunately occurred along part of the SPC risk axis that stretched SW-NE from Illinois into the lower Great Lakes. Although, the swath did obtain some soundings in the Marginal Risk area that encompasses much of Ohio. Clicking on the soundings in and around the Marginal Risk area indicated a regional location of higher instability. Although soundings in the SW part of this risk area showed markedly higher instability values.
Image 1. NUCAPS Soundings, GOES-16 Vis, SPC Day One Outlook, ~18 UTC 22 May 2019Image 2. NUCAPS Sounding from the Marginal Risk Area in Central Ohio, 18 UTC 22 May 2019Image 3. NUCAPS Sounding from the Marginal Risk Area in SW Ohio, ~18 UTC 22 May 2019
Notice the are significant differences across this area with overall larger lapse rates and instability in the SW corner of the Marginal Risk Area. So, it will be interesting to see what unfolds in this area. As the NUCAPS data indicate, are some areas within the singular Marginal Risk Area more favored for stronger activity, and thus further partitioning is needed?
So, I just wanted to point out some quick features and soundings with the initial NUCAPS swath, although we’re focused to the west today, over the southern Plains again. We’ll be watching intently for the next NUCAPS swath.
So, at the map briefing this morning there was a LOT of discussion about yesterday’s event, and the fact that despite the tornadoes that did occur, this was a “bust” of sorts. That is, there wasn’t near the widespread development of supercells that was anticipated. There may be multiple reasons for this, but I thought I’d take an initial look at some data and soundings again from yesterday to see if anything stands out that I happened to miss.
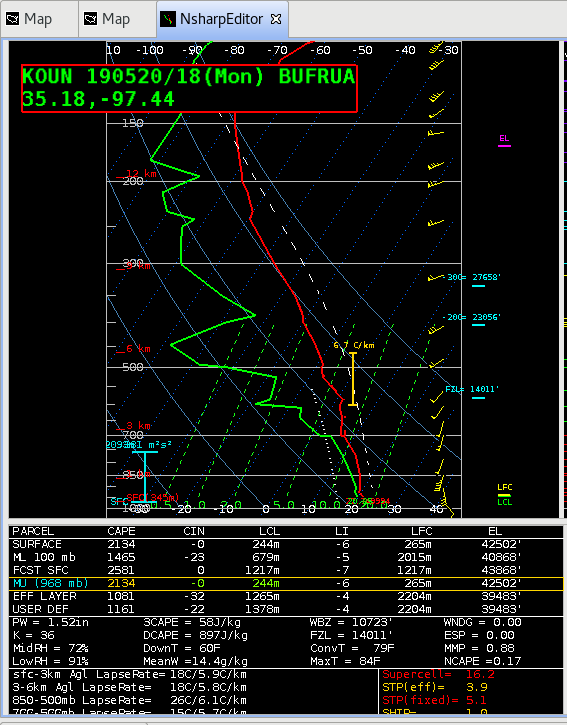
Here’s a sounding (radiosonde) taken from Norman (KOUN) yesterday at 18 UTC 20 May 2019.
KOUN Sounding (radiosonde) from 18 UTC 20 May 2019
Notice that lapse rates were not particularly steep through the sounding, with 850-500 lapse rates around 6 C/km. Also, notice the deep moist layer from the surface up through ~700 mb, which I’m told that this is rather unusual for this area.
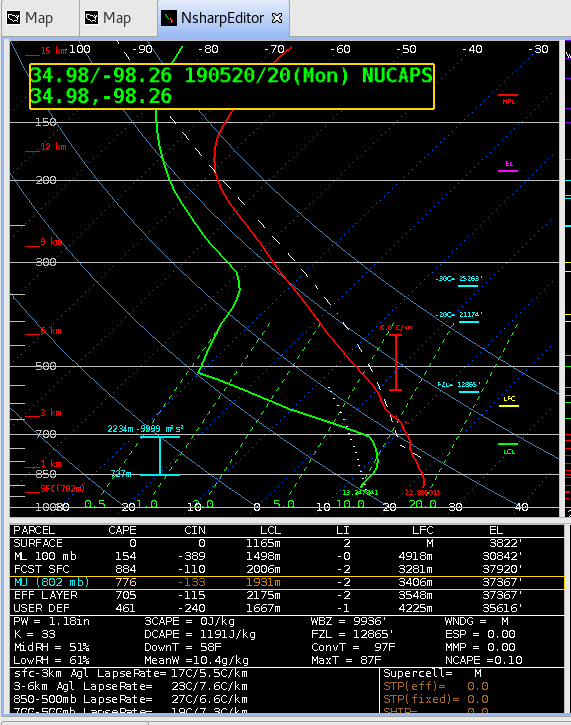
Ok, let’s take a look at a NUCAPS sounding in this proximity taken from the ~20 UTC swath.
NUCAPS Sounding from ~20 UTC 20 May 2019 (“green” sounding south of Norman, 34.98N 98.26W)
Immediately, I notice that the NUCAPS sounding doesn’t have the deep moist layer that the KOUN sounding showed just about 2 hours earlier. If anything, this layer did not disappear during the 2 hours, it remained, and perhaps even got a bit deeper. The 00 UTC KOUN sounding (not shown) indicated a moist depth up through about 680 mb or so. Ok fine…there’s the limitations with the accuracy of observations in the boundary layer in NUCAPS, but this is still important to capture since many severe weather parameters are derived from the surface or near-surface layers. However, it was noticed that lapse rates aloft were fairly similar, showing lapse rates that were not very steep, about 6.6 C/km in the 850-500 mb layer. The modified sounding (shown next) also didn’t capture the moist boundary layer.
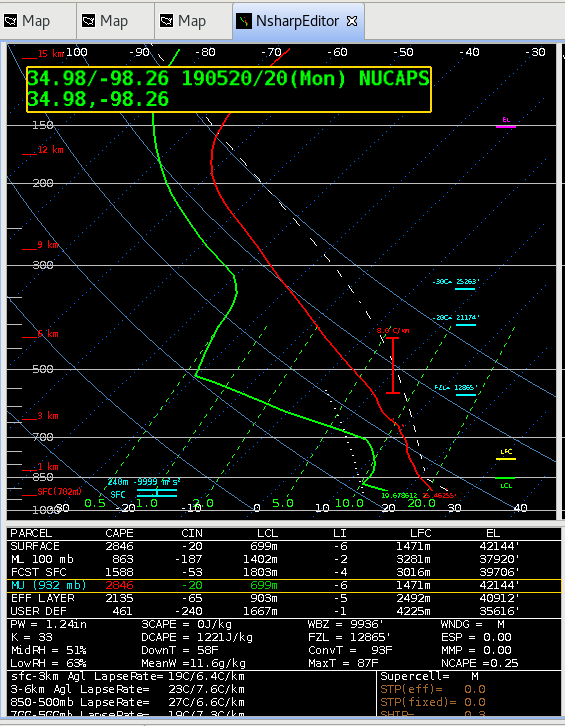
Modified NUCAPS Sounding from S of Norman, 34.98N, 98.26W
I did want to point out again the good characterization of the mid-layers. Granted, while the NUCAPS soundings didn’t capture every squiggle in the dew point temperature aloft, it did capture the overall character of the moisture profile.
Well, I ended up having to give up my workstation, but perhaps this case should be investigated some more. Although not shown here, the lapse rates and theta-e from my memory did appear to show a relatively large W-E gradient across the area from north Texas into S-Central Ok.
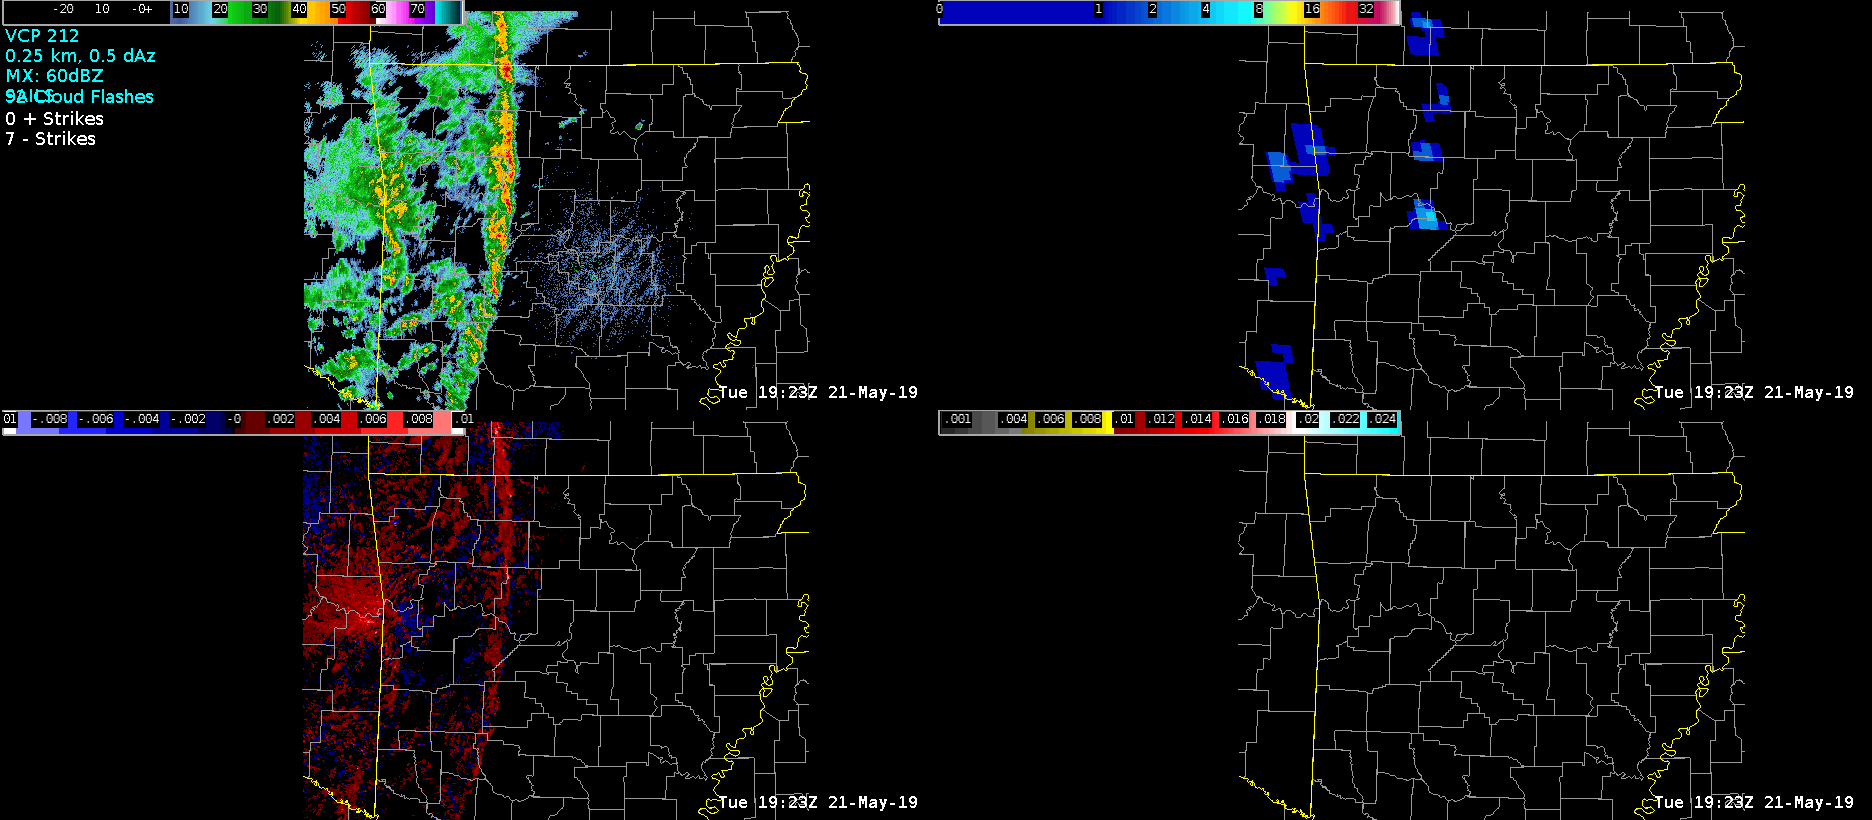
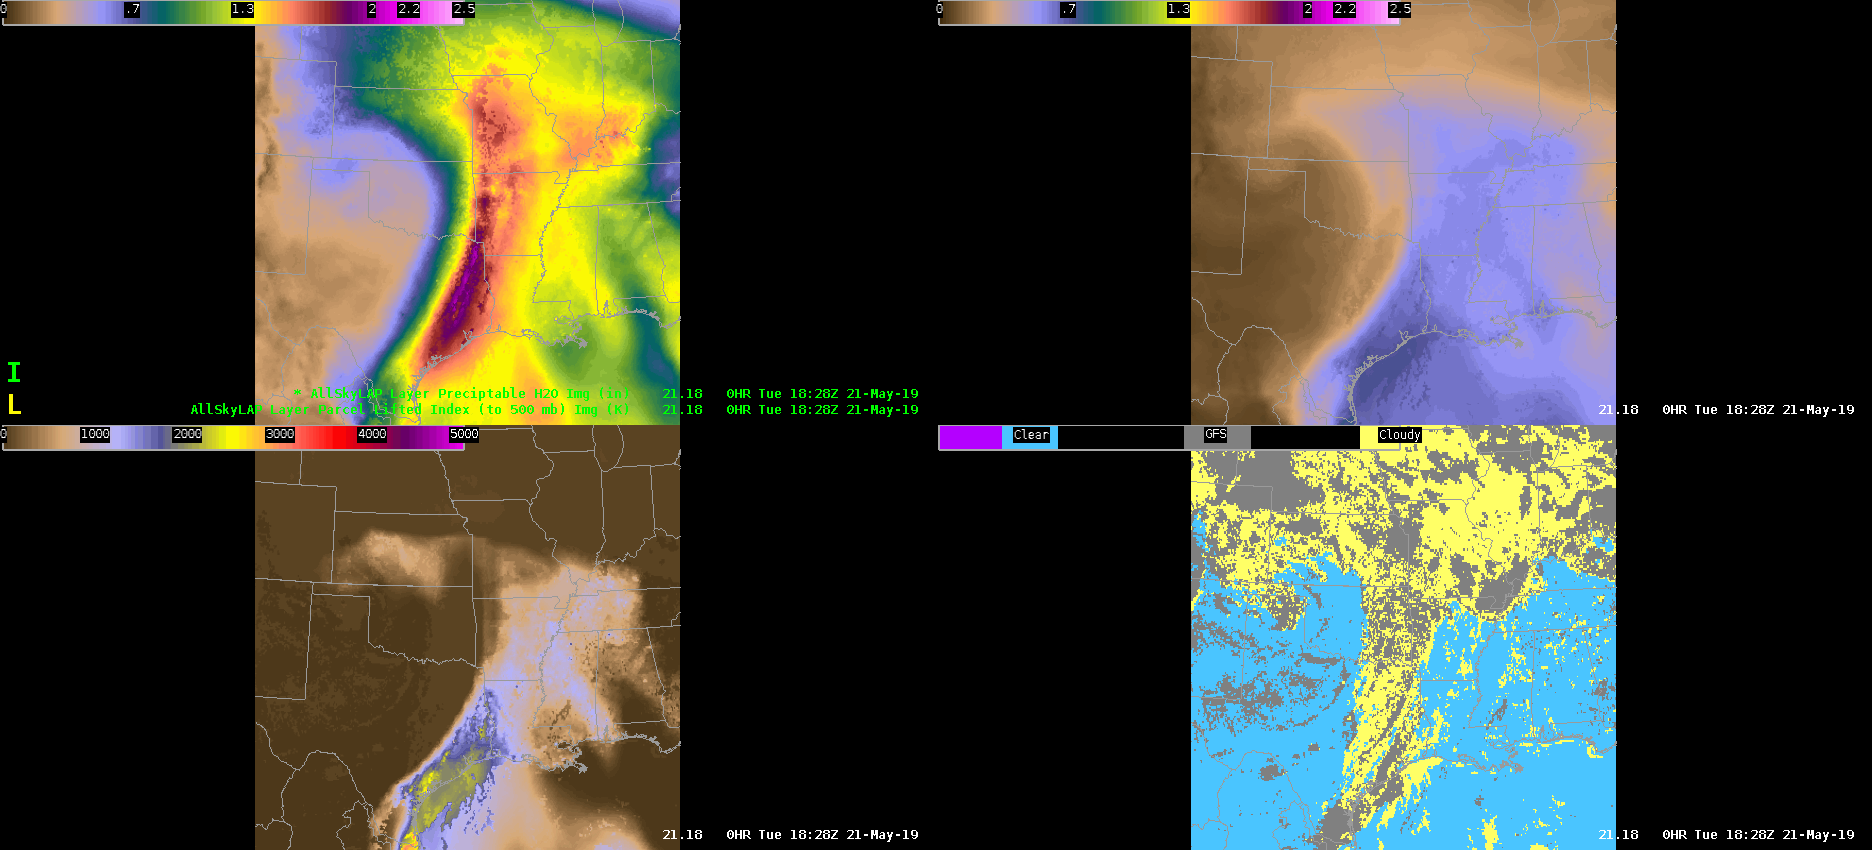
Radar image of a severe QLCS in NW Arkansas at 1923Z. This line has been producing wind damage and a few spin up tornadoes. Next I’m going to diagnose column moisture and instability downstream, across north-central Arkansas using satellite and satellite-model merged products.
The GOES-16 AllskyLAP showed a deep plume of moisture extending from the Gulf of Mexico northward into Arkansas and Missouri. Specifically, in north-central Arkansas, sampled PWATs were around 1.60 inches and MUCAPE was near 700-800 J/kg. Skies were mainly clear in this area, which resulted in a relatively smooth appearance in the PWAT and CAPE plots. Interestingly, and not plotted here, the 700-300mb AllskyLAP PWAT had lower values or drier conditions to the east of the approaching QLCS. This presence of mid-level dry air may be conducive for severe weather over north-central and northeast Arkansas over the next 1-3 hours — especially for damaging winds.
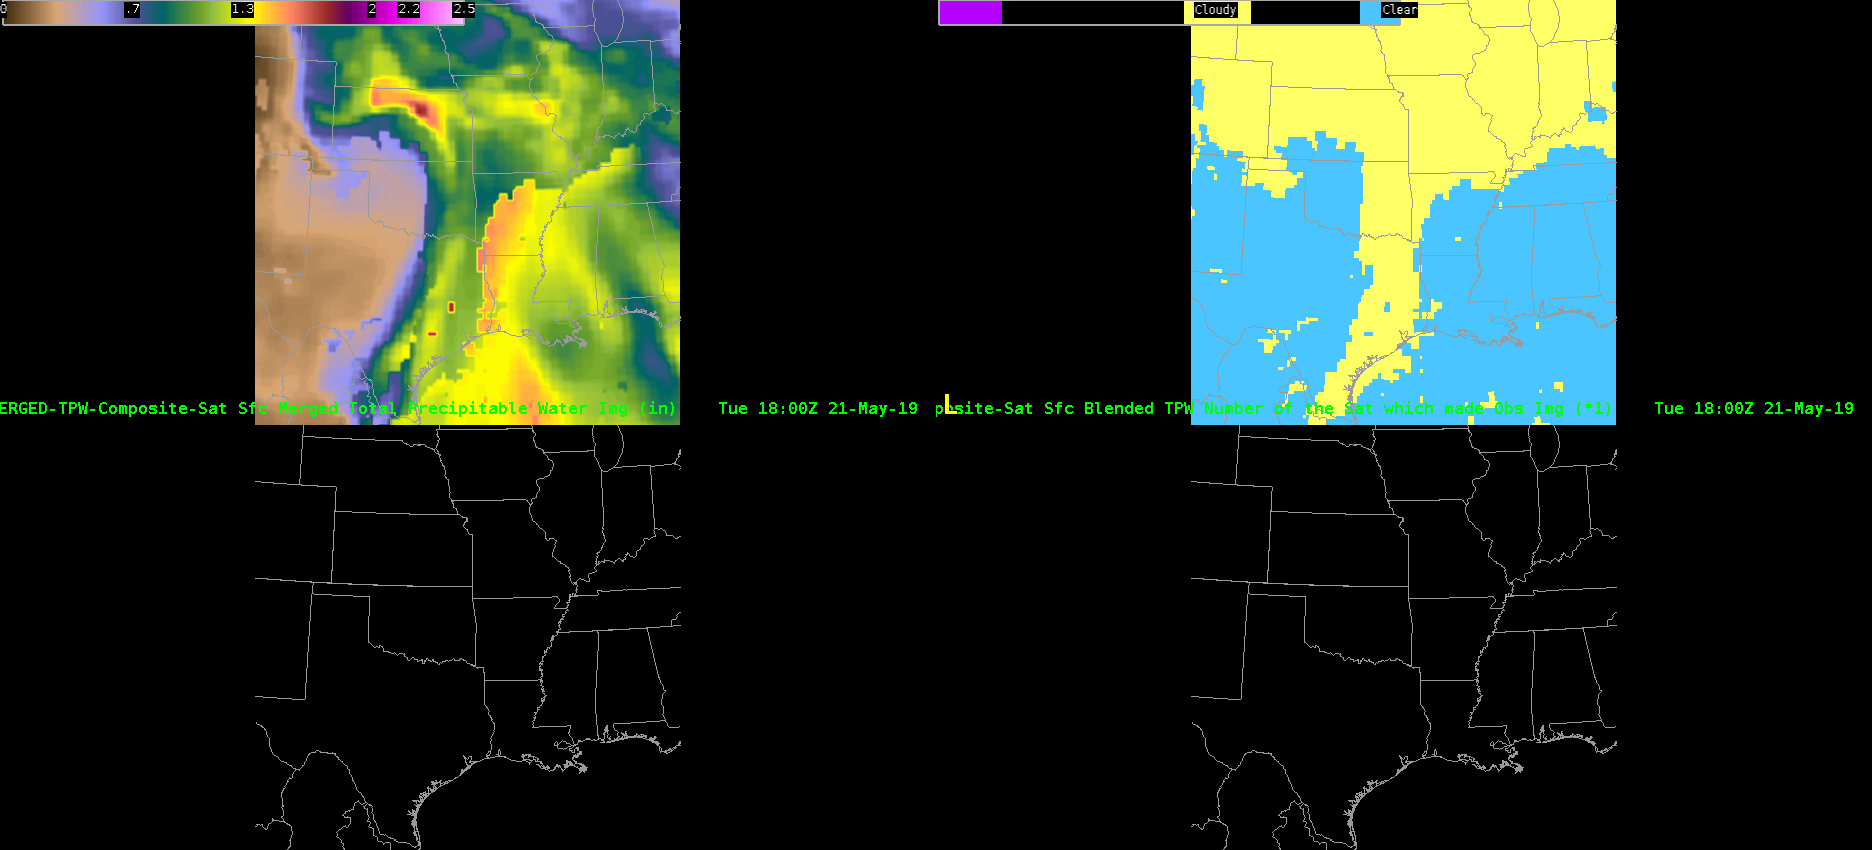
Merged TPW data at 19Z estimated PWATs near 1.50 inches into north-central Arkansas. However, there was a sharp discontinuity from 1.50 to 1.00 into the northwest part of the state where widespread cloud cover was present and the data originated from polar orbiting satellites (some of which could have been advected in). The SPC mesoanalysis did not display a sharp gradient in PWATs in this area, but rather had a gradual decrease to 1.30 inches.
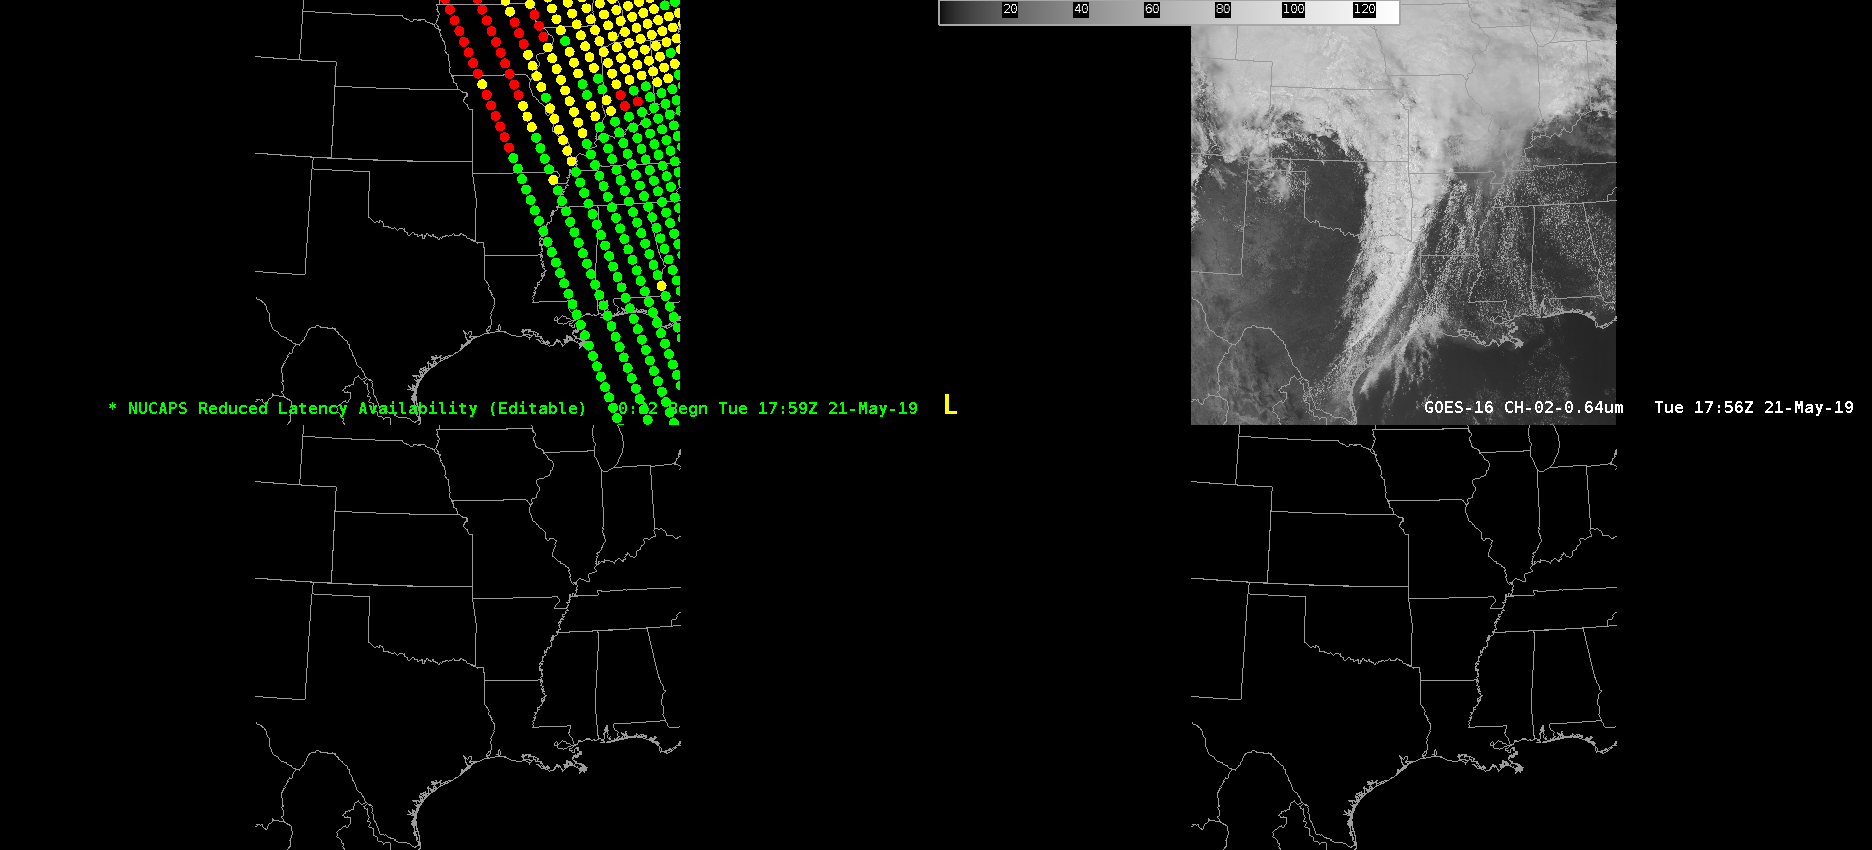
Not the best satellite pass with my area of concern on the far western fringe of the NUCAPS data. Surprisingly, the sounding data on the edge in northern Arkansas was nearly identical to the SPC mesoanalysis data with values near 1200 J/kg! It likely helped that skies were mainly clear at the time of the pass. The GOES-16 AllskyLAP data was underdone in comparison. As mentioned, only up to 700-800 J/kg.
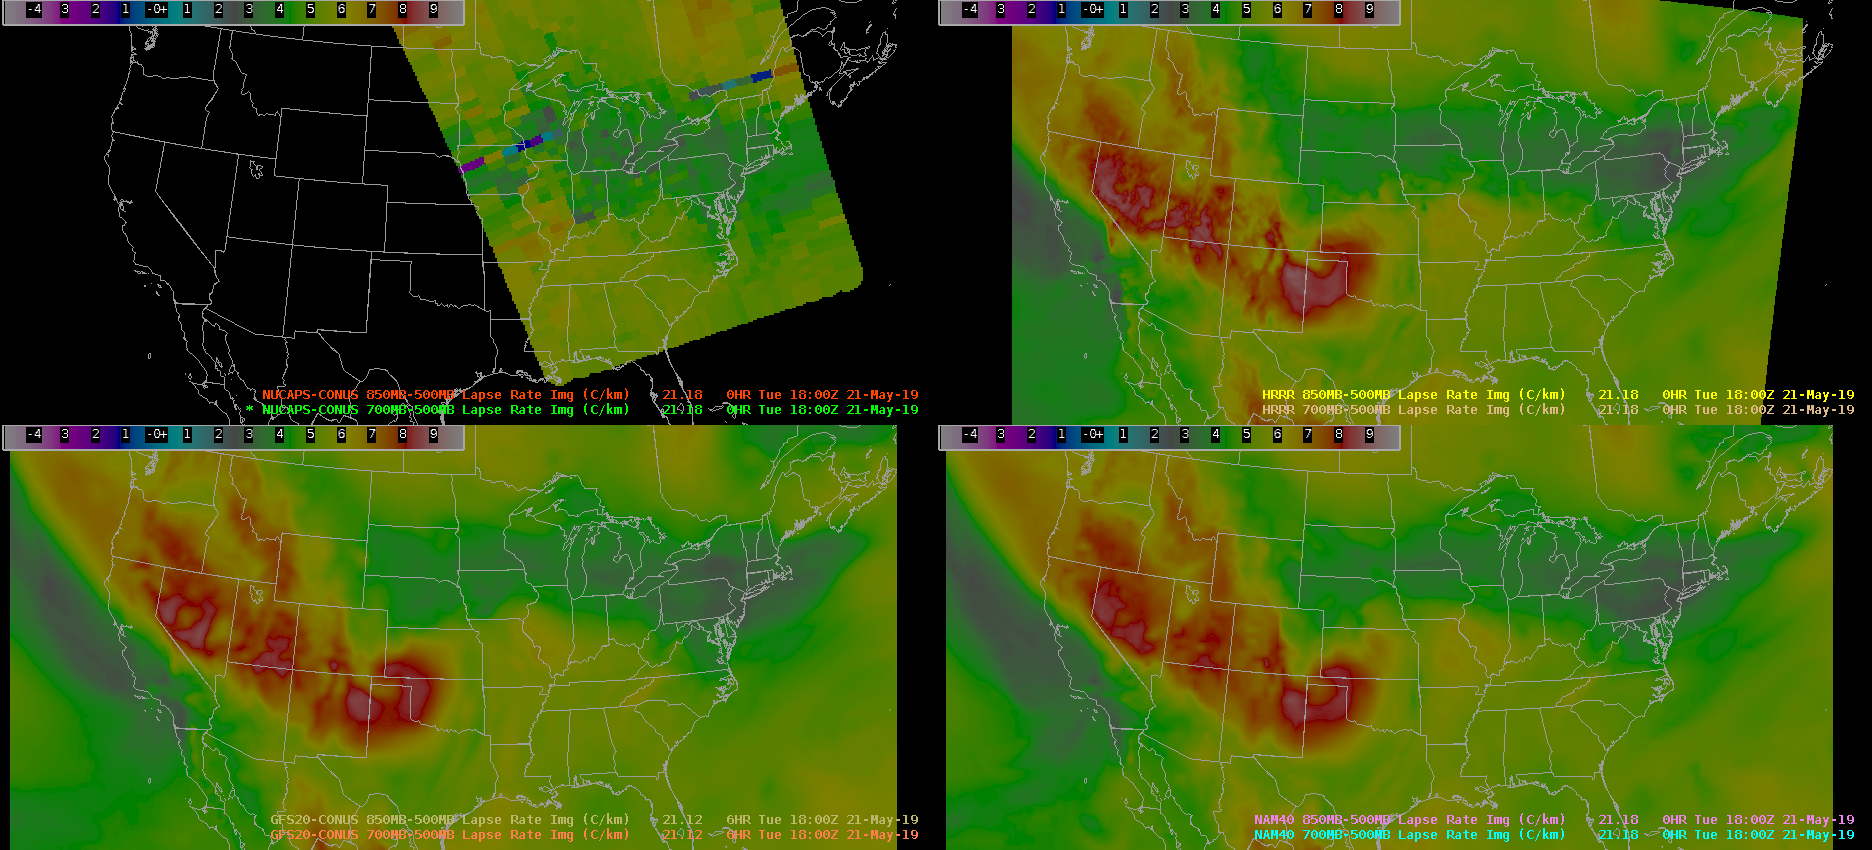
NUCAPS 700-500mb lapse rates in northern Arkansas are close to model forecasts. The NUCAPS in this pass was indicating lapse rates around 6.2 C/km. Model data was generally a little bit lower around 5.8 C/km. The SPC mesoanalysis was on the high end near 6.5 C/km. Roy
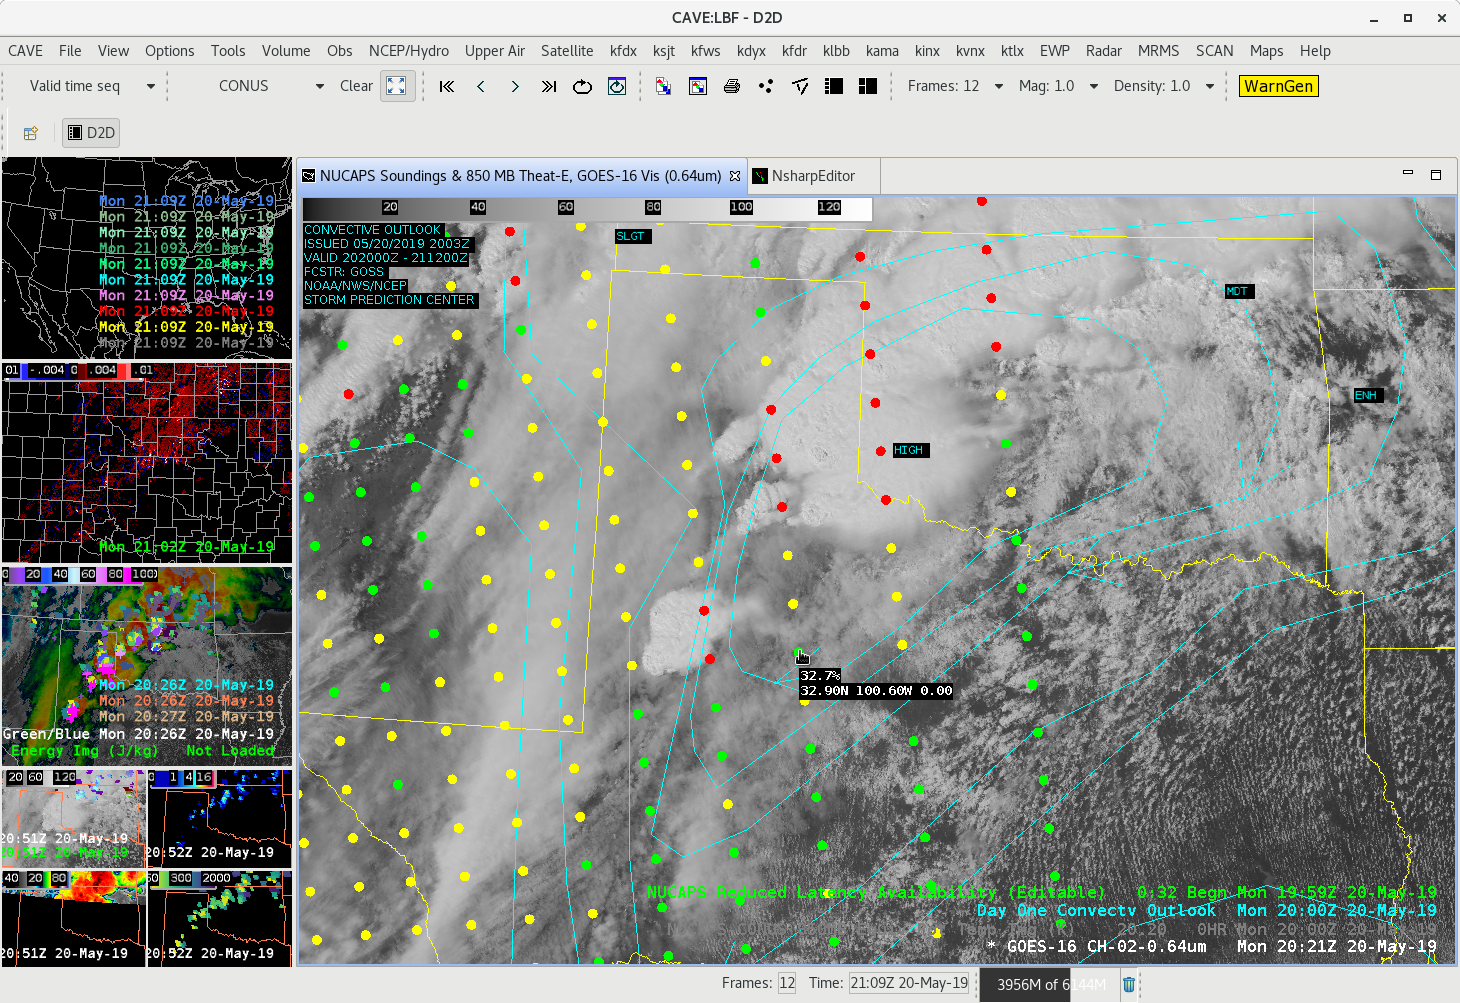
Ok, just a couple of quick observations and comparison of a NUCAPS (direct broadcast) sounding with a modified sounding over an area of interest this afternoon. The NUCAPS sounding locations and the particular sounding of interest can be seen in Image 1 below.
Image 1: NUCAPS Sounding locations near 20 UTC 20 May 2019. The Direct Broadcast and Modified Soundings that appear in this analysis were taken from the location of the pointer (notice this is in the far SW portion of the High Risk in north Texas).
The next image below (image 2) shows the Direct Broadcast NUCAPS sounding valid ~2000 UTC 20 May 2019. The sounding indicates high CAPE values at this sounding location (~2800 J/Kg MUCAPE, and 2400 J/Kg MLCAPE), and steep lapse rates aloft, in excess of 8 C/km. This type of atmospheric profile would support severe weather in the area today.
Image 2: DB Sounding taken in SW corner of High Risk (location shown at pointer above).
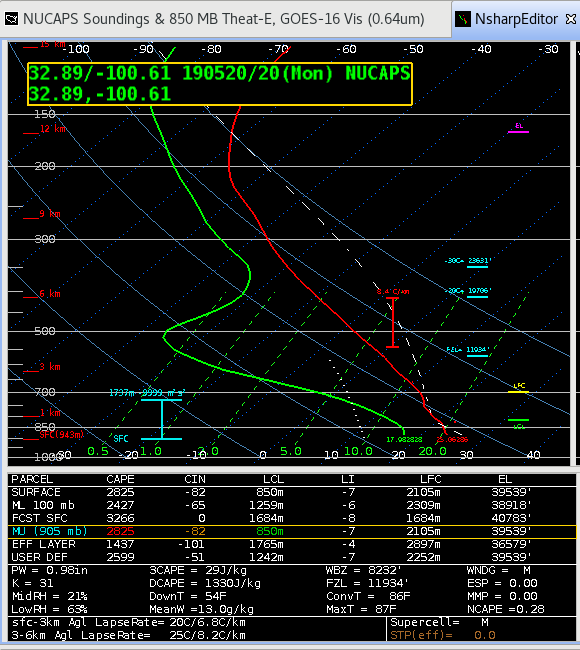
The next image is the modified sounding taken at the same location. Notice the increased CAPE values…
Image 3: Modified NUCAPS sounding from the same location as above. However, with the modified boundary layer, notice the higher overall CAPE values.
By the way, soundings in this general area, including the yellow soundings indicated high CAPEs with “reasonable” looking values. However, there was a fairly significant gradient noticed in overall low-level instability noticed in soundings to the east of this location. This could be a good case for the NUCAPS team to go back and take a further look.
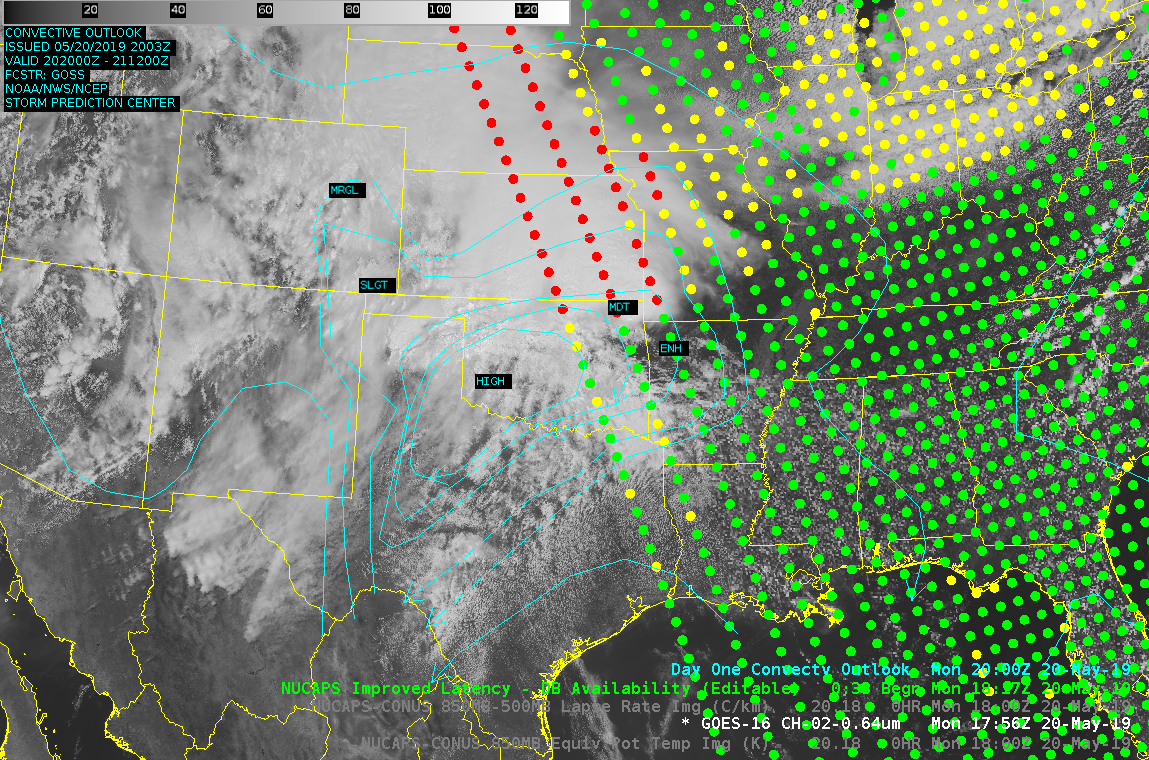
So, hello from my initial post from HWT, here during the week of May 20th. Yes, this is shaping up to be an active day and perhaps week. Taking a first look at the NUCAPS soundings for this afternoon…and…the latest ~18 UTC swath is just a bit too far east to be of a lot of use here in the primary action area for severe convection. Notice in the first image the SPC Outlooks (High Risk area nearly entirely to the west of the soundings). Nevertheless, I’ll take a look at the next swath to see the coverage over the main area of expected severe weather.
Image: Day One Convective Outlook (from SPC), NUCAPS Improved Latency soundings (~1817 UTC), and GOES-16 Vis (0.64 um).


 There was a noticeable difference in the mid level lapse rates, with a more significant value of 7.1 C/km. Also notice the DCAPE was in excess of 1000 J/kg, compared to values of 500-600 J/kg further east. This would indicate that there will be at least a threat of severe winds with convection that develops later in the day in the CTP CWA despite the early in the day convection that modified the air mass during.