Fort Worth NUCAPS

21:19Z: There was a NUCAPS passover around 1930Z over the Fort Worth area. One sounding in our southern CWA showed this:

The sounding showed MLCAPE of around 1500-1600 J/kg, with DCAPE values in excess of 1000 J/kg. Compared to the SPC meso page, these values agree quite well:

Snowfan

Day 2 thoughts

NUCAPS…

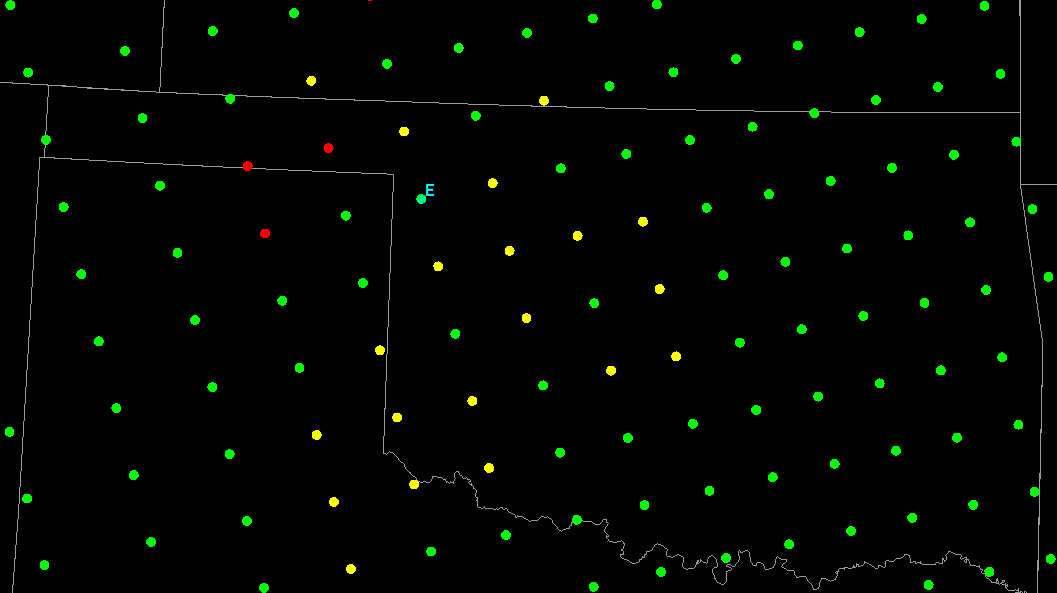
Can there be a circle (or some reference) around the NUCAPS point that I am currently using for a sounding?  That way I have a reference on the map for where the sounding is that I am looking at.

Can more than two NUCAPS sounding be loaded into an AWIPS pane?  If so, would nice be able to compare soundings/environments more easily.

Having the ability to display one NUCAPS sounding when I have two loaded in Sharppy would be helpful.  Even when loading two soundings and only have one in “focus” the two soundings overwrite each other.  Can this setup be similar to AWIPS that allows us to have multiple soundings loaded and be able to turn one or both of them on when we choose?

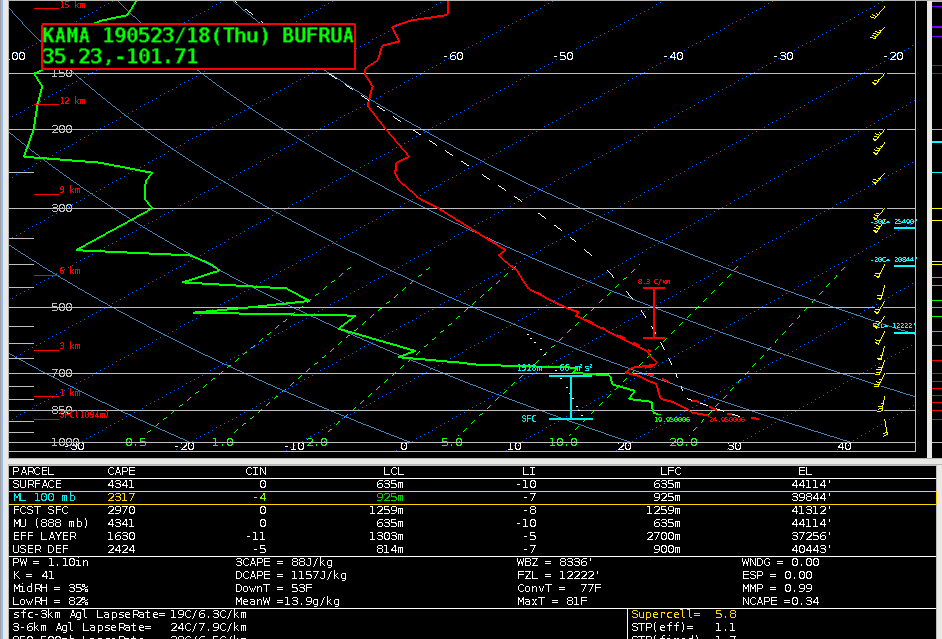
Compared a couple NUCAPS soundings surface conditions to the obs for a couple locations and they look reasonable.

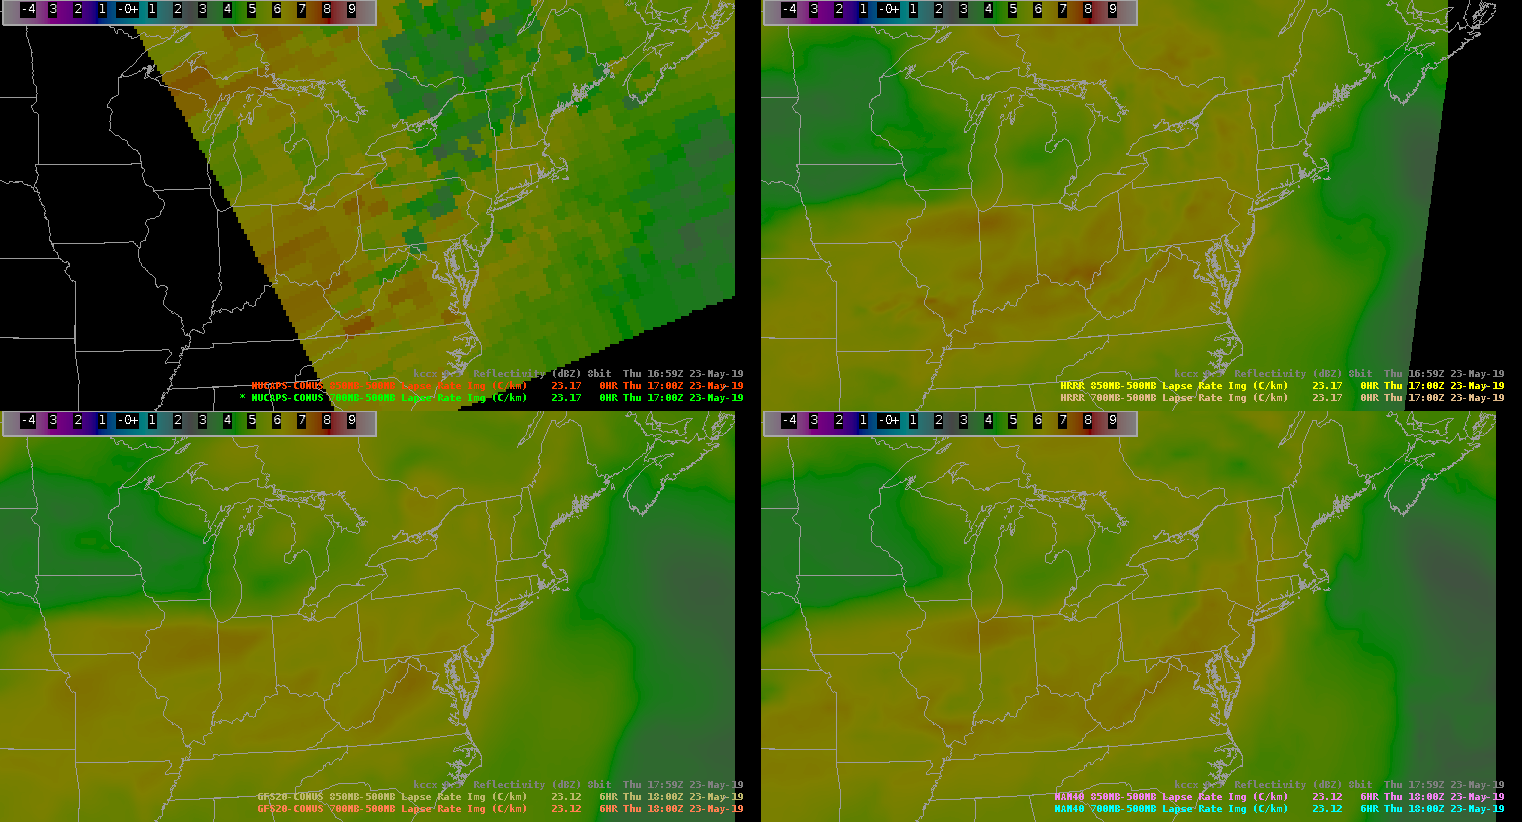
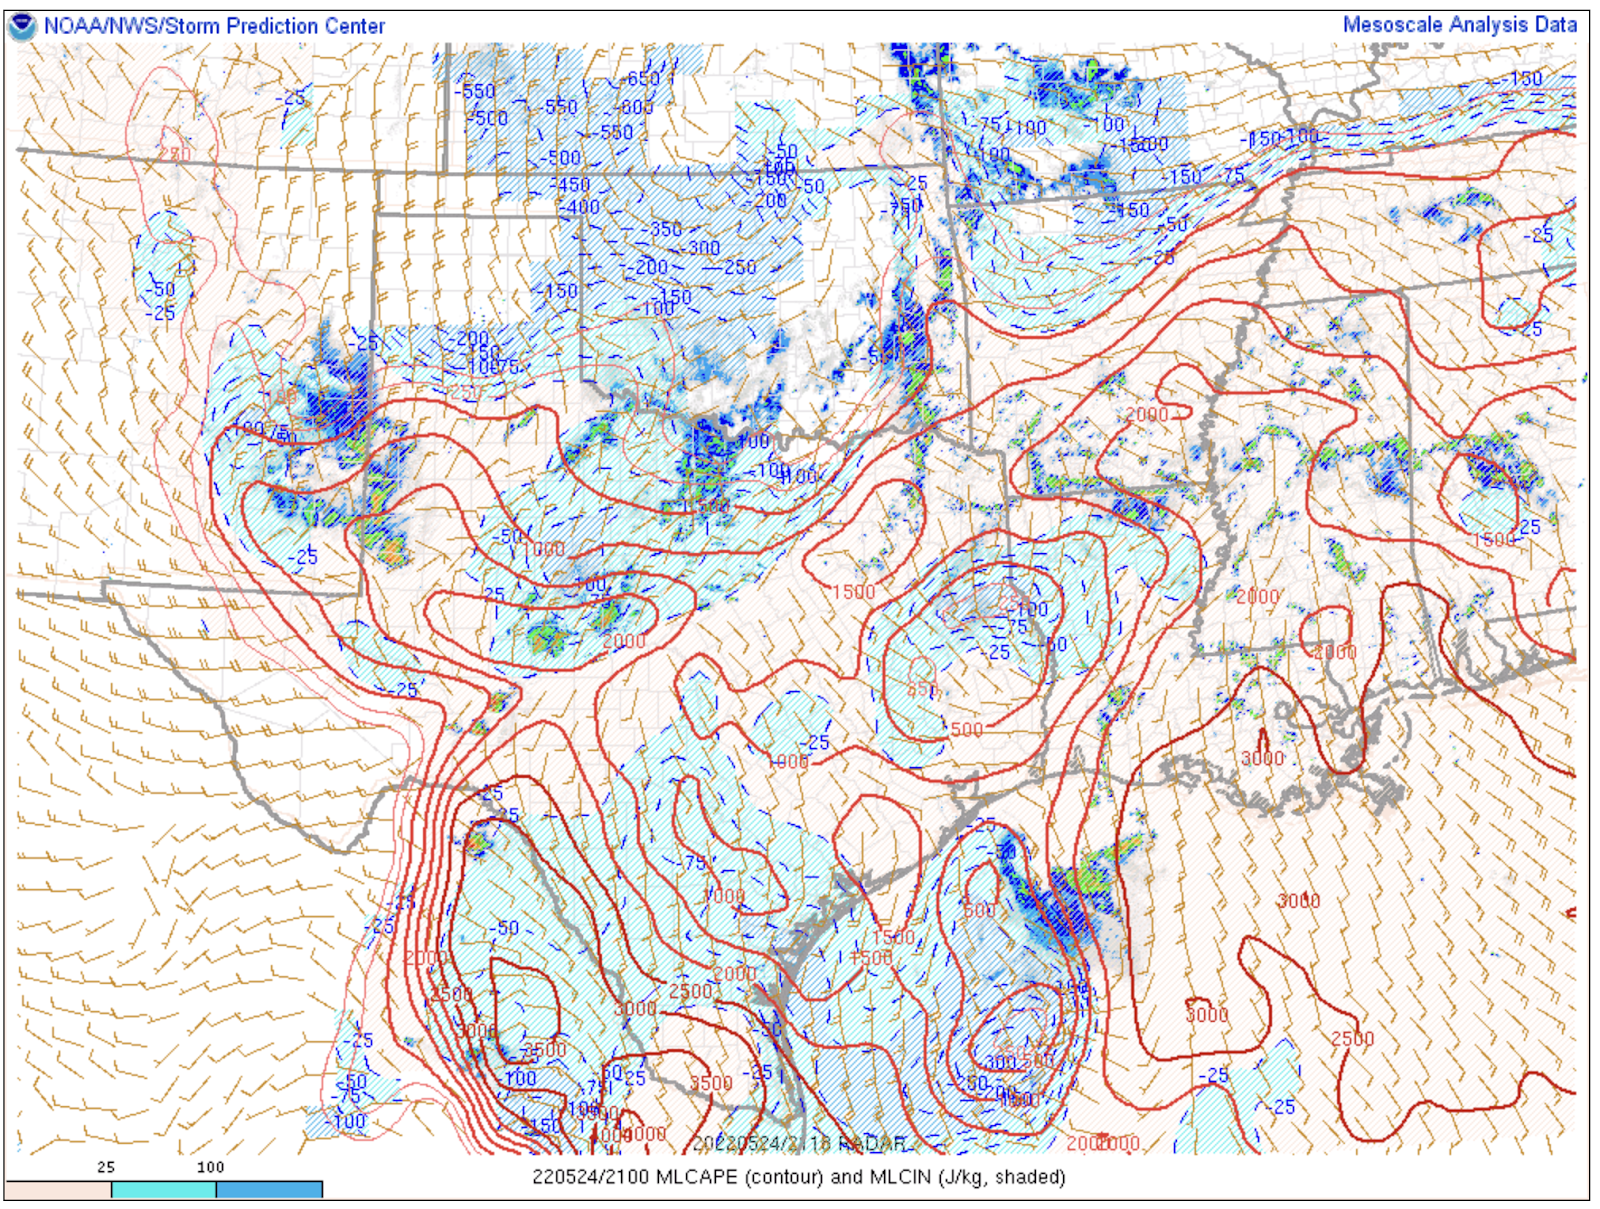
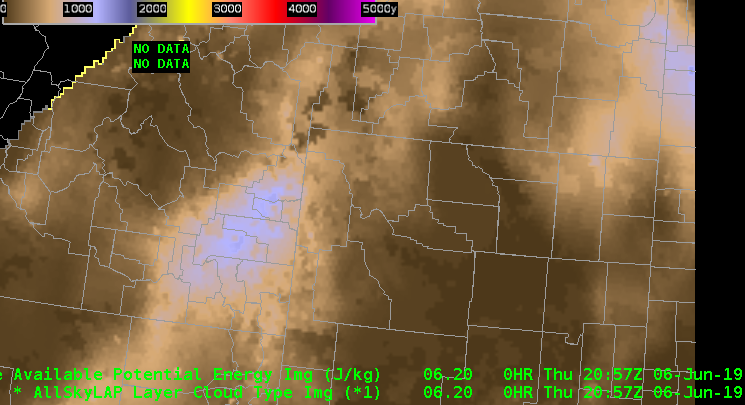
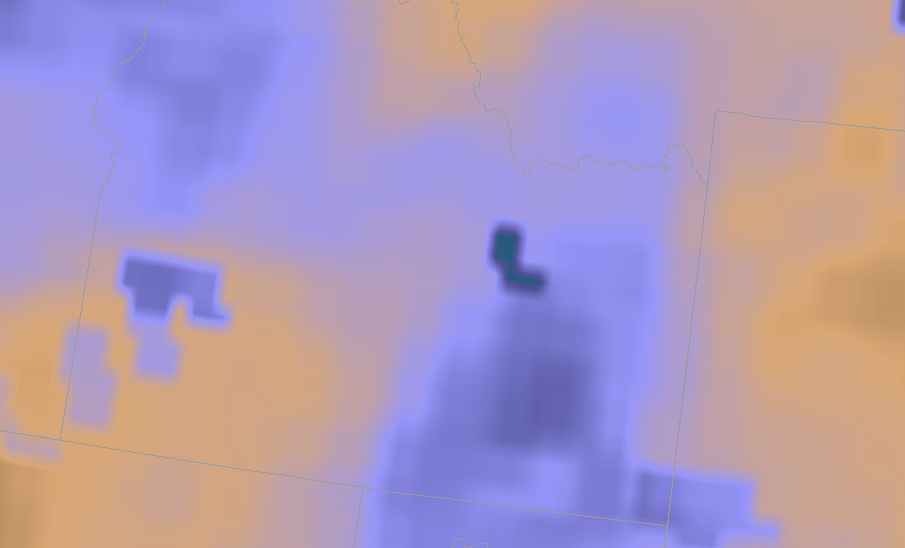
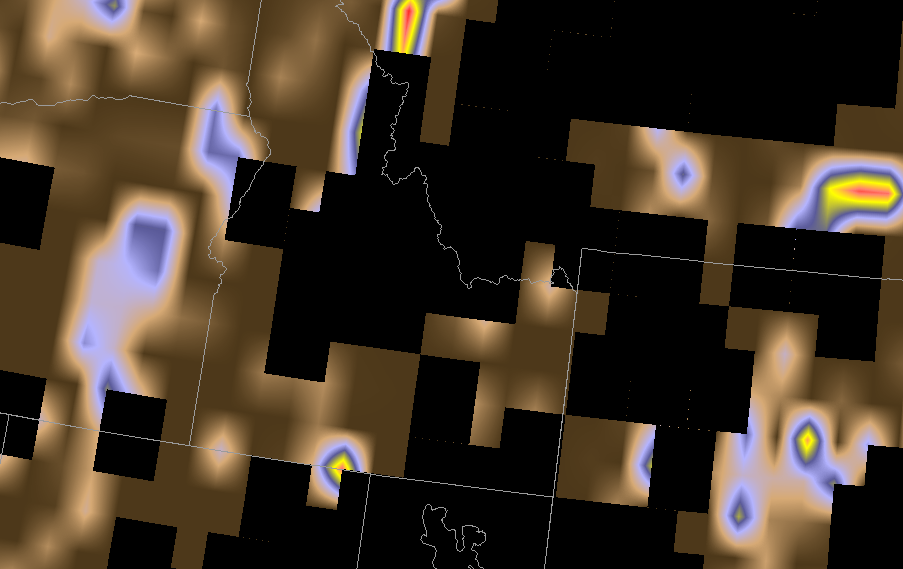
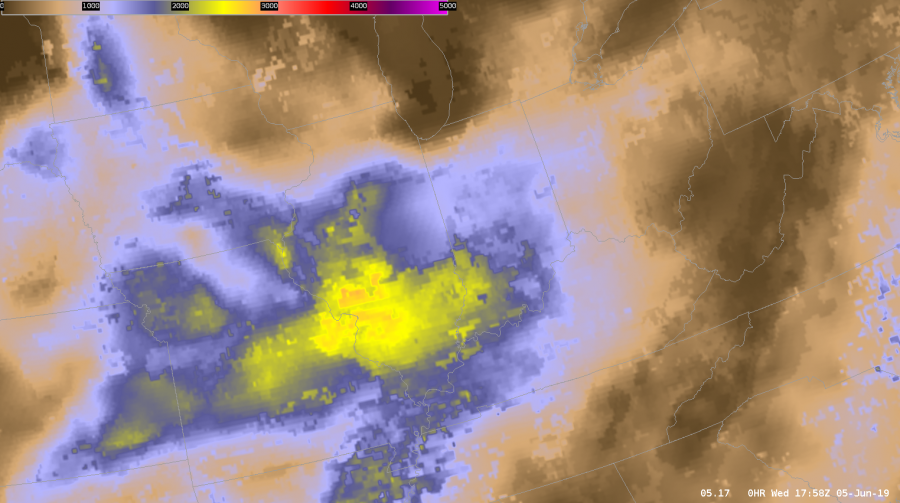
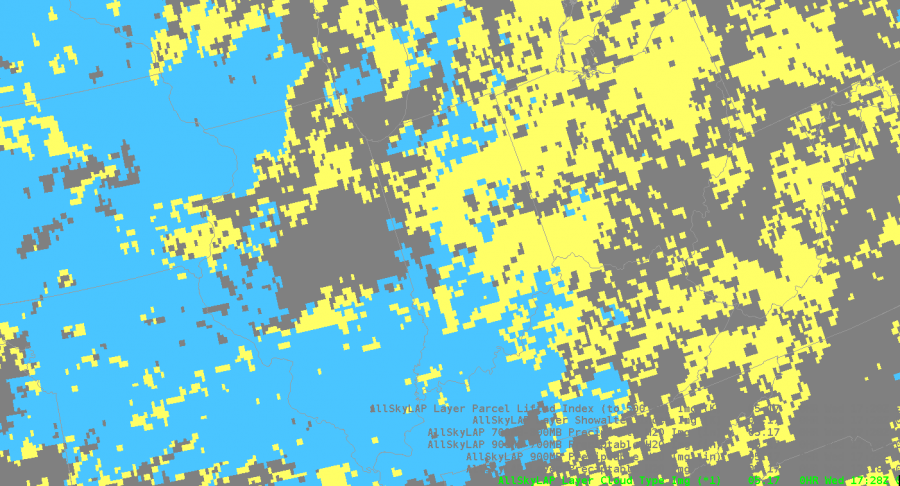
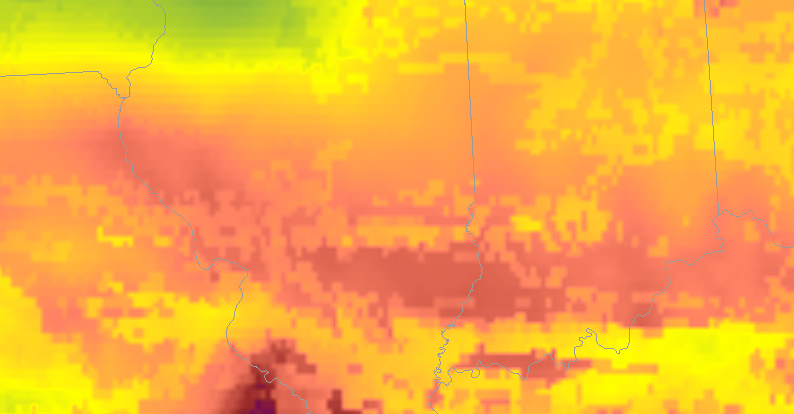
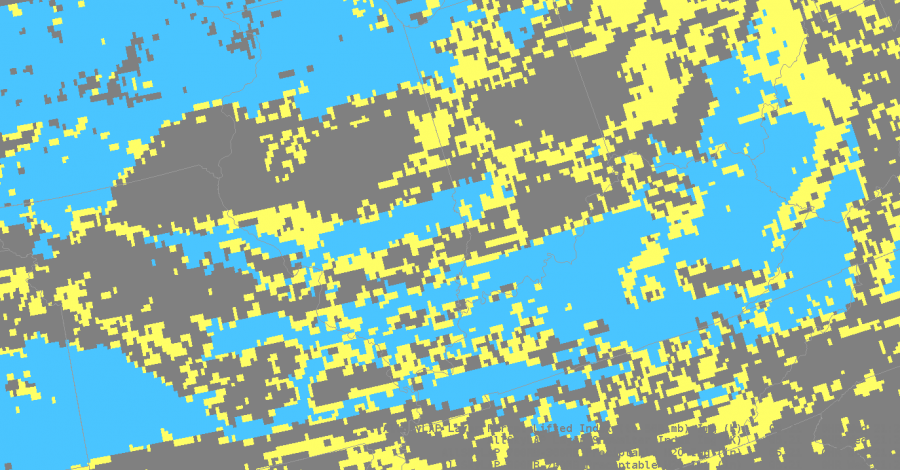
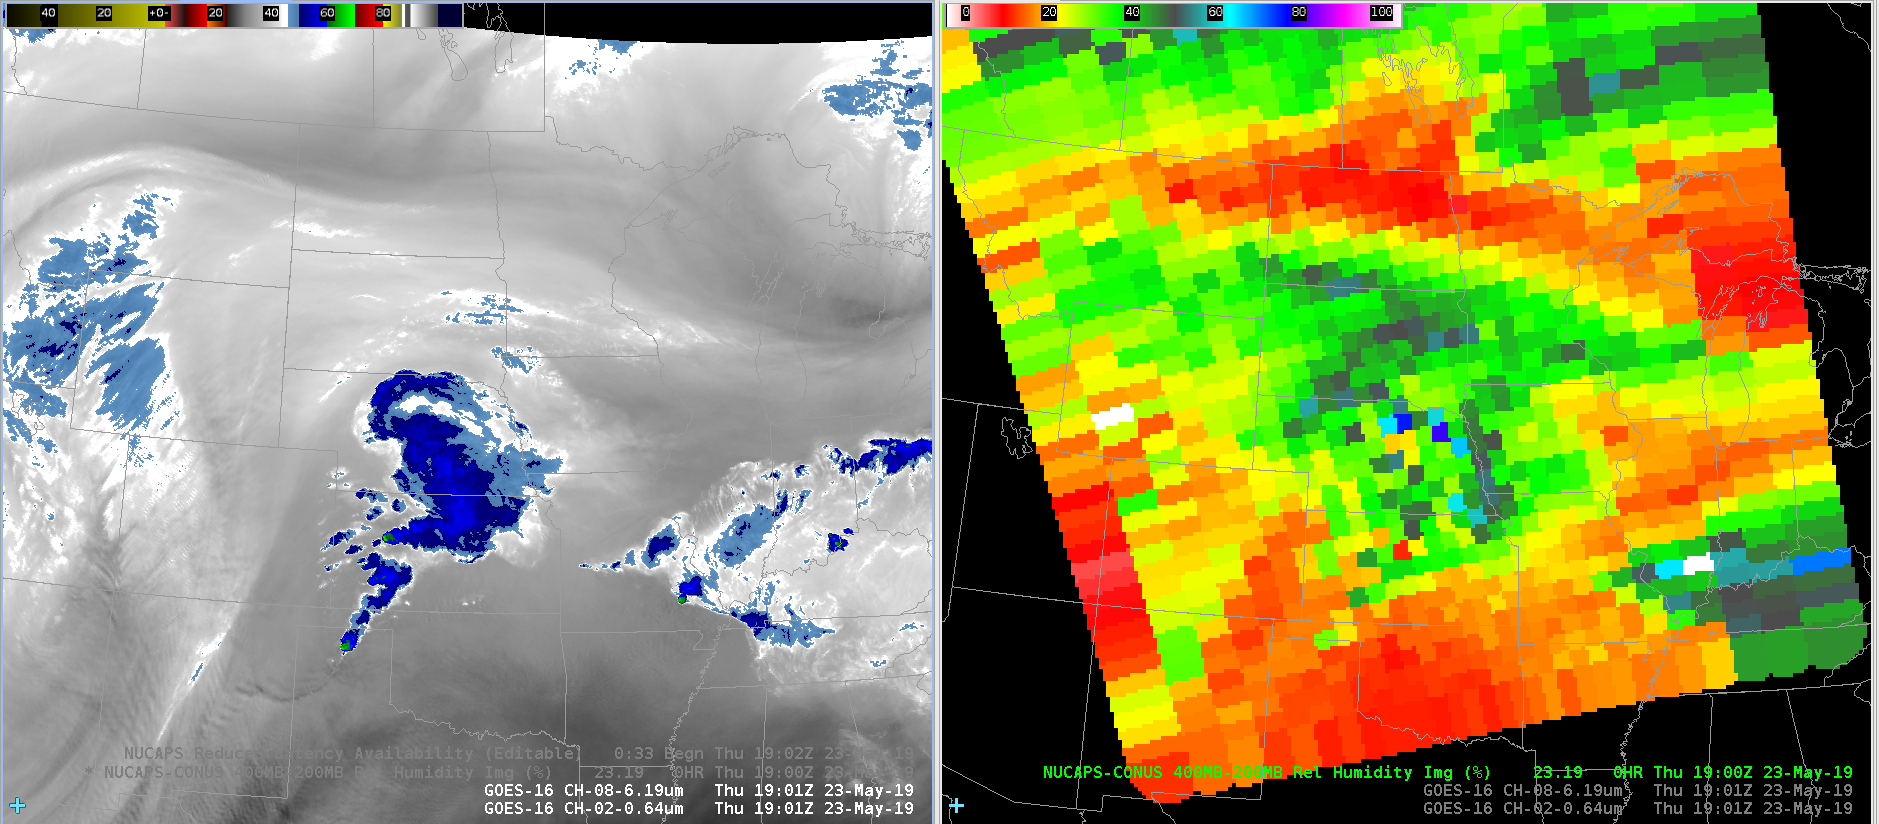
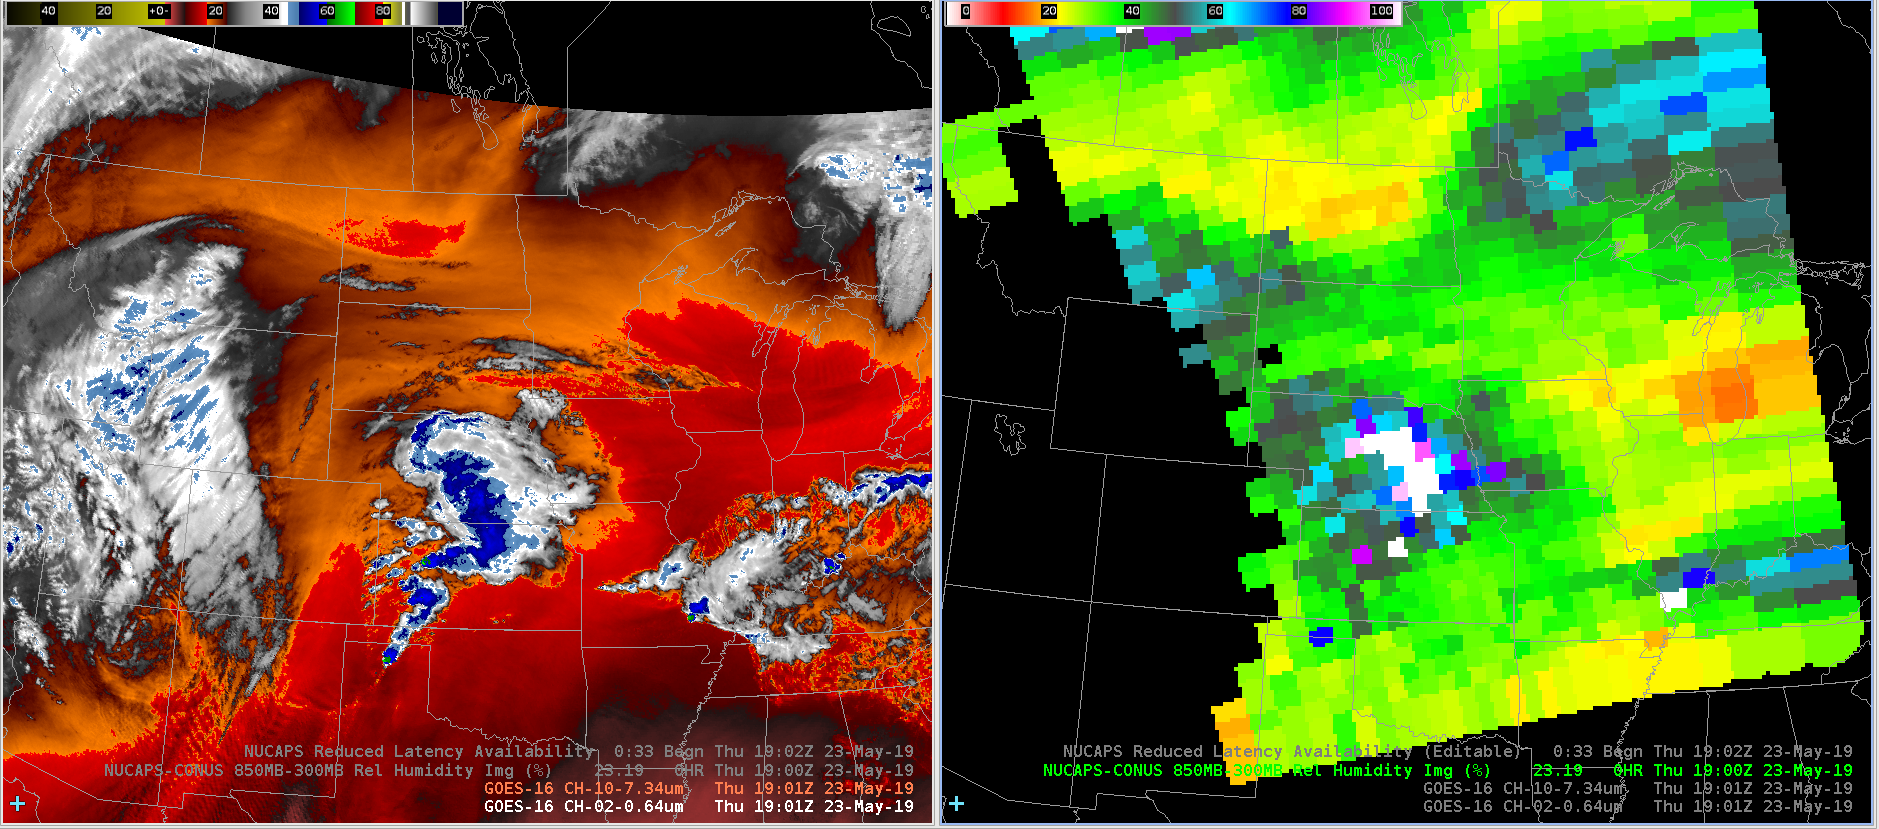
Looking at the forecast CAPE/CIN from NUCAPS, the gridded field for CIN is quite splotchy.  Bulls eyes of much higher CIN seem overdone compared to what is expected during the mid afternoon with full sun and with what the SPC mesoanalysis has.  This would make me question how accurate it is.   Looking at the forecast, there is no consistent trend with the CIN bulls eyes, which lowers my confidence in this field. The CAPE field is more uniform, though still splotchy.  The areas of higher CAPE are more consistent, giving me more confidence in this field than the CIN.  Is there a way to average out this field more to make it smoother?  If so, that would greatly increase my confidence in this parameter and my likelihood of using it in the future.

Noticed the surface based CAPE in AWIPS vs. Sharppy was quite a bit higher in Sharppy.

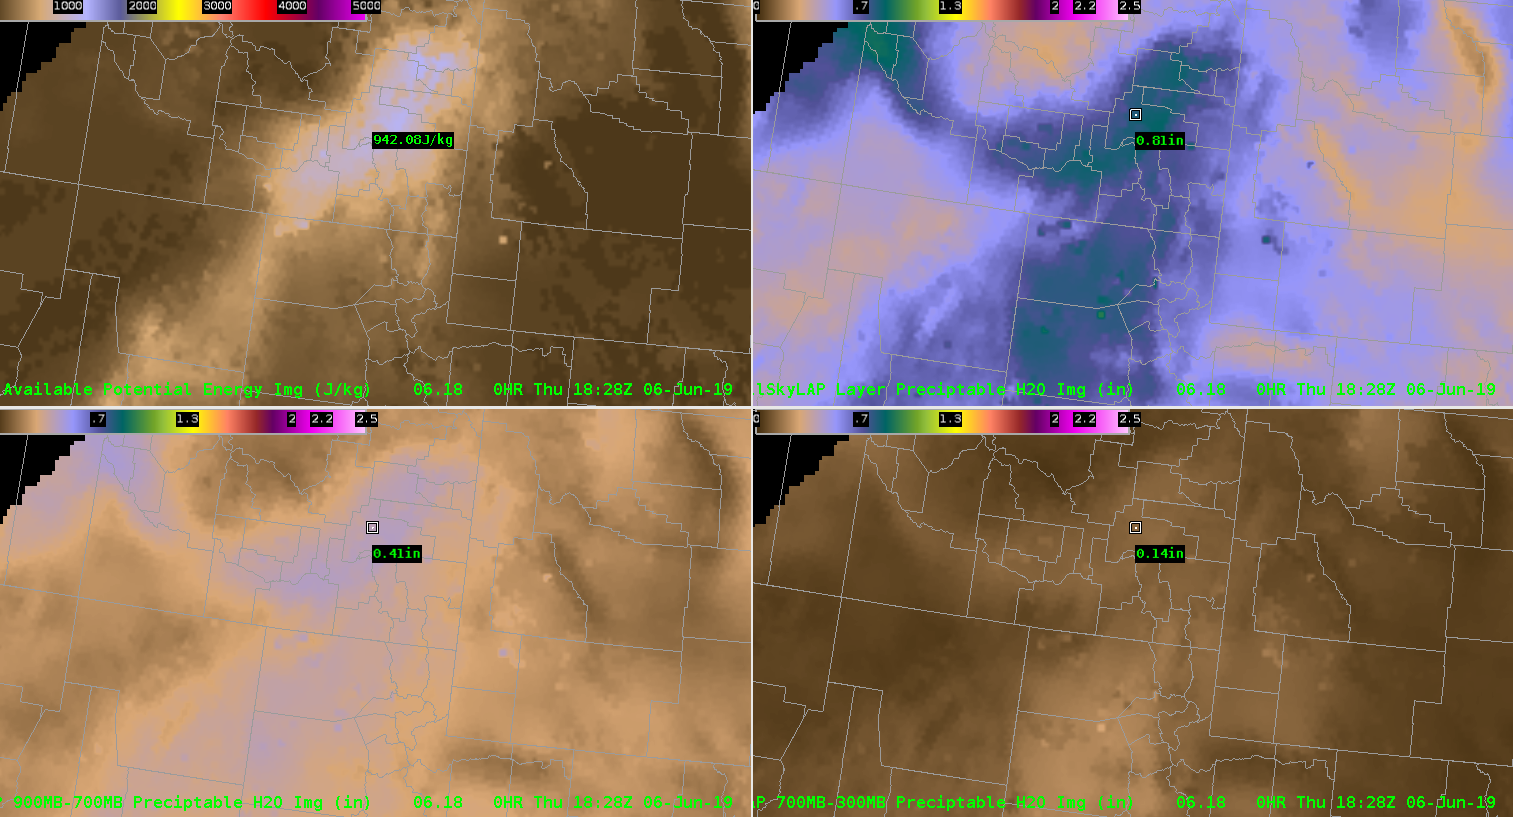
Compared the ML CAPE in a modified NUCAPS sounding in AWIPS and an unmodified NUCAPS sounding in Sharppy and the modified lined up much more closely with the SPC mesoanalysis page.  The the ML CAPE in the unmodified sounding in Sharppy was too low.  Surface based CAPE was actually more representative in the unmodified sounding.

As mentioned earlier, would be nice to compare more than two sounding points for NUCAPS to aid in comparing the environment more easily.

Having the NUCAPS 2m temperature and DP in F instead of C would be much more useable and easier to compare to surface observations.

Noticed the 2m temperature for the gridded NUCAPS was cooler by 5-8 C compared to the observations.  This makes me looks confidence with the CAPE and CIN plots if the surface temperatures are not accurate.  Is there a way to grid the modified NUCAPS data?  When I forecast I like to view parameters in a gridded fashion in the horizontal.  This helps me better understand what is going on with the environment.

Compared the NUCAPS 700-500mb lapse rates to those on SPC’s mesoanalysis page and found the NUCAPS was close, but on the cool side.

In our data sparse CWA, I can see these soundings as being quite useful, as long as forecasters understand the low levels (assuming below 850mb) are less likely to be representative.

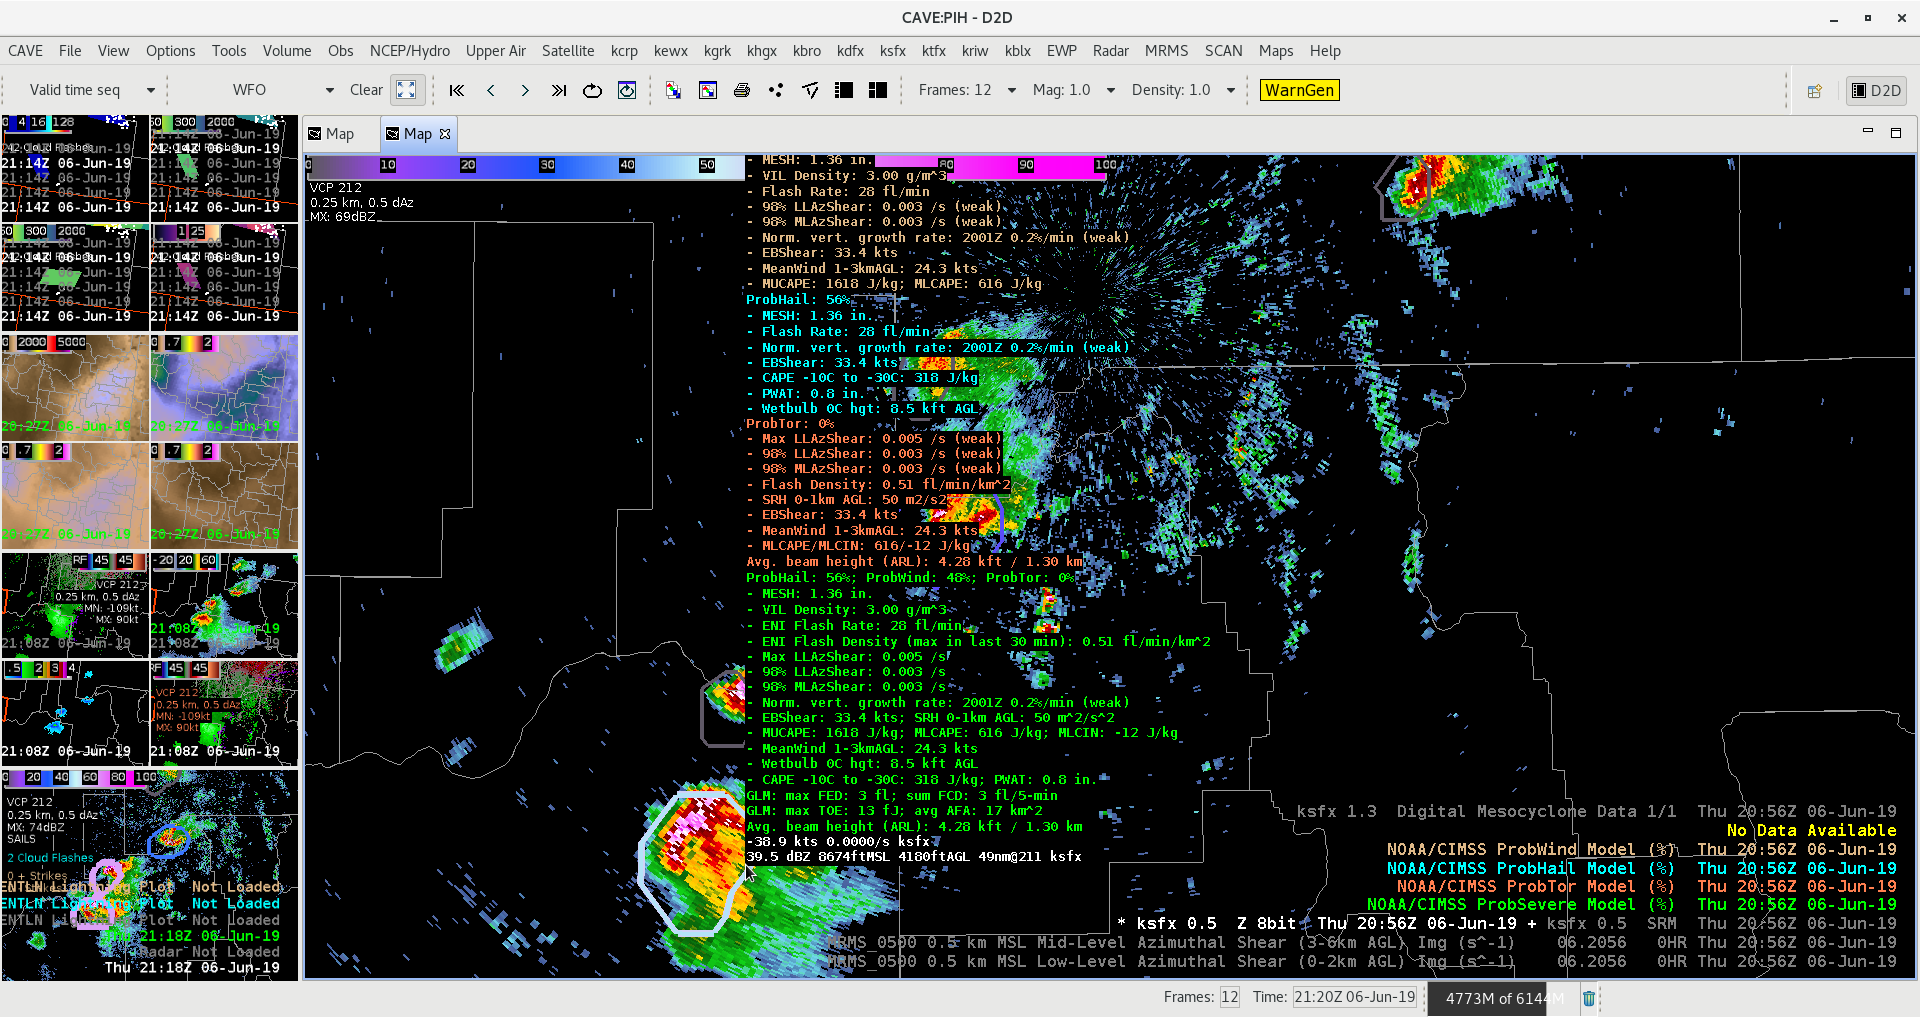
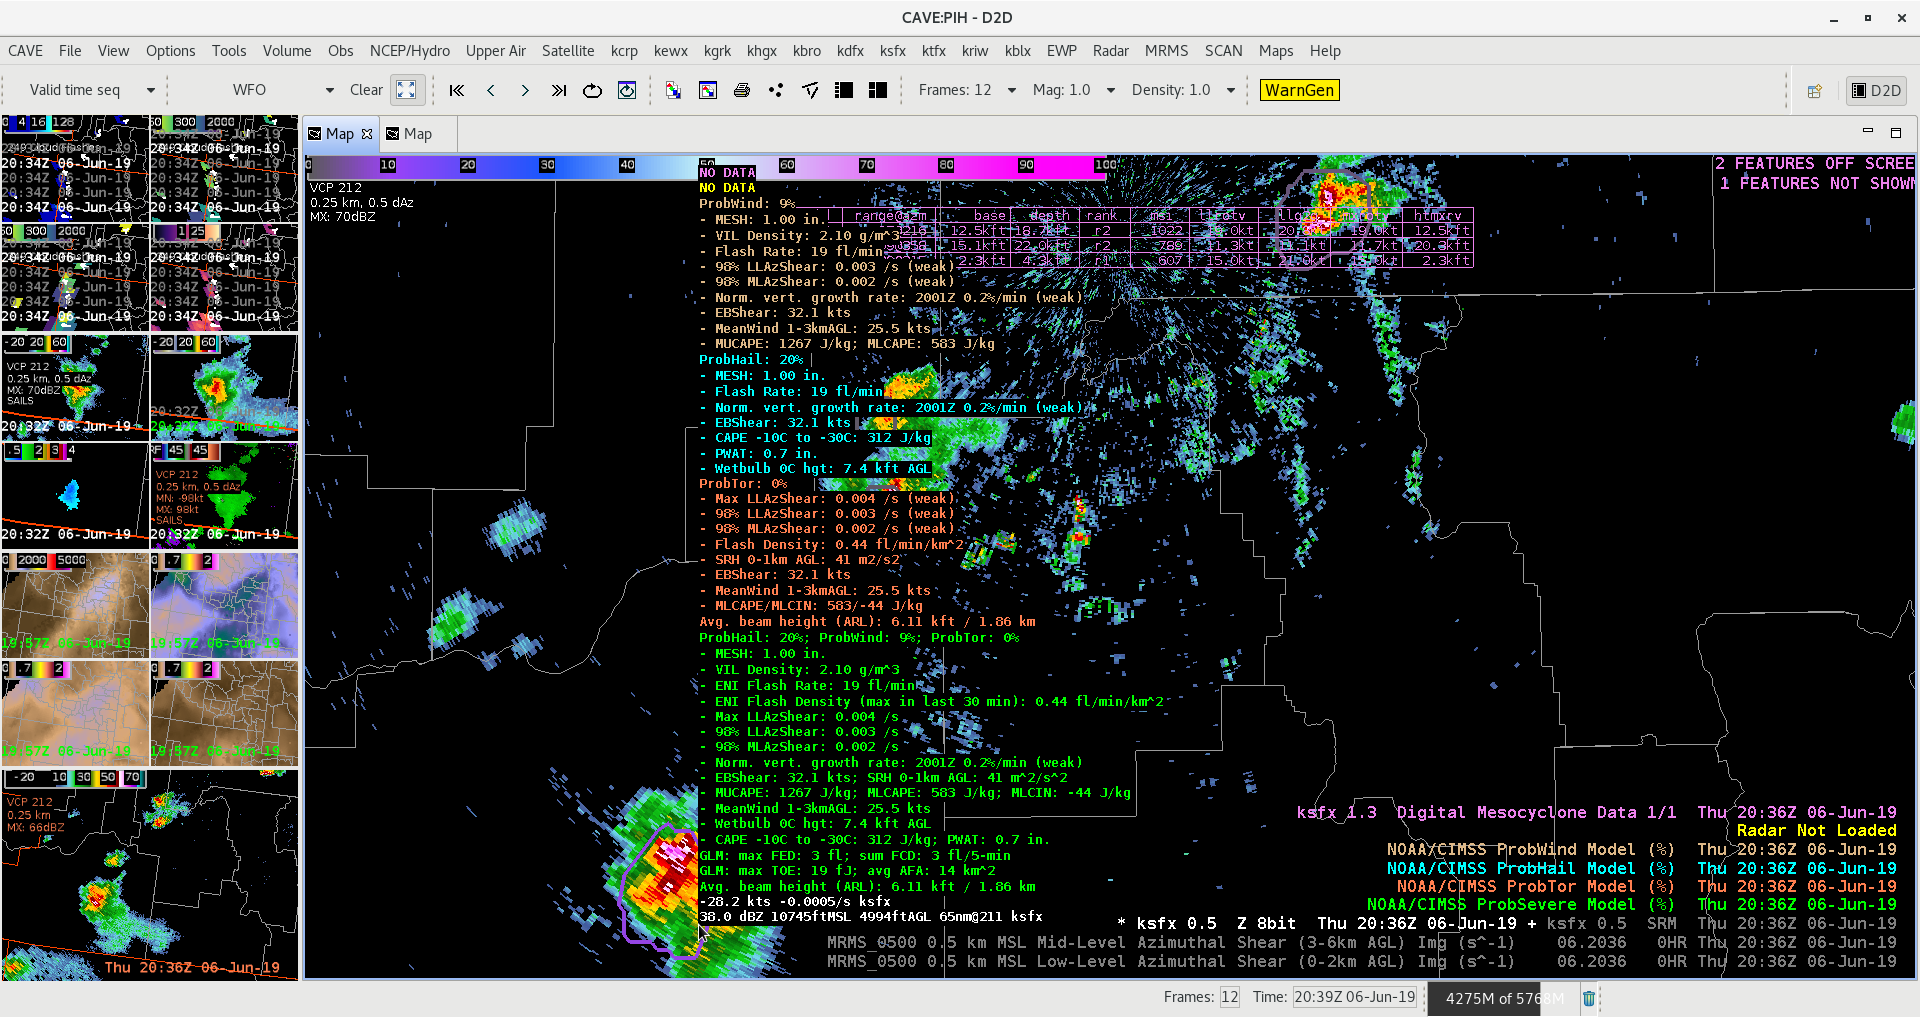
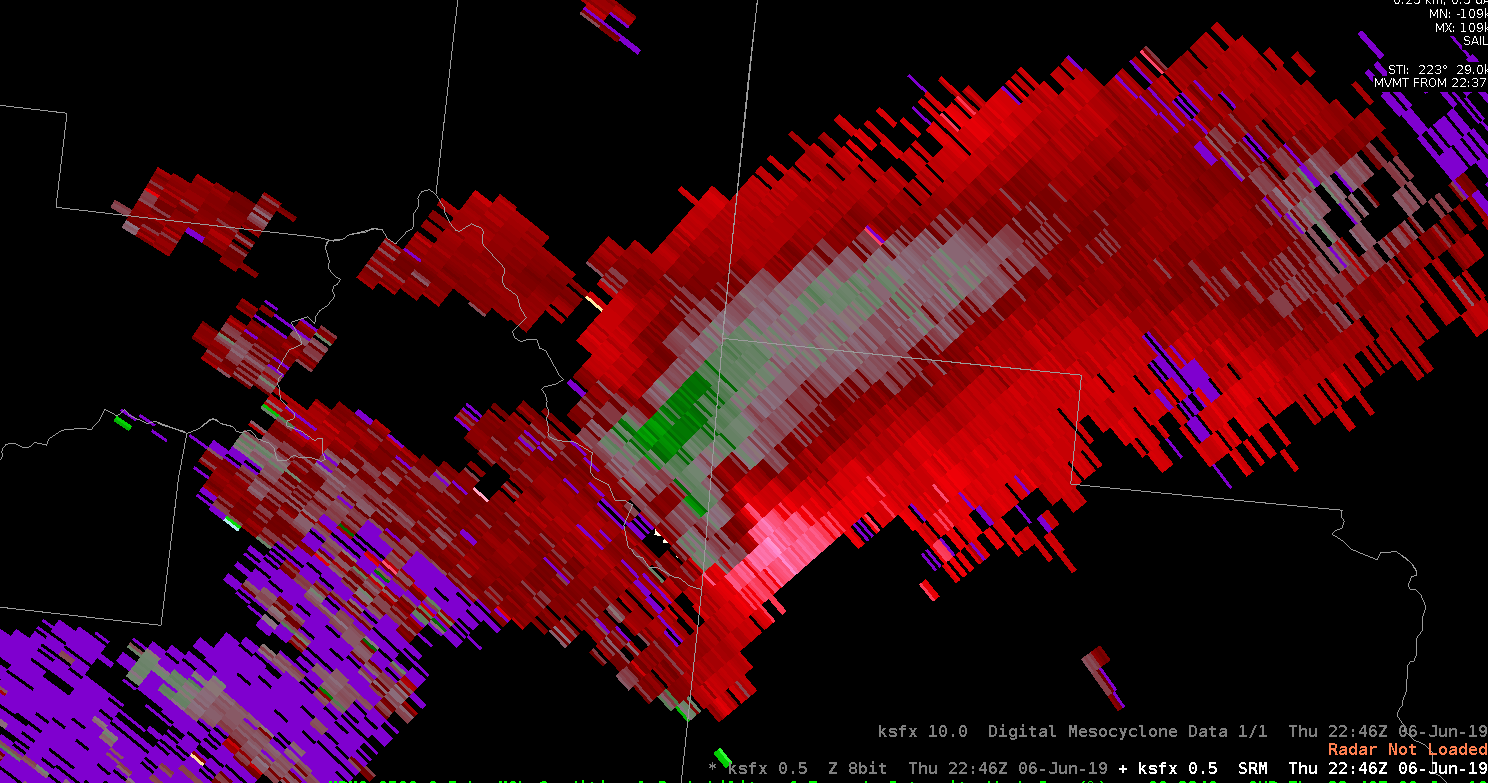
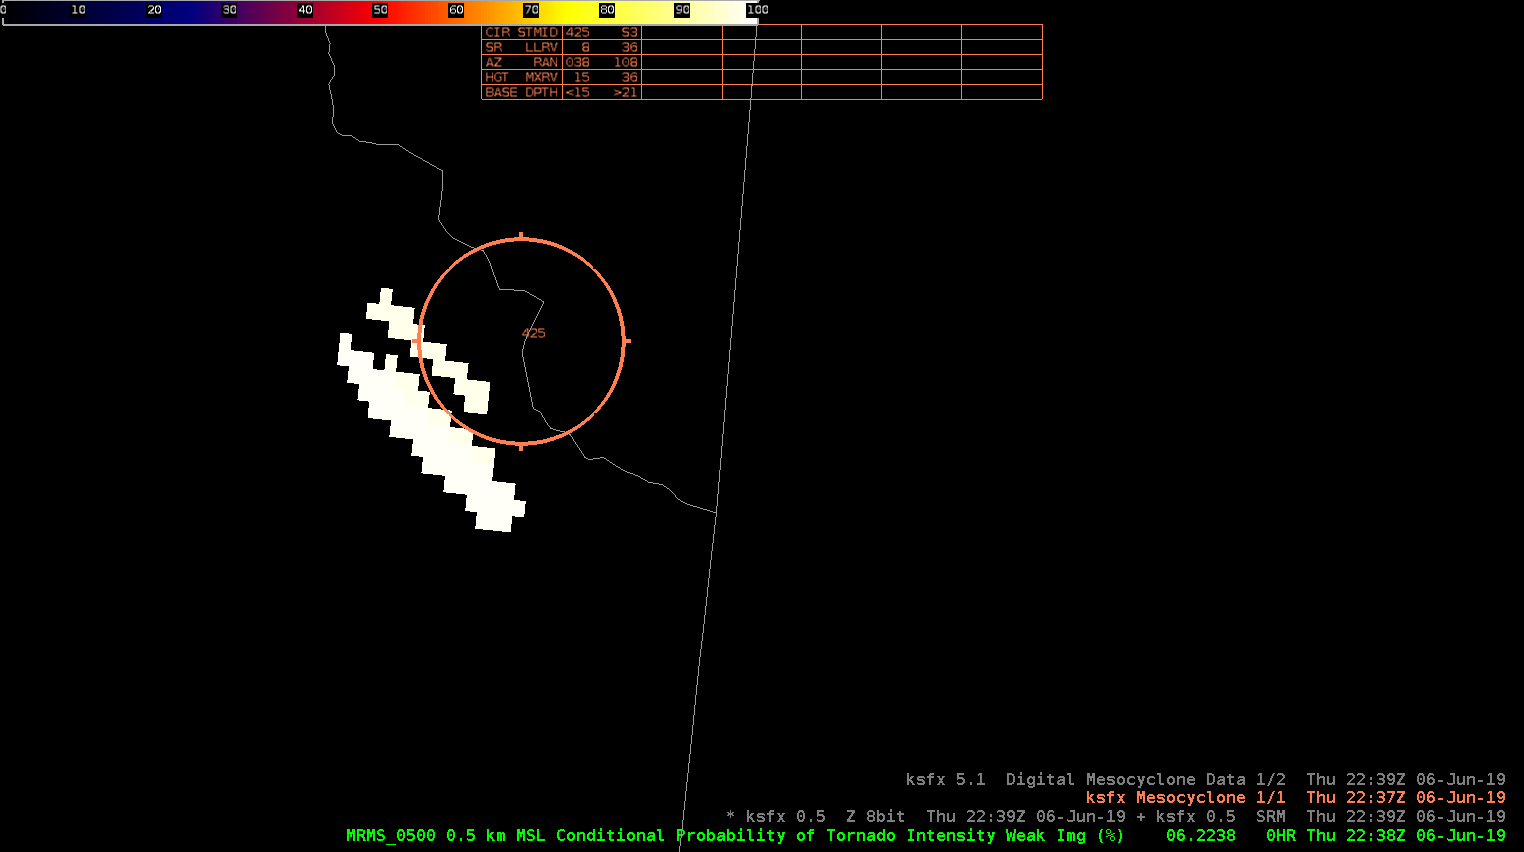
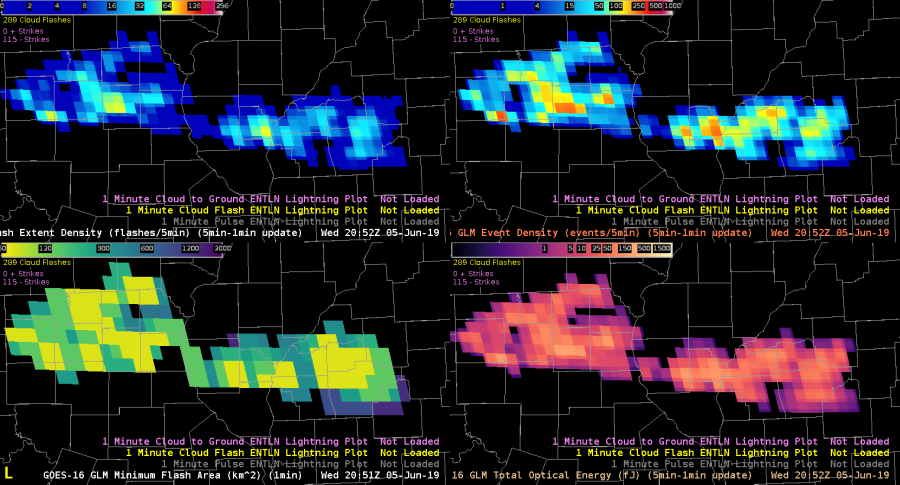
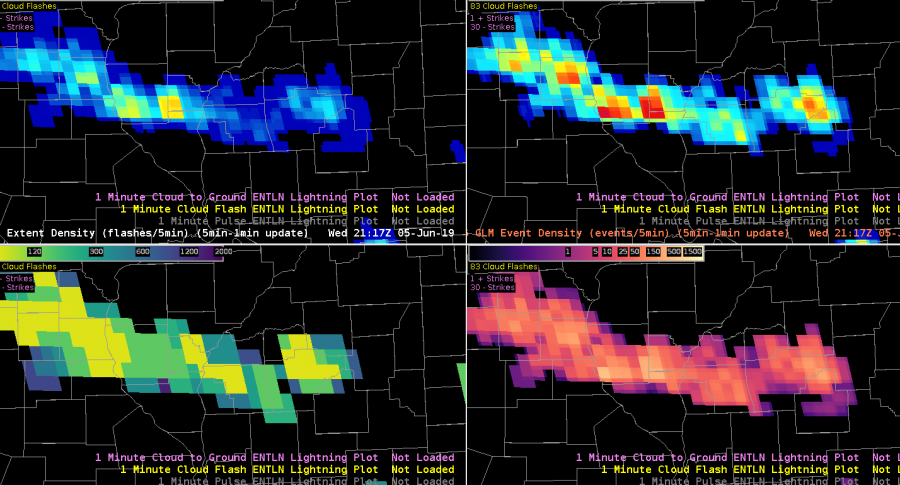
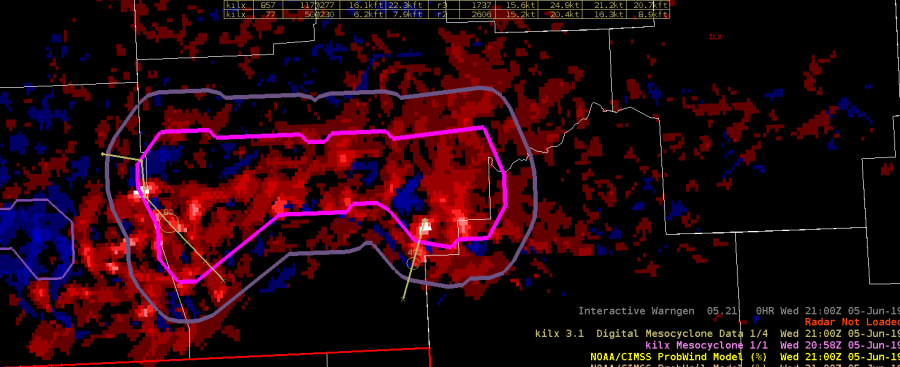
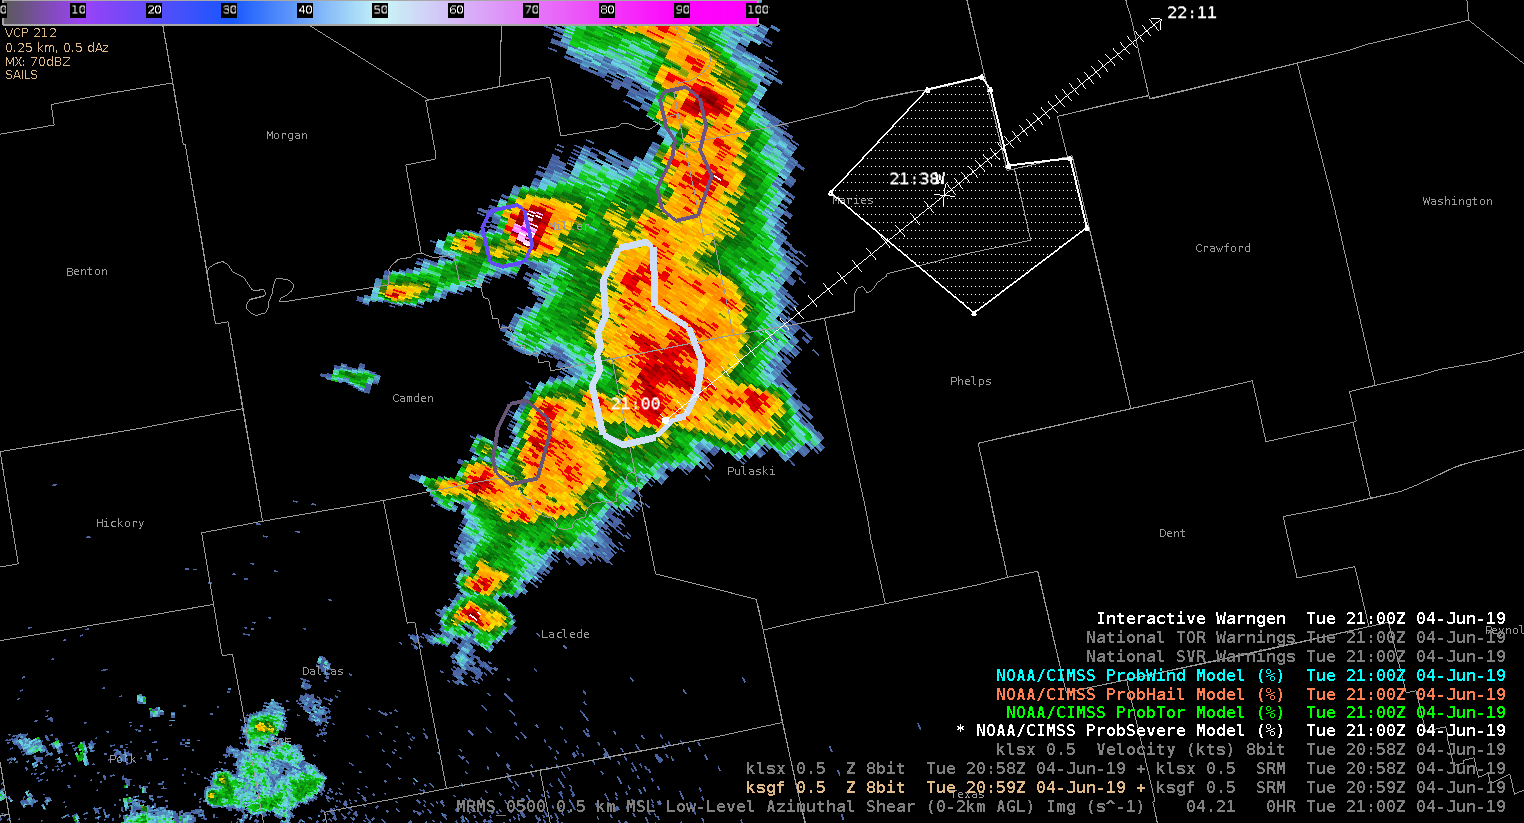
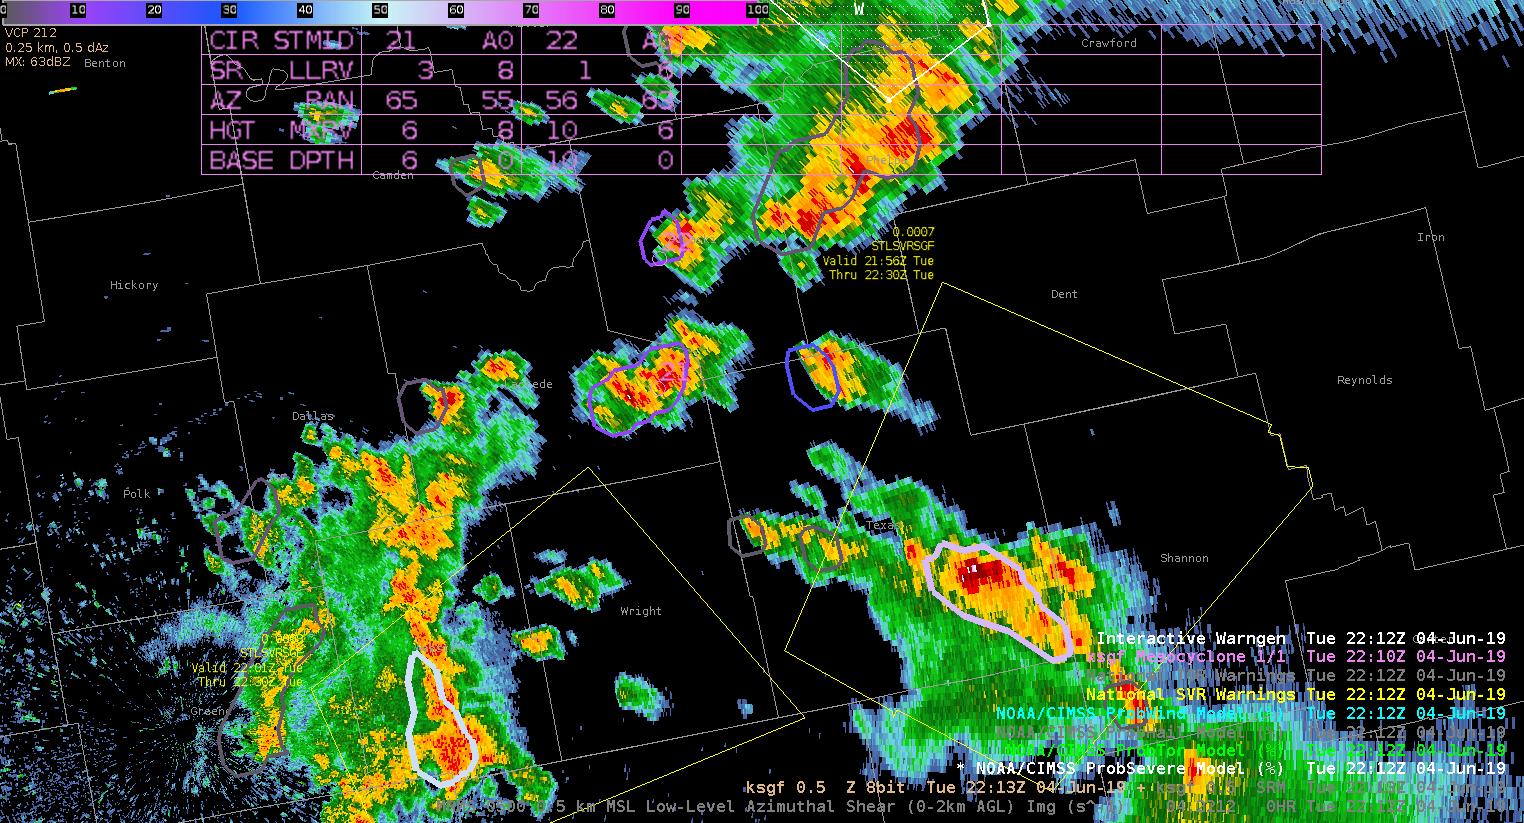
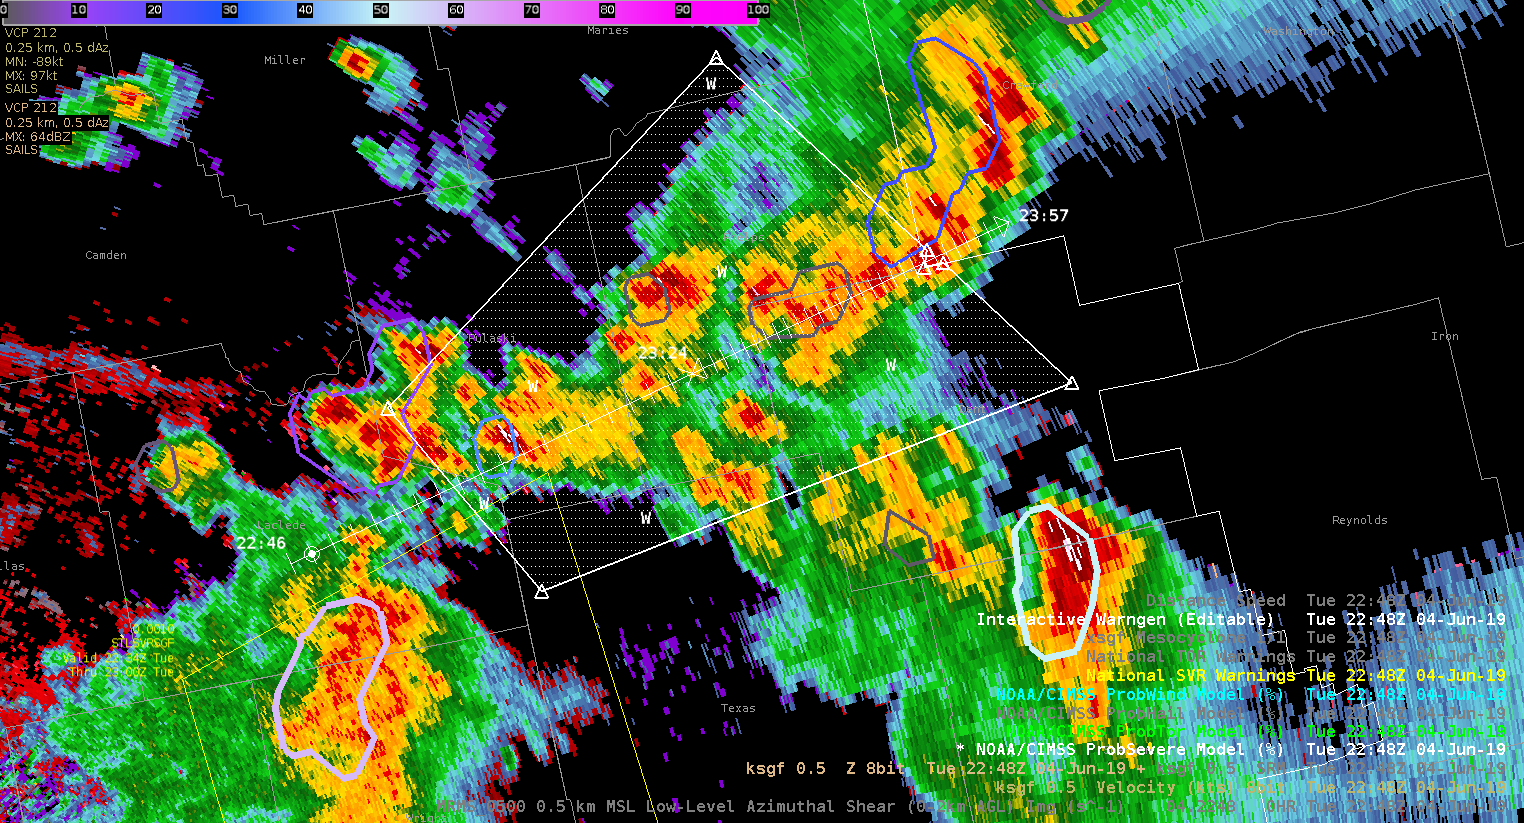
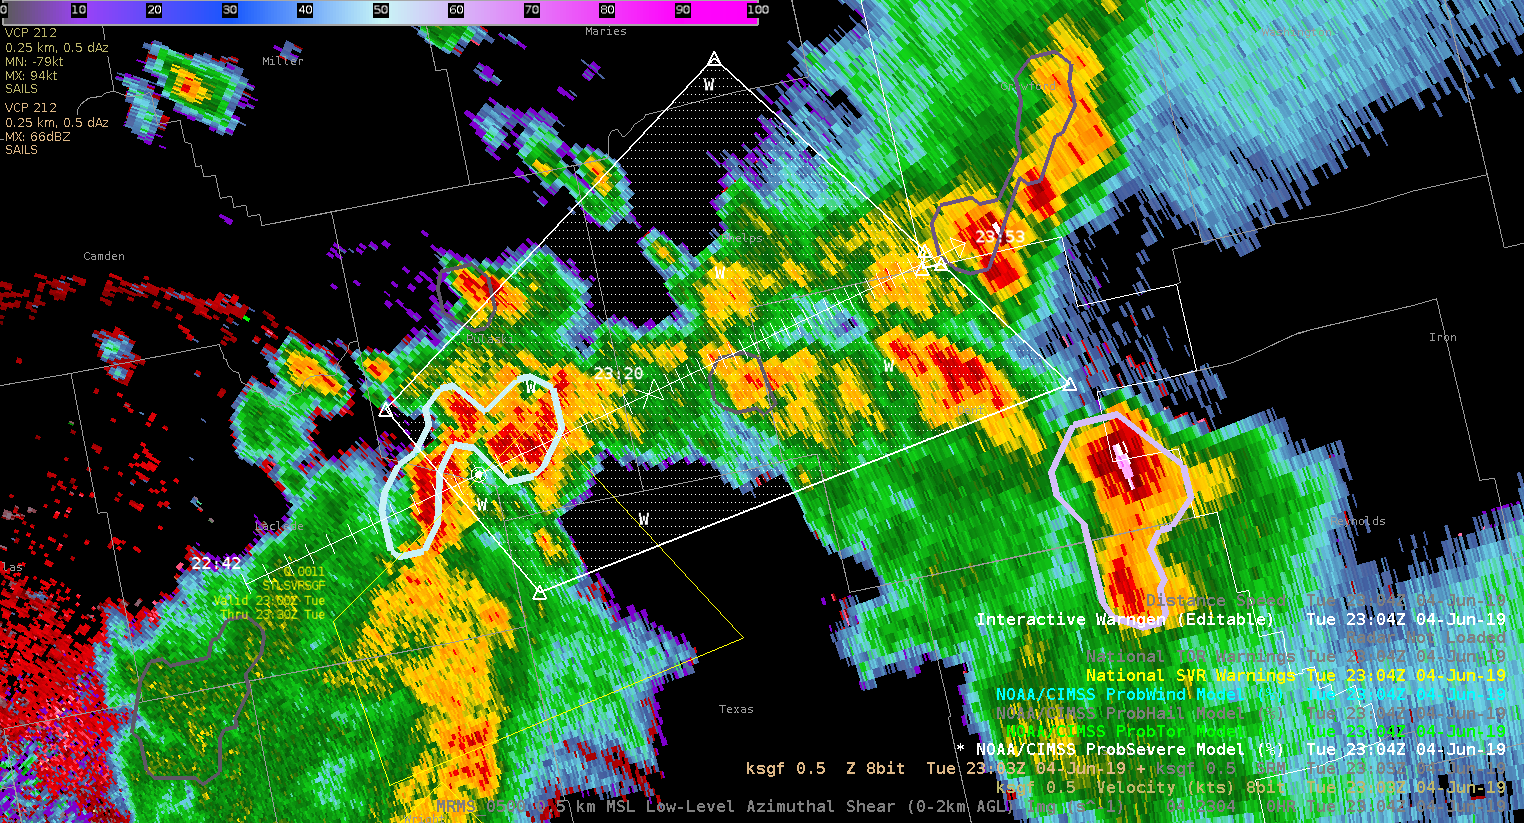
Taking a look at the minimum flash area…

Difficult for me to really see any sort of trend with the 1 minute data.  Nothing really catches my eye.  The 5 minute data is much more easy to see trends.  

As mentioned yesterday, am able to see more valuable information with trends in the storm than with flash density.


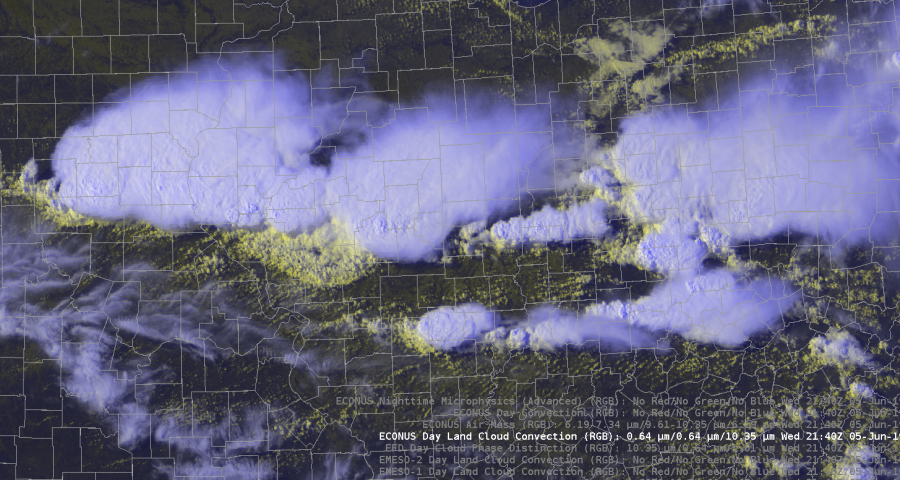
Looking at the optical winds…

The background is a bit too dark.  Can the Lat/Lon be put below the imagery?  Having it above seems to detract from what is being displayed.  Adding state borders, cities, would add to the usability of this product, especially if these labels can be turned on and off.

I like being able to pan the image.

I can see this being handy for monitoring for LLWS for aviation, assuming there are clouds to track.  Could this data be merged with NUCAPS to plot shear and helicity?   

Changing the density of the vectors would be handy.  

Color coding the different levels and matching it to the key is easy to determine what level I am looking at.  

Could this track the speed of dust?  If so, could help determine how strong the winds are in dust storms.

Curious why the pressure levels are broken down into 200mb intervals.  Could the winds also be tied to theta levels to help with isentropic analysis?

Having contours for the winds would help limit information overload as far as what is being shown.  Being able to control the density of the number of wind vectors would help, however that could lose some data.  Contours of the wind vectors, say every 5 or 10 kts, could help summarize what the individual vectors are showing.


-Accas

Pocatello Storms

We’re currently monitoring conditions in eastern Idaho. Right now I’m using various applications to analyze and initialize current conditions. Currently AllSky is showing cape around 1000kj, and PWATS around .80 inches.

That PWAT value on the morning sounding just west of the area was close to .64″. Seeing how moisture levels are lower to west I can interpolate that the moisture values are similar to what’s show on allsky. The allsky 900-700mb also seems to pick up on the relatively moist area in the lower half of the atmosphere.

Looking downstream we’re noticing a line of developing convection using the Day land cloud RGB. It’s helpful to analyze just how high the tops of the storms are getting combined with cloud tops.

Zooming in closer I can examine the few storms that have popped up more closely. The RBG help the differentiate between the ambient cirrus clouds from the growing storms. That might not have been as easy to see using a typical visible view.

The AFA and Minimum flash area maximums are hinting at growing convection just downwind.  That growth leads to me to anticipate further intensification as these storms move into a more favorable environment in eastern Idaho.

As storms begin to intensify probsever eis picking up on the strongest activity. Probsevere began to ramp up for the cell just south pf Pocatella. That combined with traditional radar methods lead me to issues a warning for that cell.

A similar situation unfolded with a south just south of CWA that I debated on warning. The probsevere values did show and uptick. Eventually the storm fell apart as it pushed into southern Idaho.

We’re watching a few cells in the southern half of the viewing area.  As NUCAPS comes in I’m comparing it the allsky cape. The allsky cape is around 1100kj.

The modified sounding is putting out about 700kj of ml cape. While the nonmodified is much lower down to 500kj.

We don’t have a midday sounding to see which one is initializing the best. For what it’s worth. The rap cape output is around 500kj.

The TPW was close to the observed pwats as well. It was outputting about .65″.

The FED has been fairly low this afternoon which isn’t typical for what I have been usually see. However, the AFA and the MFA are higher indicative of growing updrafts. I’m thinking the FED might be lower because of potential hail in the updraft.

The cell pushing out of Freemont county Idaho continues to intensify as it pushed into Montana. Both the MD, and NMDA were picking up on a high meso that was clearly seen on SRM.


The CPTI was showing high probabilities as well.  I still wasn’t as concerned about a tornado threat due to how high the base of the storm was. It was interesting to see though.

The forecast cape and cin values came in from the NUCAPS,  but it wasn’t usable for my area because their was a lot of missing data.

The actual Pocatella office issued a warning for Freemont county. Using typical radar methods the storm didn’t look like it warranted a severe thunderstorm warning, but satellite and MFA showed new convection was still firing up. Right after looking at satellite there was a report of a 54mph wind gusts.


Springfield Illinois Storms

Right now I’m analyzing the various new products to nowcast where and when storms will intensify. Currently I’m comparing ALLsky cape to the mesoanalysis from the spc. Right now the mesoanalysis is higher with cape compared to allsky. Over our area the it’s cloudy so the it’s taking data from the GFS.

A cell in our western counties ramped up very quickly while our computers were down. Prob severe immediately directed our eye to the cell. The probsevere lined  up with an uptick in vil values and velocity.

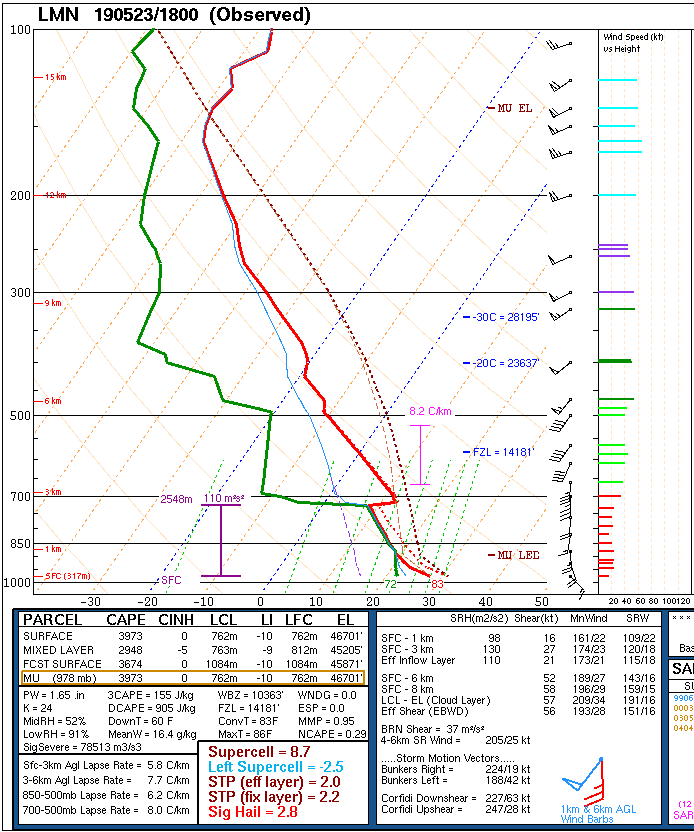
I’m comparing the actual sounding to what’s shown on nucaps, and allsky to see what’s initializing the best. The actual sounding shows 3025kj of surface lavyer cape and 1453 of mixed layer.

Around the same time allsky shows a similar value of cape.

The modified sounding was closest to the actual sounding with 1515kj of mixed layer cape

The nonmodified sounding is much lower when it comes to mixed layer and surface cape. In the case the modified sounding was more reliable and gave a more accurate picture of the current state of the atmosphere.

The all sky cape was much higher, around 2300kj.

That increase might be due to the fact that the sampled area of interest was filled in by the GFS. Whatever input the GFS was taking into might have lead to it overestimating the amount of CAPE.

I’m also looking at GLM products to see trends with convection. The combination of event density and GLM minimum flash area help me to see the rapidly growing updrafts as well as cell that are producing hail. That’s the case right now. My warned cell is producing penny size hail.

About an hour later the FED Is starting to pick up on longer flashes, but the event density is still showing higher values. The lines up with satellite which shows overshooting tops, but storms are overall keeping their intensity. The overall trend combined with looking at stability indices aids me in nowcasting that storms will at least maintain their strength over the next hour or so.

The Day Land Cloud convection RGB was helpful in analyzing different cloud tops. The color scale highlighted the thin cirrus compared to the lower thick clouds. It also dipicted the outflow boundary from our southern storms very well. It gives much more detail to the cloud types compared to the visible satellite.

Today I also got the chance to analyze and compare the merged TPW precipital water with the allsky.

During the afternoon the PW values stayed fairly steady across the northern half of the state while moisture increased in southern Illinois.

The TPW decreased PWATS to close to 1 inch as storms moved through. T

That data was sampled in a cloudy environment.

Meanwhile, the AllSky does show a decrease in PWATS but’s farther north compared to what actually happened. That data was pulled from the GFS since it was in a cloudy location. It was helpful to see how each product performed in this environment. It’s nice to have access to both in order to see which one has the best handle of the current atmosphere. That initialization helps me monitor trends and nowcast.

As storms moved south out of my DMA I used Day convection RGB just to monitor growing cells. It was clear to see the strongest storms because they had the bright yellow maxes.

Earlier in the day was able to compare NMDA with the low level azshear. Tornadoes were’t a major threat, but the NMDA did line up with peak areas of Azshear. That storm did produce wind damage, and strong wind gusts.

Taylor Johnson.

Springfield Storms

We’re currently analyzing storms developing in the Springfield Missouri WFO.  Right now I’m using various tools to monitor if these storms will become severe.

Right now I’m using a combination of radar, GLM, nucaps, and the All sky products. Currently the most helpful tools on top of what I normally use are allsky and the lightning products.

The allsky cape helped to find CAPE gradients and an increase in CAPE. The northern batch of storms were pushing into an area of increasing CAPE and in return they did intensify.

While deciding whether or not to issue a warning I also looked at AFA GLM data to see if there were new flashes developing which can be indicative of growing convection. That flashes aligned with radar and increased my confidence that storms would intensify.

That lead to me issuing a severe thunderstorm warning. The prob severe data also ramped up. So I felt confident about my warning.

I also used NUCAPS sounding predictor to look at the cape during the rest of the afternoon.


While watching storms in the Springfield area I tried using  NMDA. Even after magnifying the product it was still a bit hard to see. I’m note sure if there’s a way to make the circle bigger or more pronounced. It can get busy on an active day.

As I continue to track storms I’m using Allsky CAPE to see what type of environment they are moving into. The CAPE does increase farther east so that makes me anticipate convection wane over the next few hours. I will though pay close attention to the storm farther north since they will move along the cape gradient.

I also used probsevere to increase my confidence in warning for a cell in pulaski county. The velocity ramped up as well as vil values.


The increase in probsevere over a few scans prompted me to issue a severe thunderstorm warning.

Taylor Johnson

EAX Near-Term AFD (Mountain Bone)

A decaying MCS continues to progress northeast across the central portions of northernmost Missouri, allowing for destabilization to begin in its wake. This is especially true along and west of Interstate 35 in NW Missouri/eastern-most KS where clouds have cleared for several hours according to GOES_East Channel 2 imagery. With in-situ observations showcasing upper-60s to low 70s dewpoints at the surface across the central and eastern portions of the state, it likely won’t take much in the way of surface heating to allow for convective initiation this afternoon and evening.  Based on downstream NUCAPs soundings, rather robust SFC CAPE values in the 3000 – 4000 J/KG range will likely spread northwestward with time, which should be ample to support some convection this afternoon and evening. Best (early) thoughts on initiation location this afternoon will be across the easternmost portions of the CWA along a line from Boonville to Centerville along the eastern most periphery of the nearly stalled MCS, which could provide for enough lift to get things firing by late afternoon and evening. Also keeping an eye on a downstream shortwave clearly evident in GOES_East water vapor imagery which could push an additional round of multicellular convection through late this afternoon and evening. Most likely to brush the southern and eastern portions of the CWA, which currently finds itself adjacent to a severe thunderstorm watch extending to its south and eastward. .

Any storms that do form or push into the area should have plenty of moisture and instability to sustain themselves. All_Sky TPW and NUCAP soundings show a plume of 1.3 to 1.5 inch PWATT values extending north throughout the entire CWA, which also brings the concern for some additional flooding, especially across the southeastern portions of the CWA which will likely see more numerous coverage of storms. Low 0-1km and 0-6km effective shear values should limit the presence of sustained supercells, however, a strong to severe thunderstorm or two will remain possible this afternoon and evening.

————————————————————————————————-Mountain Bone


NUCAPS Procedures Usefulness

The NUCAPS Quick  Guide from JPSS includes a few procedures. Here I show the utility of a few of those procedures for combining GOES Satellite data and NUCAPS data.

This procedure plots 400-200mb relative humidity and GOES-16 water vapor. You can see the representation of the dry air across the northern US and the systems in the Plains & southeast.

Another procedure compares GFS, HRRR, and NAM lapse rates with the NUCAPS lapse rate info. This is a good check to see if model lapse rates are performing well or where they need to be taken with a grain of salt.

Another procedure plots 850-300mb RH and low-level water vapor. The product shows the system in the Plains and the system in the Ohio Valley. Drying is also obvious in the southern Great Lake and North Dakota.

I like the procedures provided in the JPSS Quick Guide. I am starting to understand the applicability of the NUCAPS data little bit more. These procedures are helpful in contextualizing the provided data fields.

-Atlanta Braves

Comparing NUCAPS Modified Soundings and 18Z RAOBs

A satellite pass at around 19Z allowed us to compare NUCAPS modified soundings with 18Z RAOBs. A comparison of a NUCAPS sounding near Amarillo seemed to reasonably represent the mid and upper levels with the 18Z KAMA RAOB. The NUCAPS sounding had slightly lower freezing level and -20C and -30C heights compared with the RAOB (10.9, 19.0, and 23.2 kft vs 12.2, 20.8, and 25.4 kft, respectively). The midlevel lapse rates were comparable at around 8.0 C/km. However, the NUCAPS sounding appeared to struggle with the lower levels, not representing the subsidence inversion evident on the RAOB, and being too cool and dry at the surface (T/Td of 20/17C on the NUCAPS compared with 24/19C on the RAOB). This led to lower CAPE estimates from the NUCAPS than were observed by the RAOB.

Similar results were seen in a comparison of the 18z KLMN RAOB with a NUCAPS Modified sounding near Lamont, OK:

Ron Dayne

Comparing the modified and unmodified NUCAPS sounding from Western Oklahoma on May 23

While waiting for any convection to develop in PA, I ventured into western Oklahoma to do a comparison of unmodified and modified NUCAPS soundings in an area under an enhacned risk of severe weather. The soundings examined were near the Texas border (point E below).

We’ll first look at the visible satellite and observations at 19Z.

Notice that point E is near a WSW/ENE oriented boundary. Obs near the point show temperatures in the mid 70s, with dew points in the mid 60s. So let’s take a look at the unmodified NUCAPS sounding first.

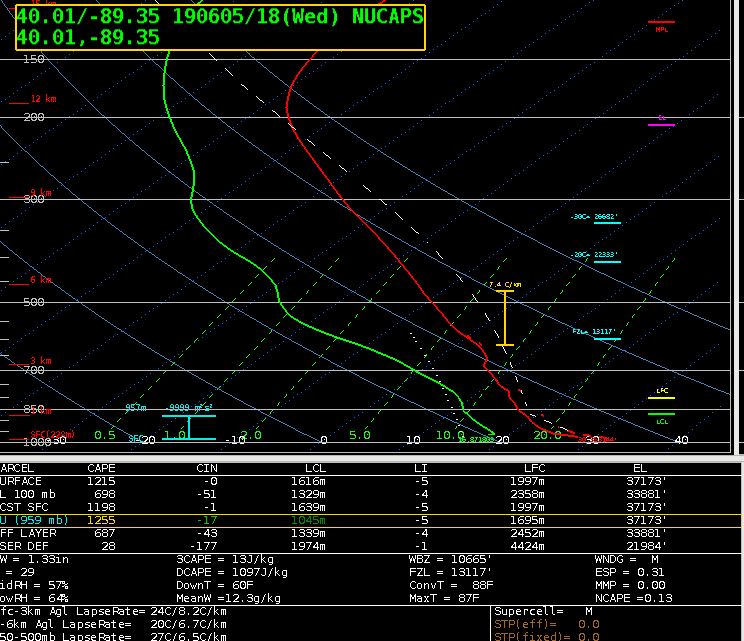
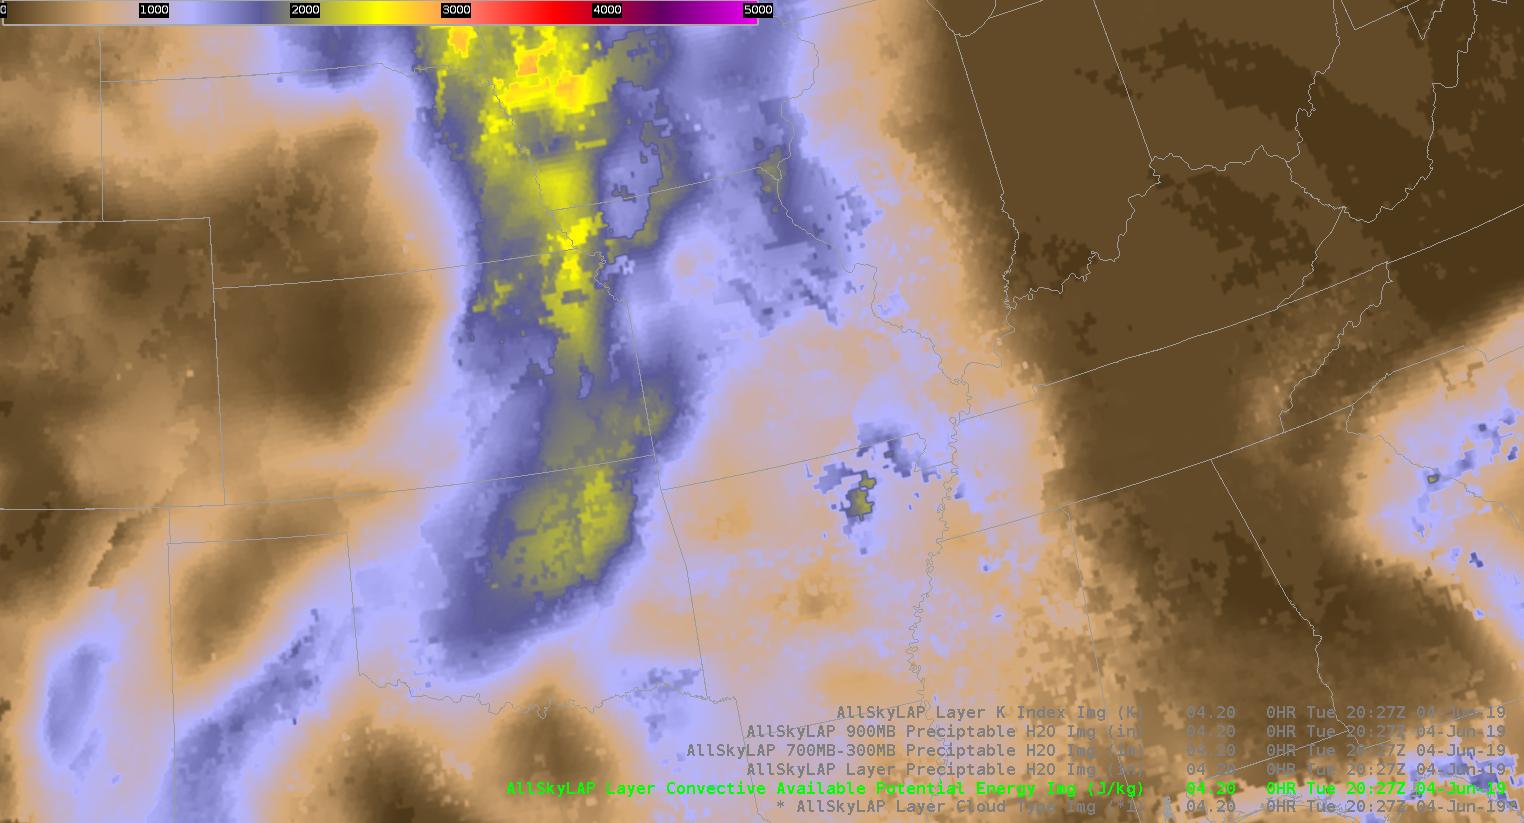
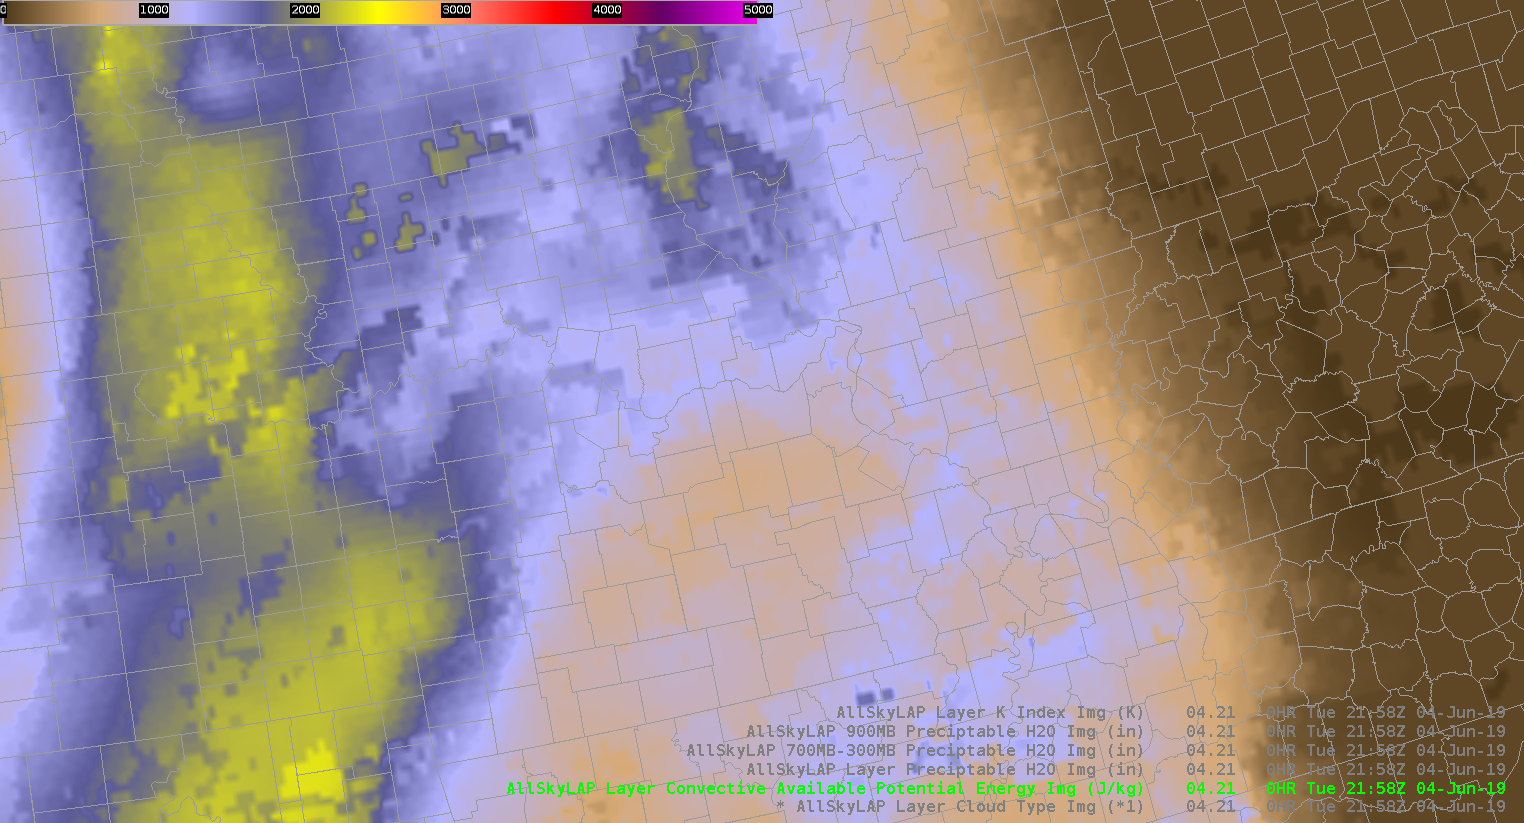
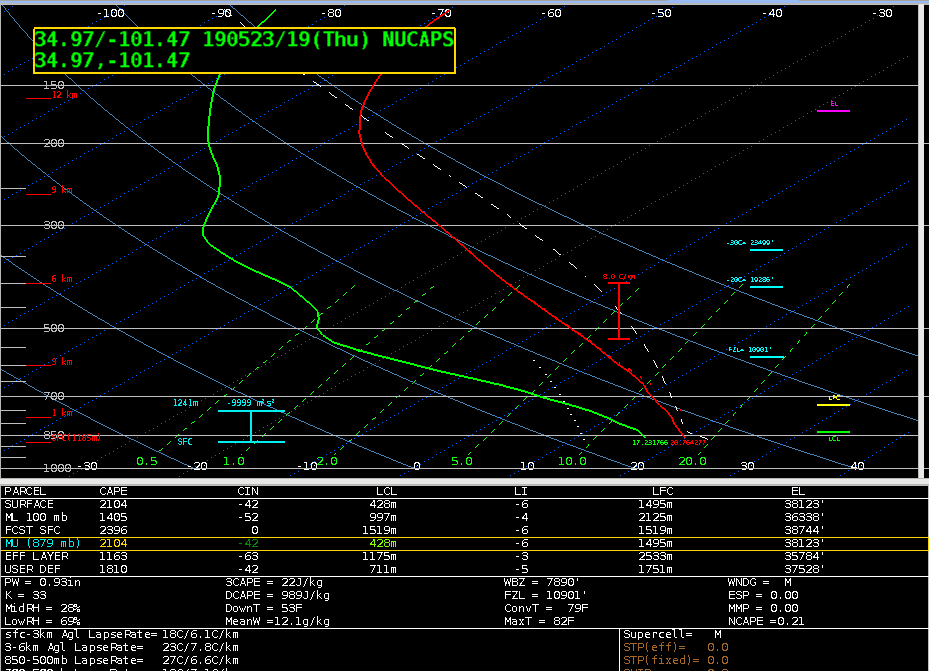
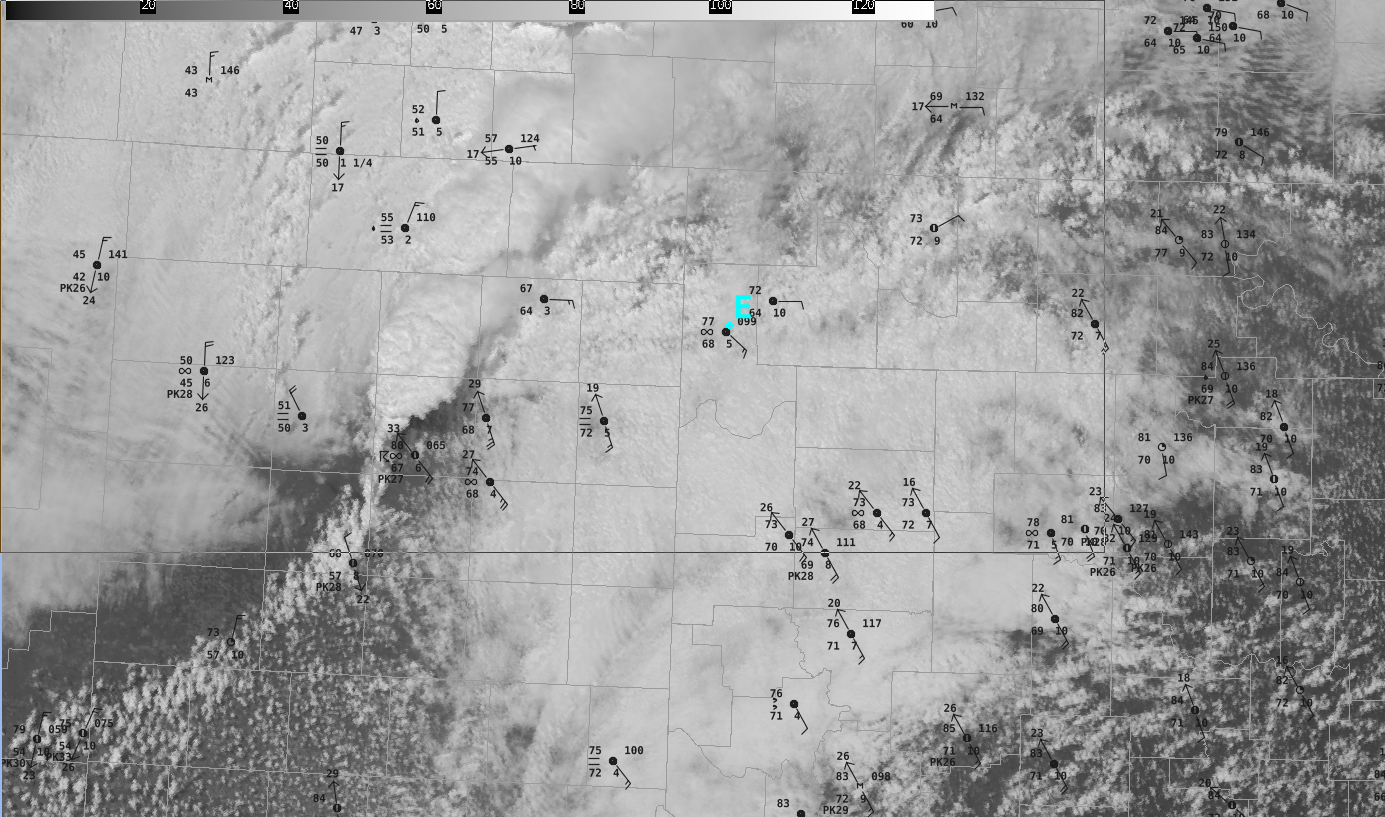
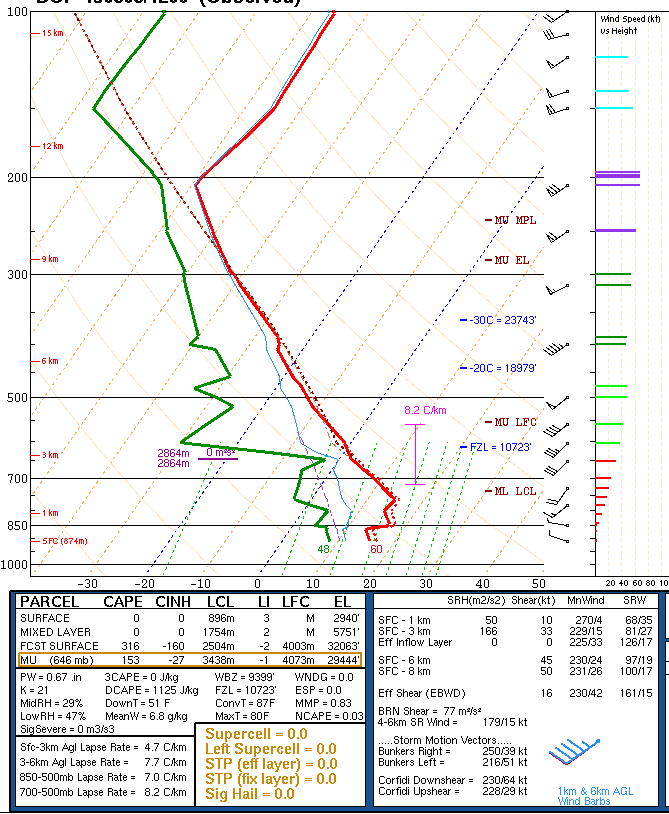
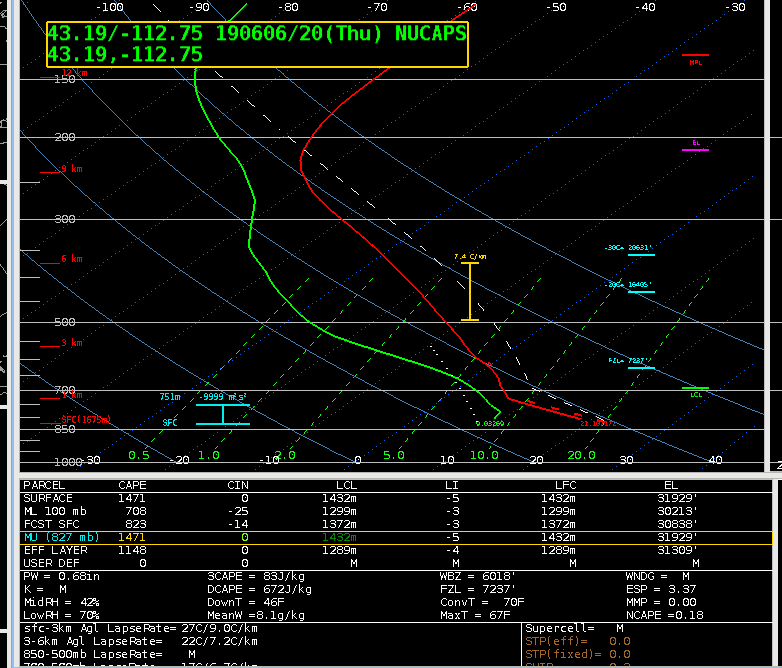
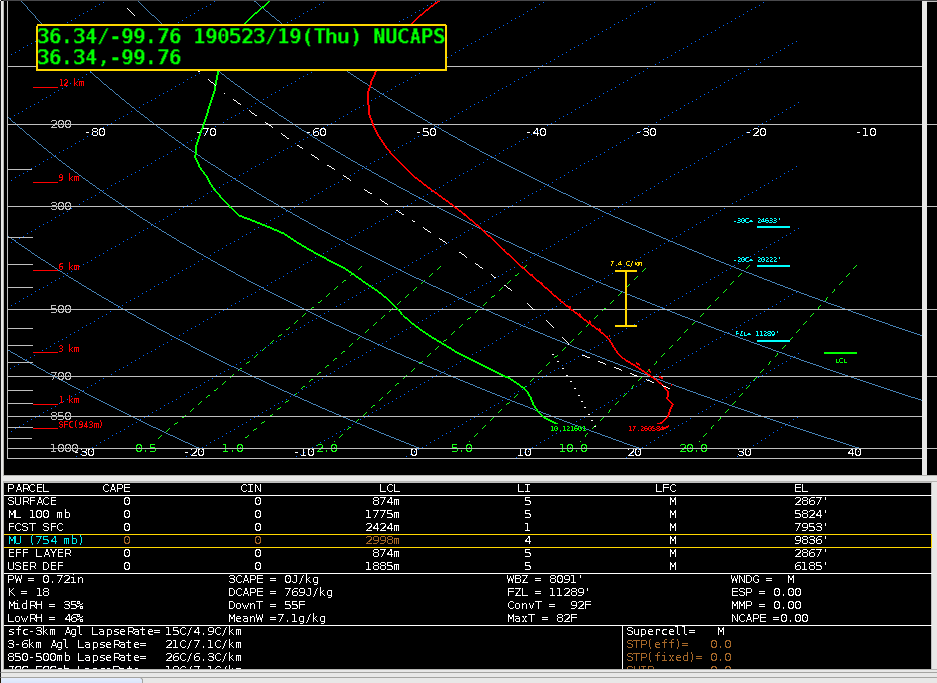
It uses a surface temperature of 63F, and a surface dew point of 50F, both more than 10 degrees below the nearby observations. These inaccurately low values give, as one would expect, no sign of instability (CAPE=0). Looking at the modified NUCAPS gives a different picture, however.

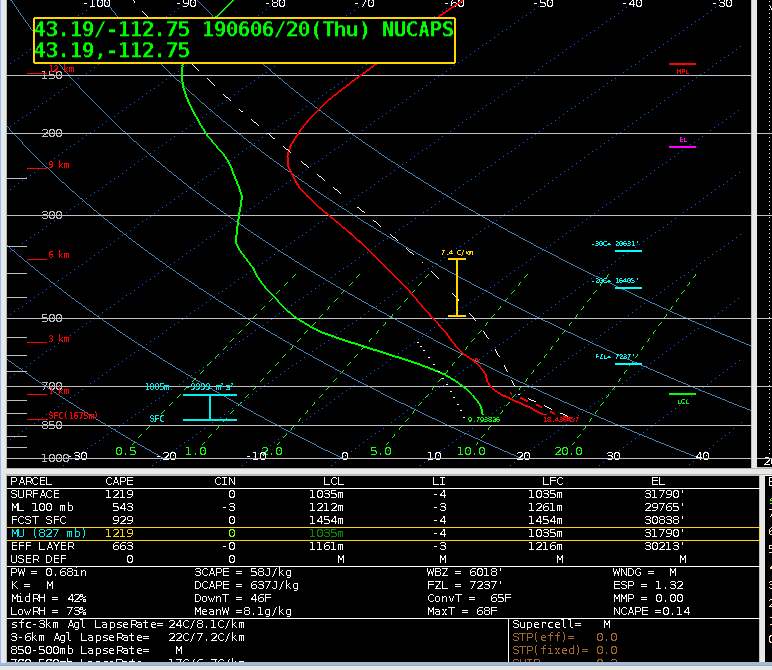
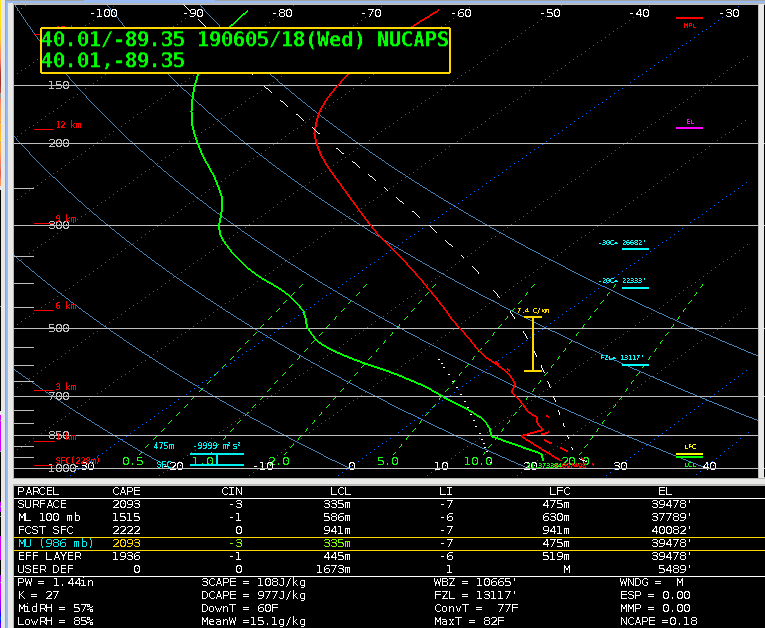
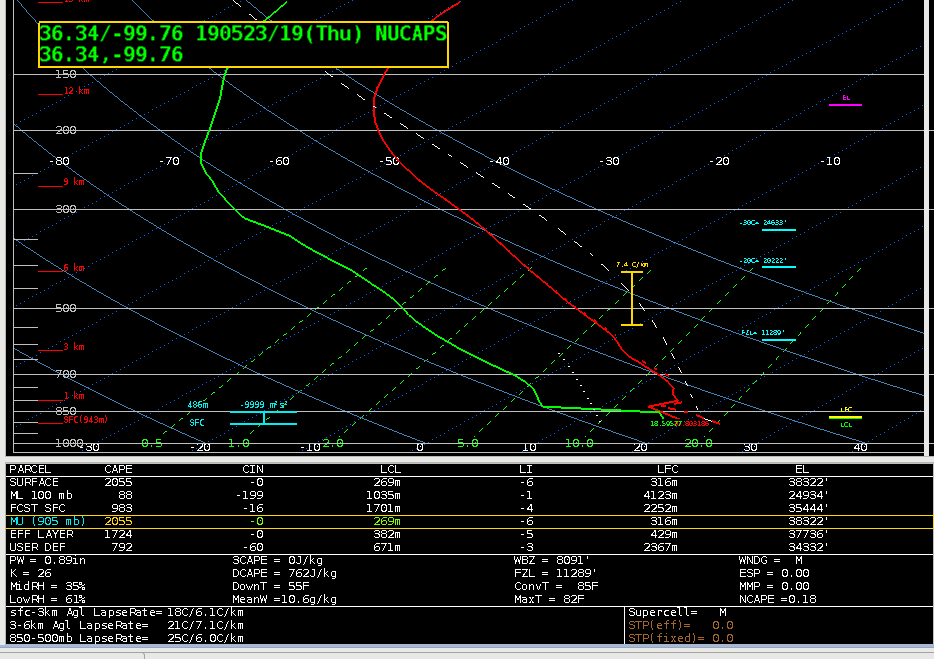
In the modified sounding, the surface temp is 69, and the dew point is 65, which is much closer to the observed surface obs. This changes your surface-based CAPE to 2055 J/kg, vs. 0 from the unmodified. It also has a sharper low level inversion, which one wood expect based on the stratus deck in place.

To “verify”, let’s look at the SPC mesoanalysis.

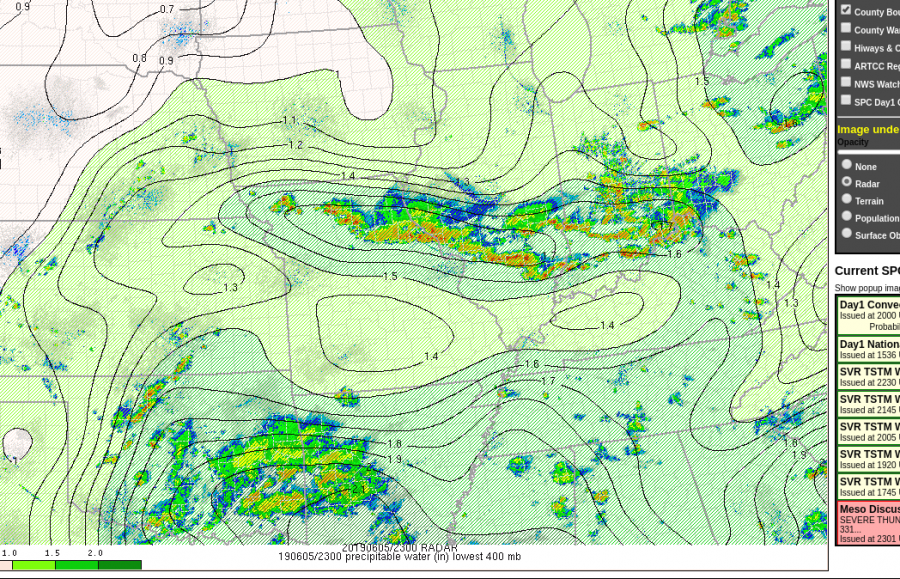
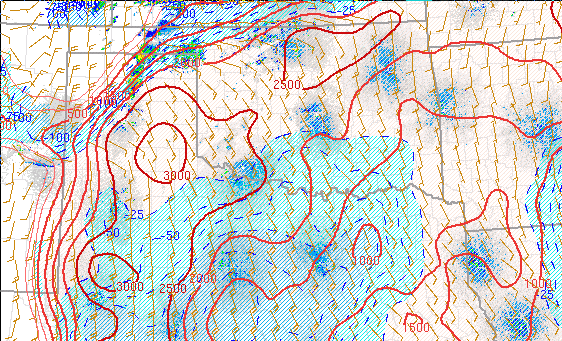
Sure enough, the mesoanalysis shows CAPE at around 2000 J/kg.   Clearly, this is another case where the modified NUCAPS sounding is a noticeable improvement over the unmodified sounding.

Thorcaster

Comparisons of NUCAPS and Model Data Lapse Rates…

So, it can be refreshing to see when NUCAPS data agree with model data, but I’m often more interested in those cases where there are differences, and potentially important differences.  Notice in the images below the comparisons between NUCAPS 850-500 mb lapse rates and various model data.

Image 1. 850-500 mb lapse rates from NUCAPS (upper left), HRRR (upper right), GFS (lower left), and NAM40 (lower right), valid ~18 UTC 23 May 2019

Notice the relatively large differences that stretch SW to NE from central W VA into New England.  Taking a look at nearby radar imagery, it’s clear why this area had significantly lower lapse rate values in the NUCAPS data than the models; a line of showers and thunderstorms were present along this path of lower values that was displayed in the NUCAPS gridded data (Image 2).

Image 2.  850-500 mb lapse rates from NUCAPS (upper left), HRRR (upper right), GFS (lower left), and NAM40 (lower right), along with 0.5 Refl from the KCCX radar, valid ~18 UTC 23 May 2019

Of course, the NUCAPS retrievals certainly would have been affected by this area of denser clouds and precipitation.  Nevertheless, lapse rates would be affected (lowered) by the convection in those locations, which is depicted in the NUCAPS data only.  So, the lack of this feature in the models would then affect their forecast in this region going forward.  It will be interesting to see the NUCAP-Forecast data in this type of scenario.  In fact, one of the forecasters here is taking a look.  Anyway, let’s imagine a scenario where this convection had dissipated and left behind a boundary or gradient in temperature/moisture.  The detection of these types of boundaries, that often occur in pulse type convective events especially, can be important for predicting where convection will take place subsequently.

Oh…one more thing, it was interesting to notice the quick air mass recovery and advection of steep lapse rates and instability behind the area of convection in the OH Valley.  So, given ample forcing, further convective development is possible even behind this line.  In fact, the NUCAPS indicates lapse rates ~7 C/km across a broad area on the edge of the swath in the OH Valley.

-Kris W