

NUCAPS retrievals became available around 21z, so I decided to do a new mesoscale analysis. I wanted to know about the air in the warm sector that the storms will likely be ingesting. The first retrieval I looked at was the southern-most green dot in the eastern most MUCAPS swipe. The sounding in this retrieval came in with a surface temp about 20 degrees cooler than the observation, so I’m thinking this retrieval is either being contaminated by ongoing convection or actually sampling north of the warm sector. The retrieval just to the south of that had surface temperatures more reasonable, and the associated skew-t is shown below.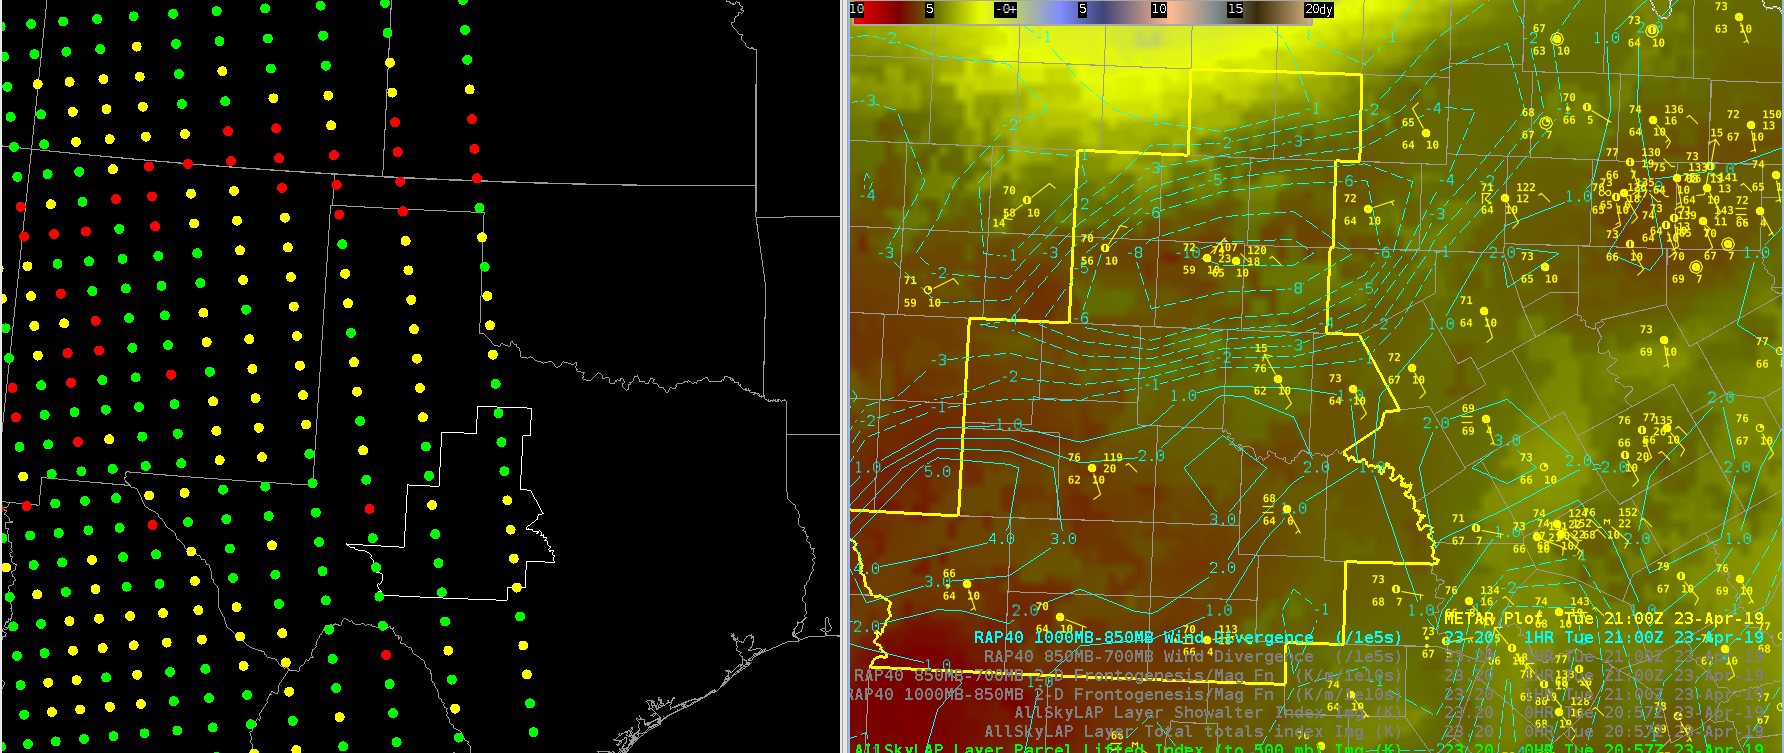 After a quick adjustment to the lowest points on the sounding, this clearly looks like a severe weather sounding. I’m hesitant to rely on CAPE estimates given the dependency on the boundary layer, but indicies more reliant on mid level obs (LI) are still indicative of strong to severe storms. This compares well to all-sky LAPS retrievals (above, right).
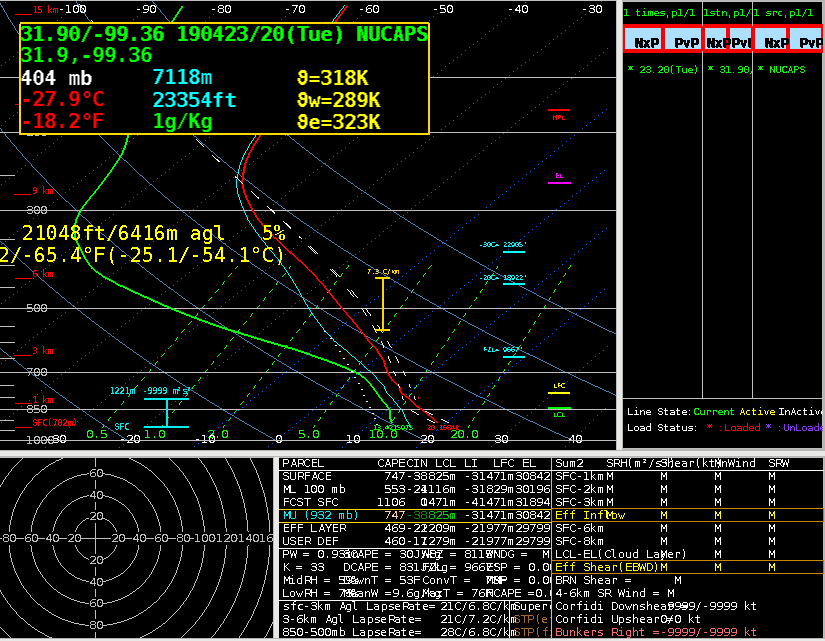 In typical operations in which I do not have access to these products, I would rely on the SPC mesoanalysis (below) to estimate instability. The NUCAPS and LAPS All Sky retrievals do somewhat increase my confidence that the mesoanalysis is close to reality. However, Given my conceptual model of how the atmosphere should be behaving, I was already highly confident that the atmosphere is quite unstable in the warm sector, so the increase in confidence from NUCAPS/LAPS is somewhat limited.
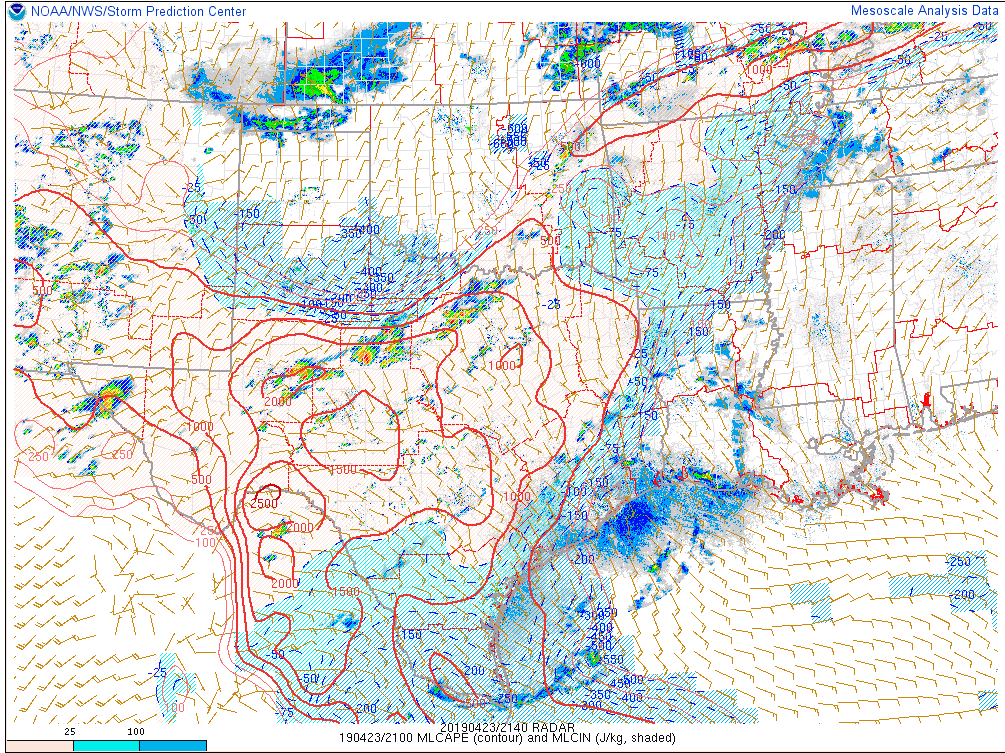 Sandor Clegane
Tag: NUCAPS
NUCAPS Modified vs. Non-Modified
With an afternoon pass of NOAA 20 there are now NUCAPS soundings over our active area of MAF and SJT. Looking at the non-modified and modified soundings there are several different things to note. On the image below the raw NUCAPS sounding is on the left and the Modified is on the Right. From this view it may be hard to see the differences, but a few are listed below.
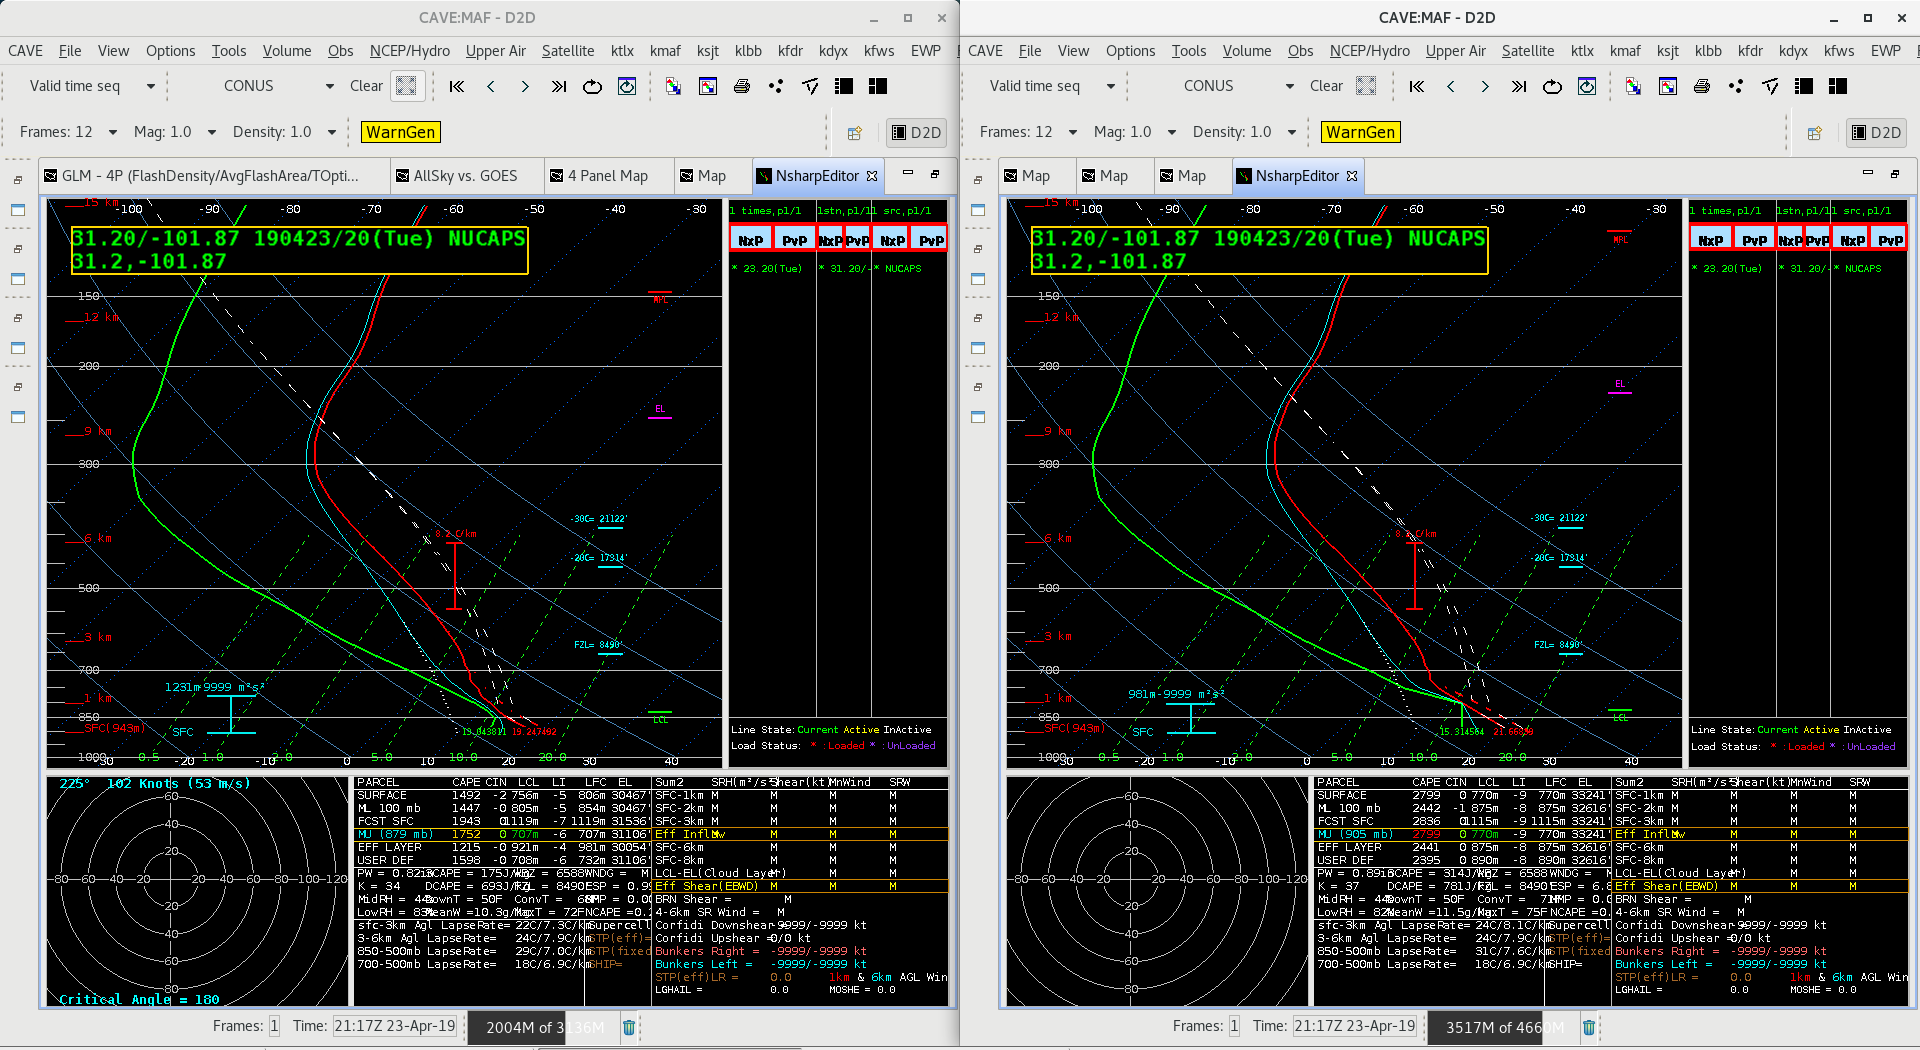
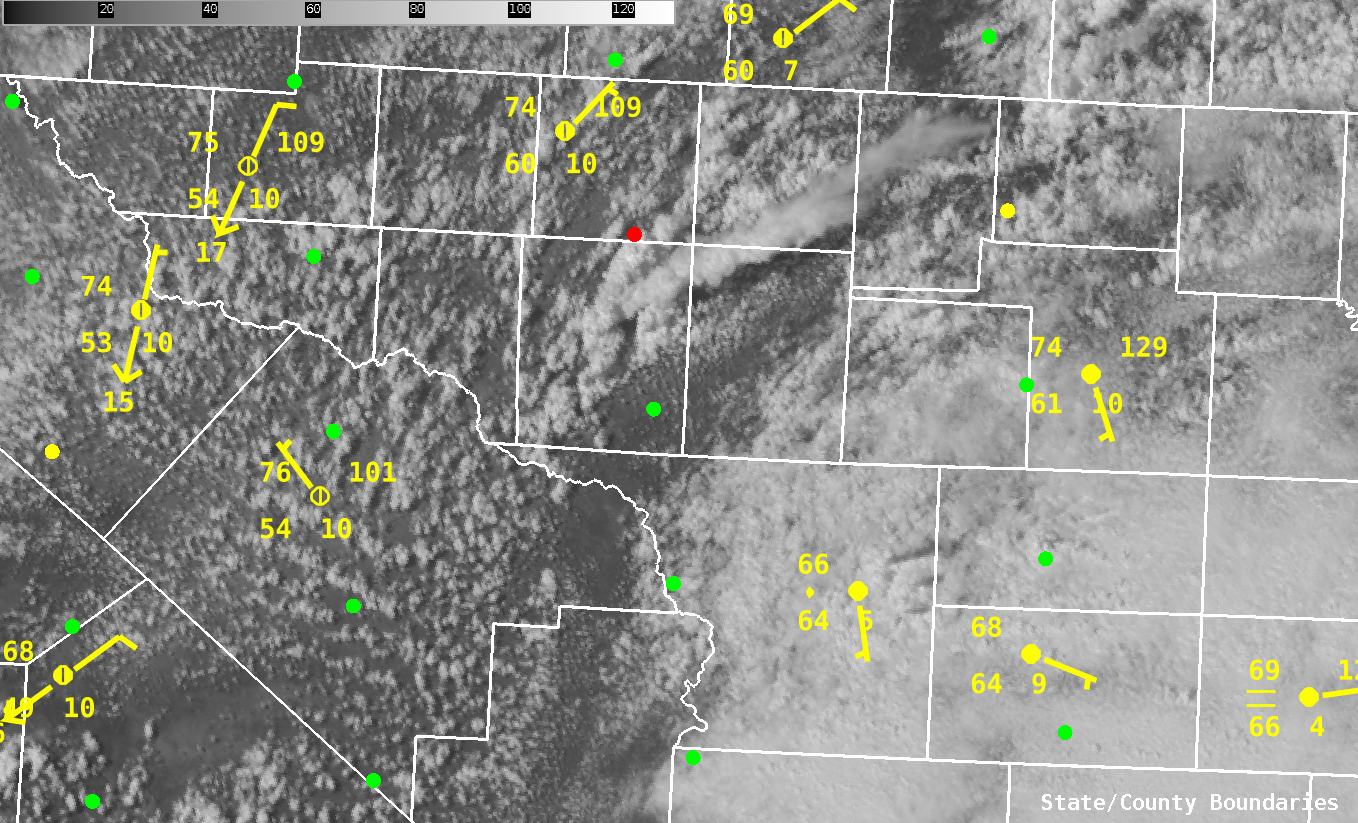
- Based on the location of the sounding and the surface observations (the location is the green dot just south of the red dot in the image below) the modified sounding DOES DO A GOOD JOB at the surface. The Modified Sounding has T=71 and Td=60. The non-modified sounding shows T=67 and Td=55. Looking at the surface observations below the modified sounding is more reasonable with Td around 60 and temps in the upper 60s and lower 70s.
- Just above the surface though there is some questionable signatures. First it appears the modified sounding assumes that there was a cloud deck around 1km (T and Td almost the same). This is questionable as the visible satellite below does show more clear skies around the point. As that point is right along the front there has been mostly clear skies near that point. How it handles these parts of the mixed layer are more questionable.
- These differences to make a BIG difference in the severe weather environment. Most notably CAPE. If you look at the surface CAPE it goes from 1492 in the non-modified to 2799 in the modified. That is significant, especially when these supercells are producing hail. There has been a 2.5 inch hail report to the east of this dot location, which does lend itself to pointing towards larger hail.
-Alexander T.
Comparing RAOB to NUCAPS and AllSky Layer Precipitable Water
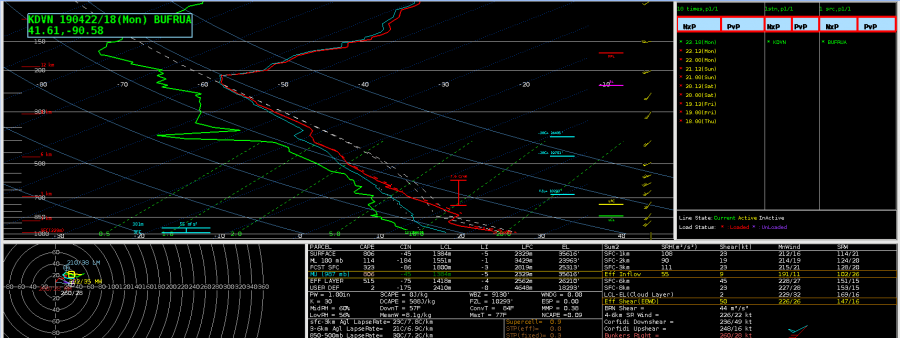
Davenport launched an 18Z balloon, which gave me the opportunity to compare the RAOB with a NUCAPS sounding (first and second images below, respectively). Initially, I attempted to modify the sounding in NUCAPS to try to bring it closer to the observed values, but after several minutes and attempts at doing that, I realized that I’d have to do multiple levels of modifications before it came anywhere close to the observed sounding. As great as it is to have the ability to modify the NUCAPS sounding, my initial thoughts are that I’m not sure how feasible it would be to do this in a much quicker-paced operational setting. If I’m sitting in the mesoanalyst seat during a severe weather event, I’d need to be able to analyze the available data much faster than doing a more detailed modification would allow.
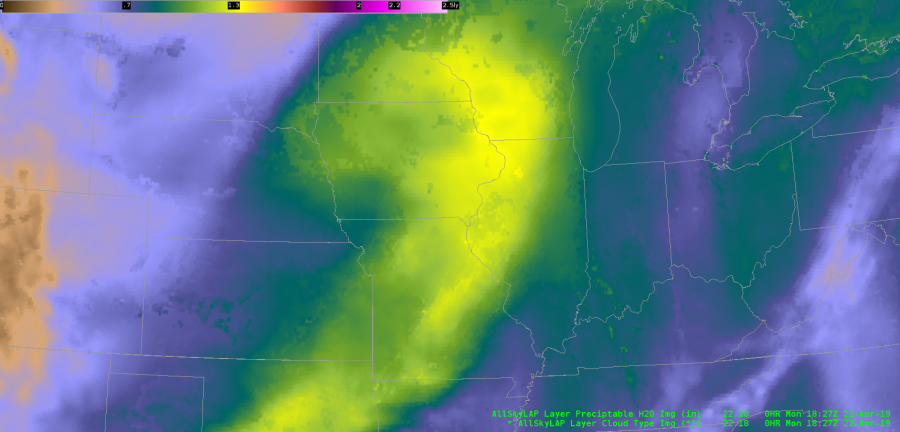
I was also able to do a PWAT comparison between these two soundings and the AllSky Layered Precip product. The NUCAPS and RAOB are very close together in values, whereas since the AllSky product (last image below) is currently utilizing the GFS to fill in the data in the DVN area, it’s noticeably higher (RAOB: 1.0″; NUCAPS: 1.1″; AllSky: 1.3″). I am very happy to be able to underlay the data type for the LAP products, since this is crucial for me to be able to see where the data is coming from and how to correctly assess and apply the right bias adjustments, as necessary.
As for the AllSky Layered Precip product, in general, this is very helpful to be able to identify potential atmospheric rivers and quickly diagnose PWAT trends with a decent degree of confidence, when again combined with the knowledge of what data is being used to compute the output.
~Gritty

NUCAPS in 4-Panel
When NUCAPS Sounding Availability is loaded in a 4-Panel and is ‘Editable’, you can sample the data by clicking on any of the other panels. This could be useful if there is an area of interest in one of your other datasets (i.e. vis/CAPE/PWAT) so that you don’t have to find the nearest dot using the NUCAPS imagery; simply click the area of interest on the panel you’re investigating. Works in panel combo rotate as well.
— FLGatorDon