Compared several NUCAPS soundings across the pass to determine usefulness of the modified versus unmodified data. In each example, the modified is on the left and unmodified is on the right. 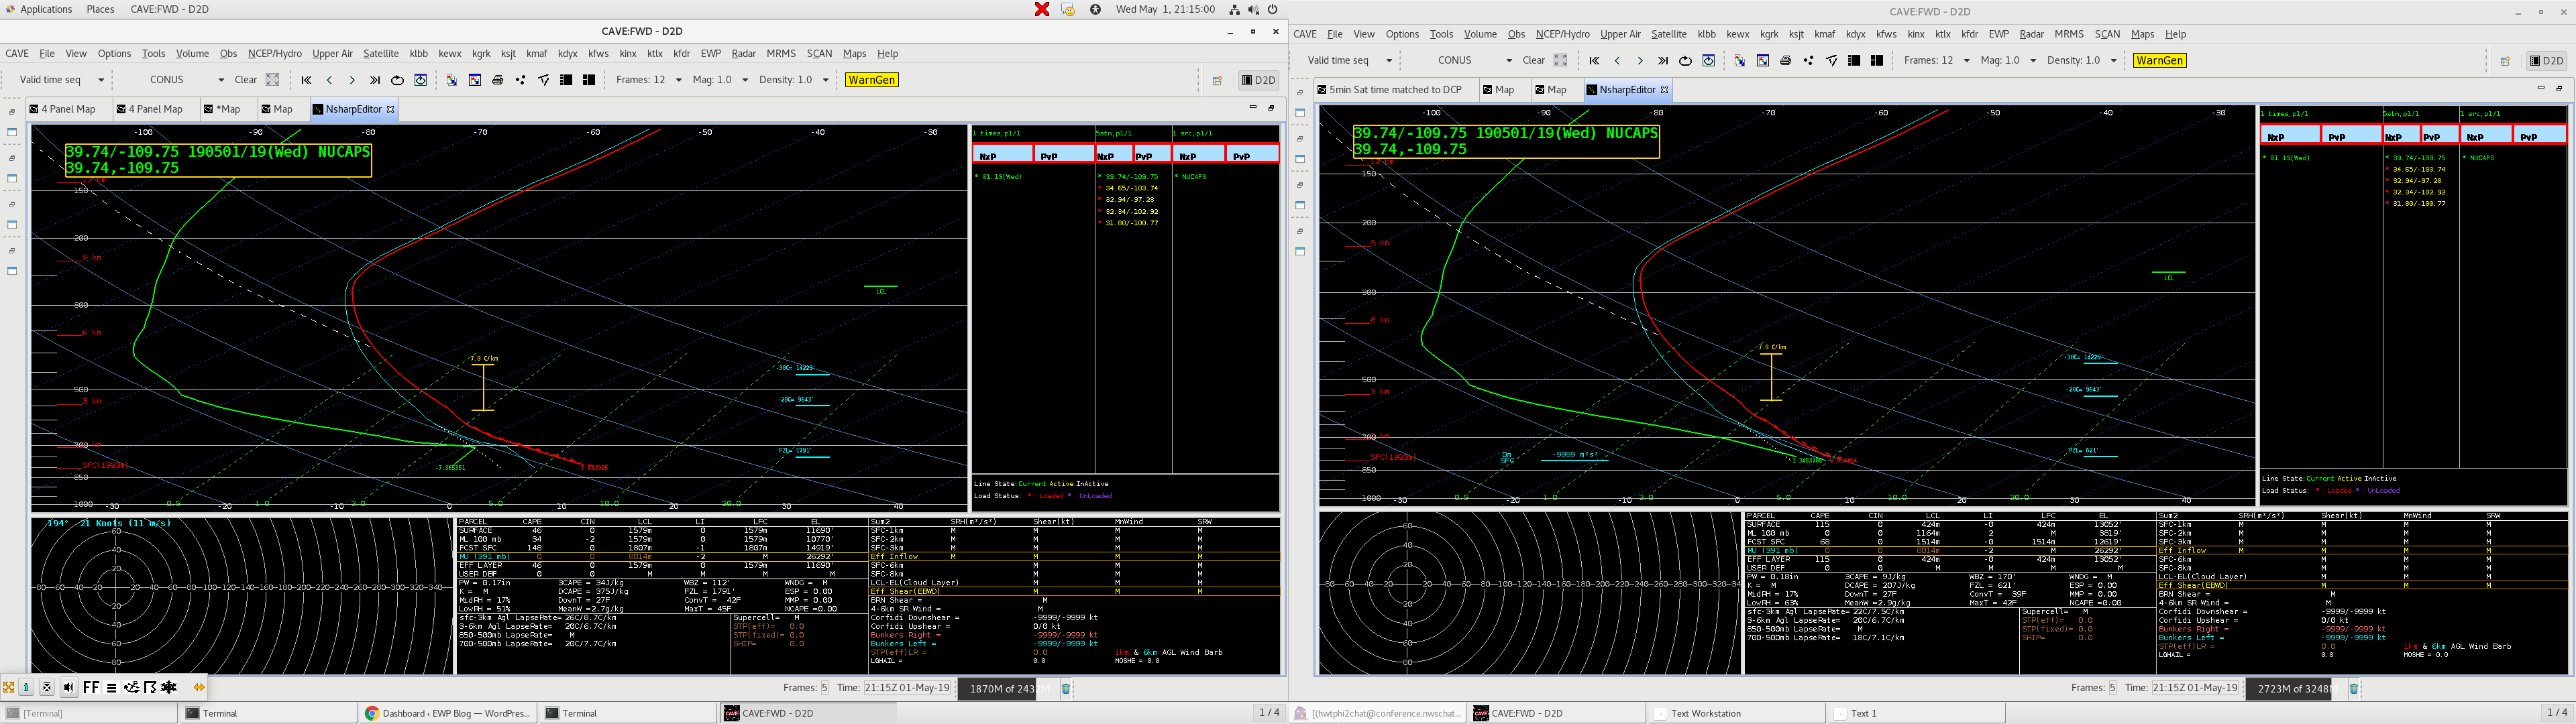 The example above was quite dramatic. This was an example over my home CWA. The modified sounding on the left captures the true mixing likely taking place over the point to the north of GJT airport, the right has a vastly different temp/td profile. This would have dramatic impacts for fire weather and smoke dispersal forecasting in remote areas, which is a critical task provided by our office.
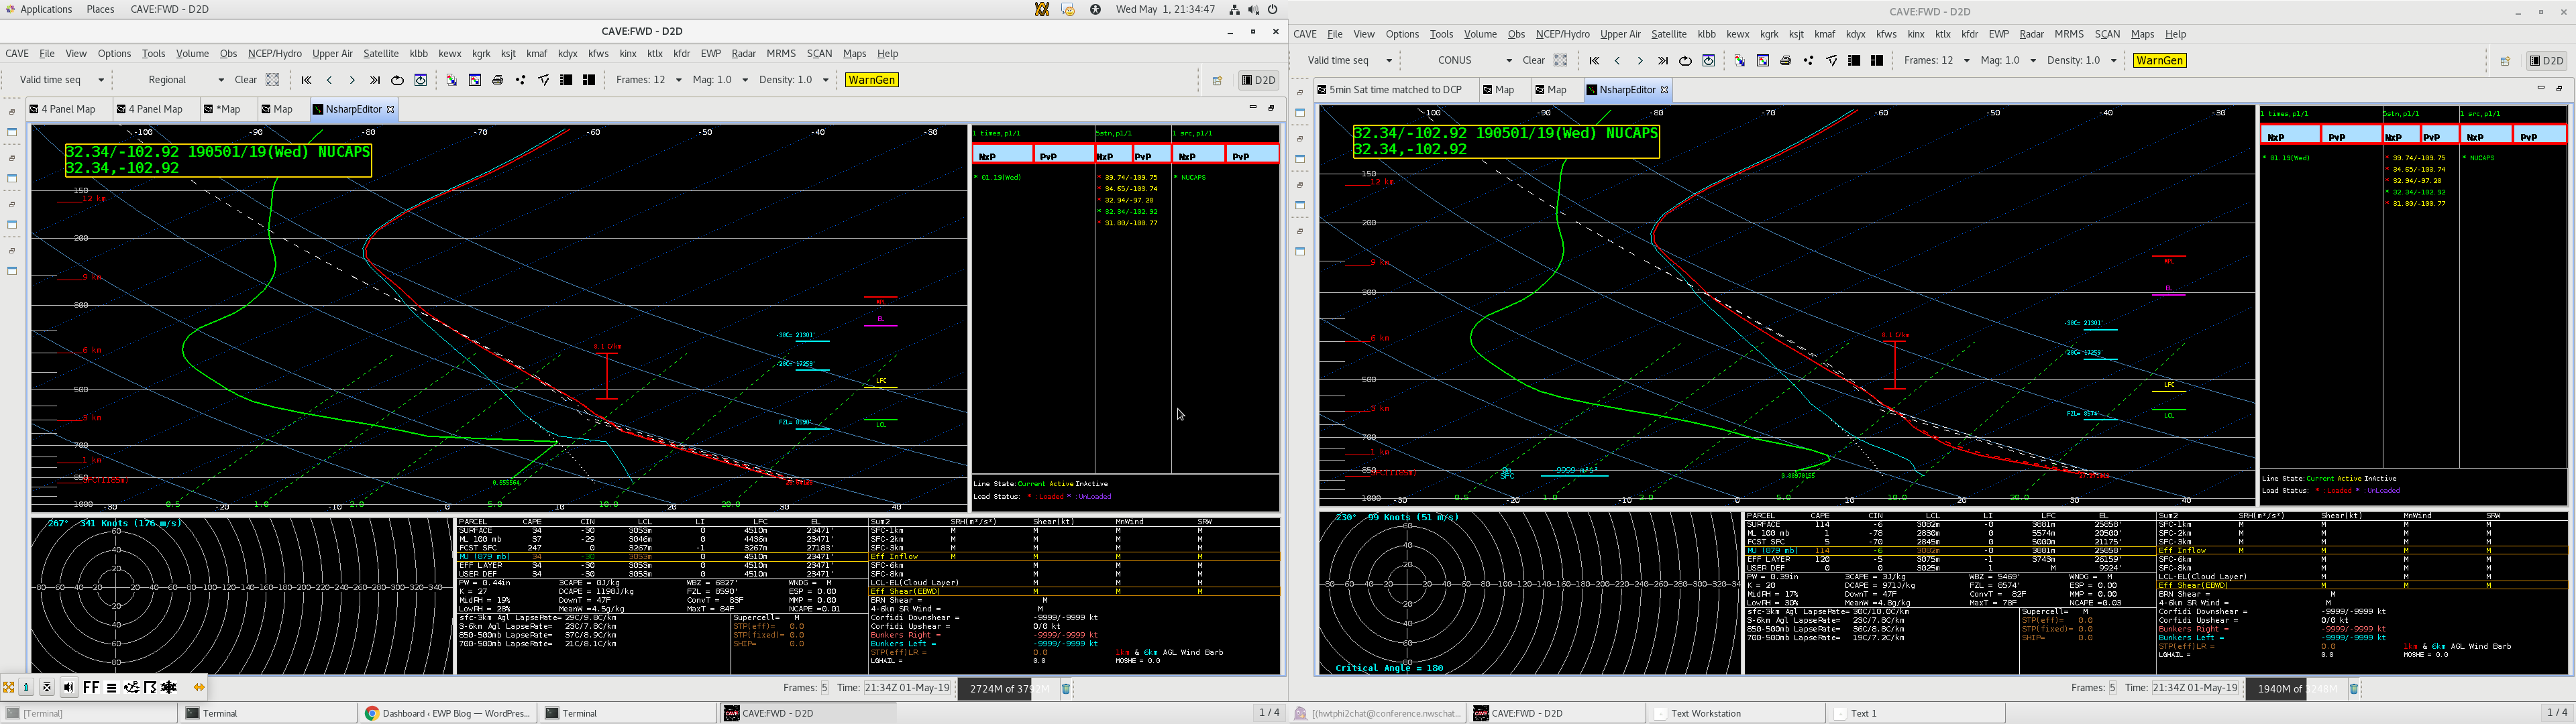
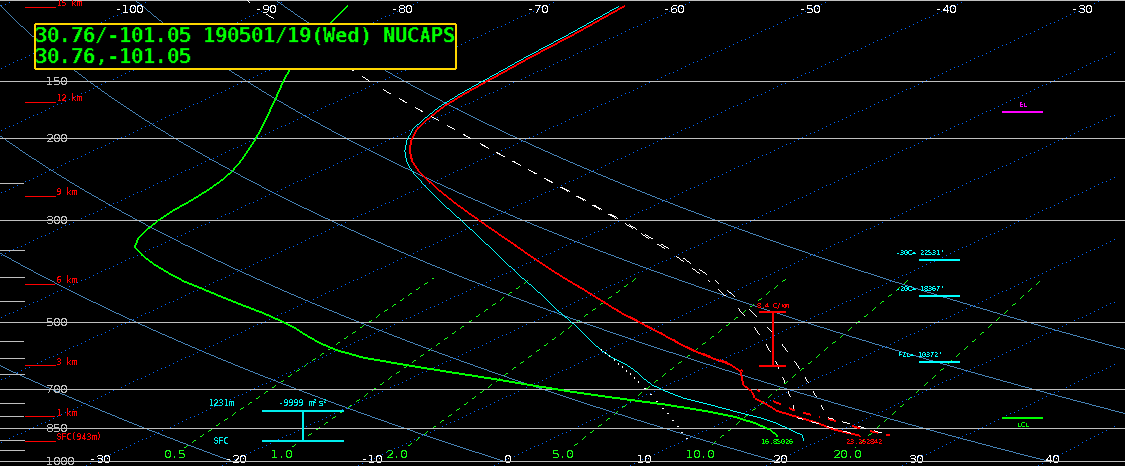
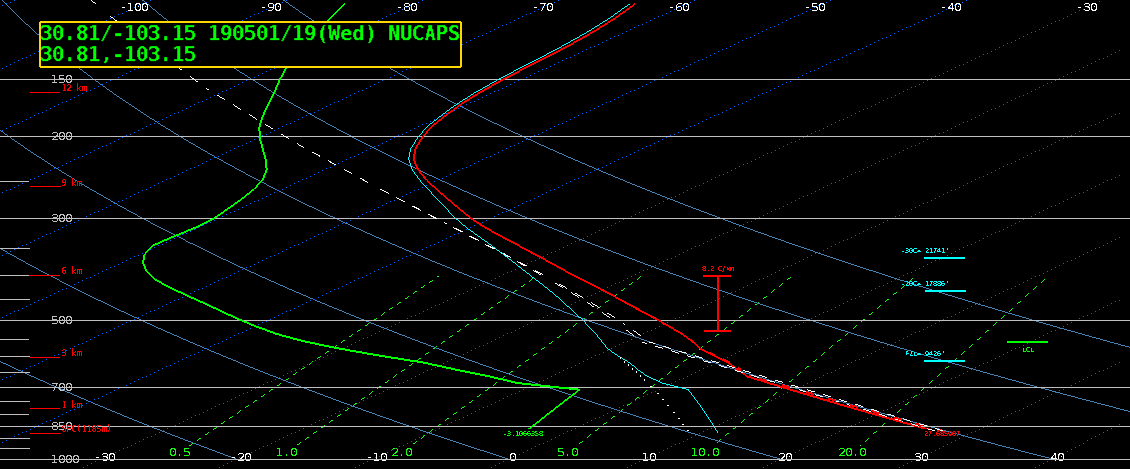
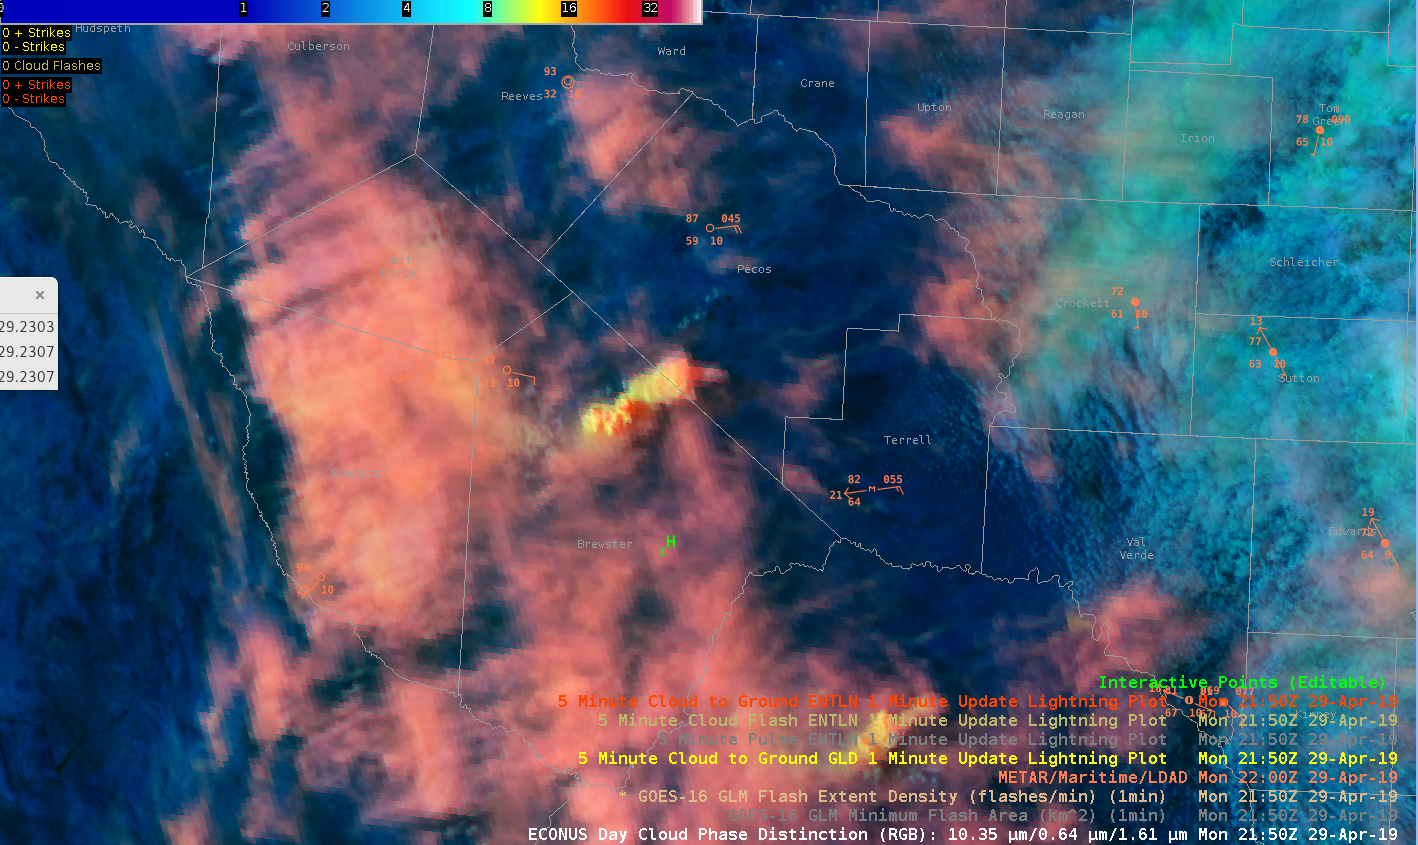
Moving south, the above example is well west of the dry line in New Mexico. Unmodified does capture a well mixed BL, but the modified shows this feature more pronounced. Clear skies were present throughout the entire day leading up to this point. 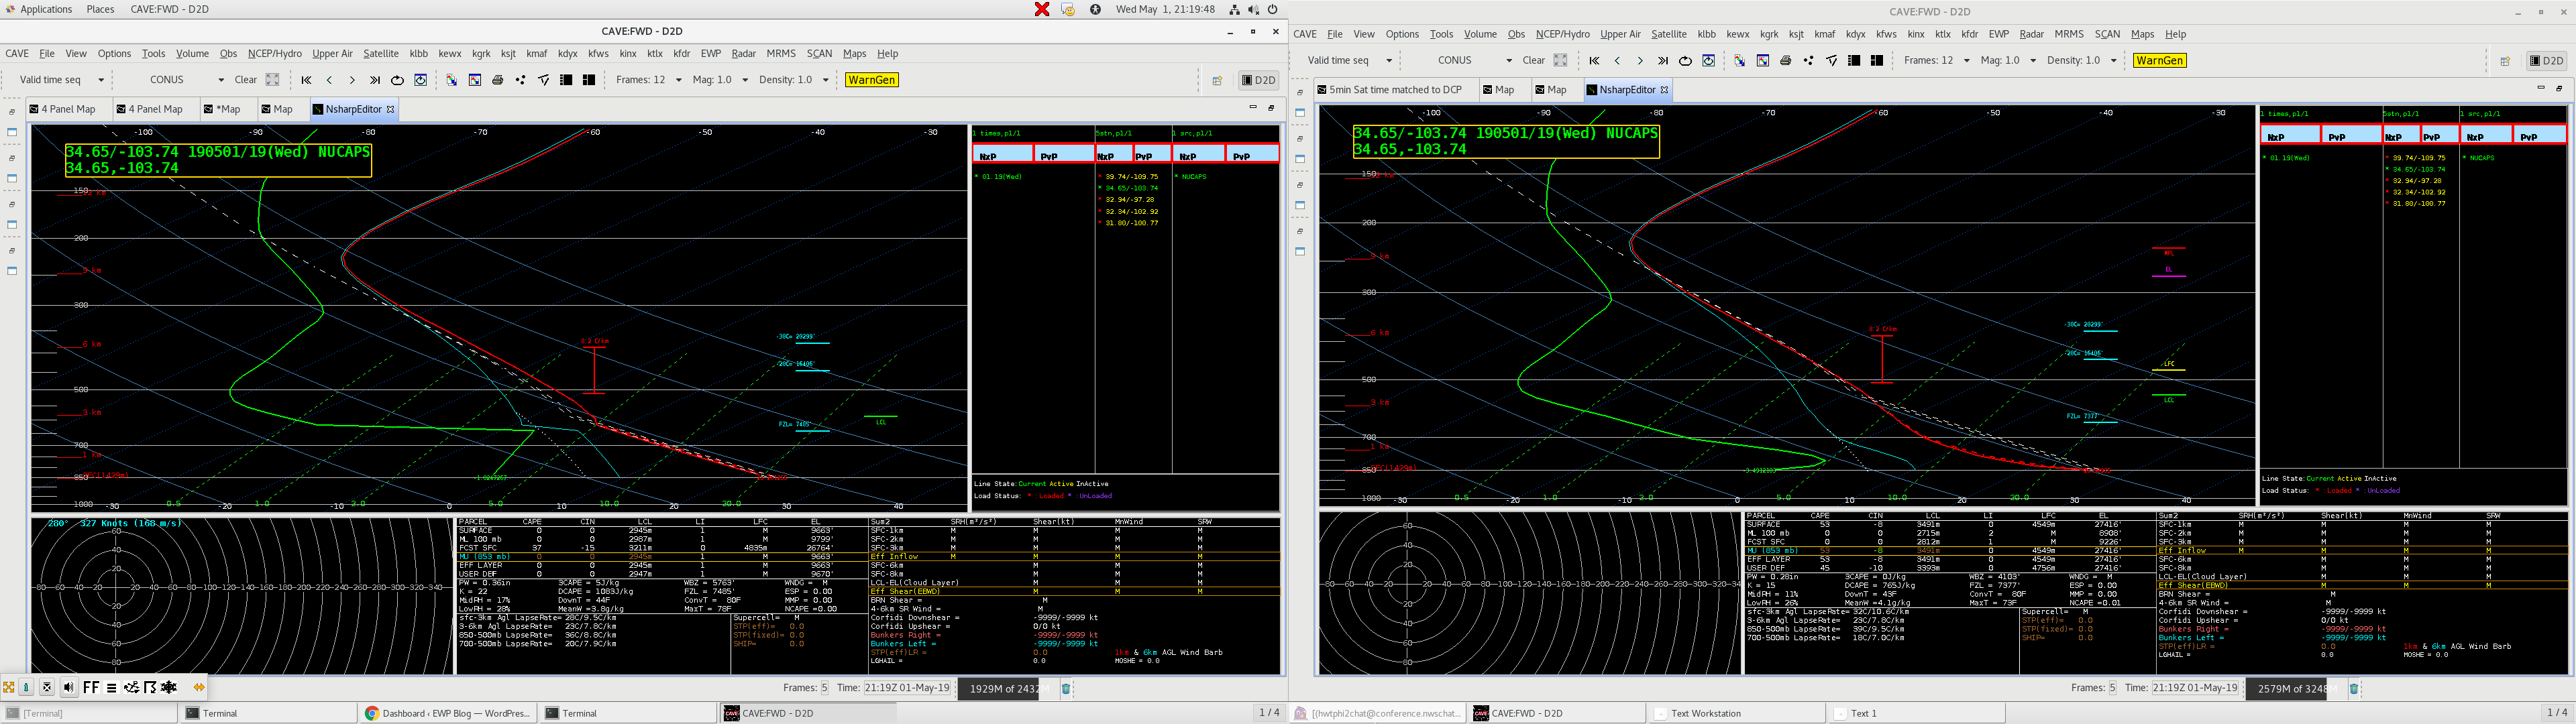
This sounding above was from just slightly west of the dryline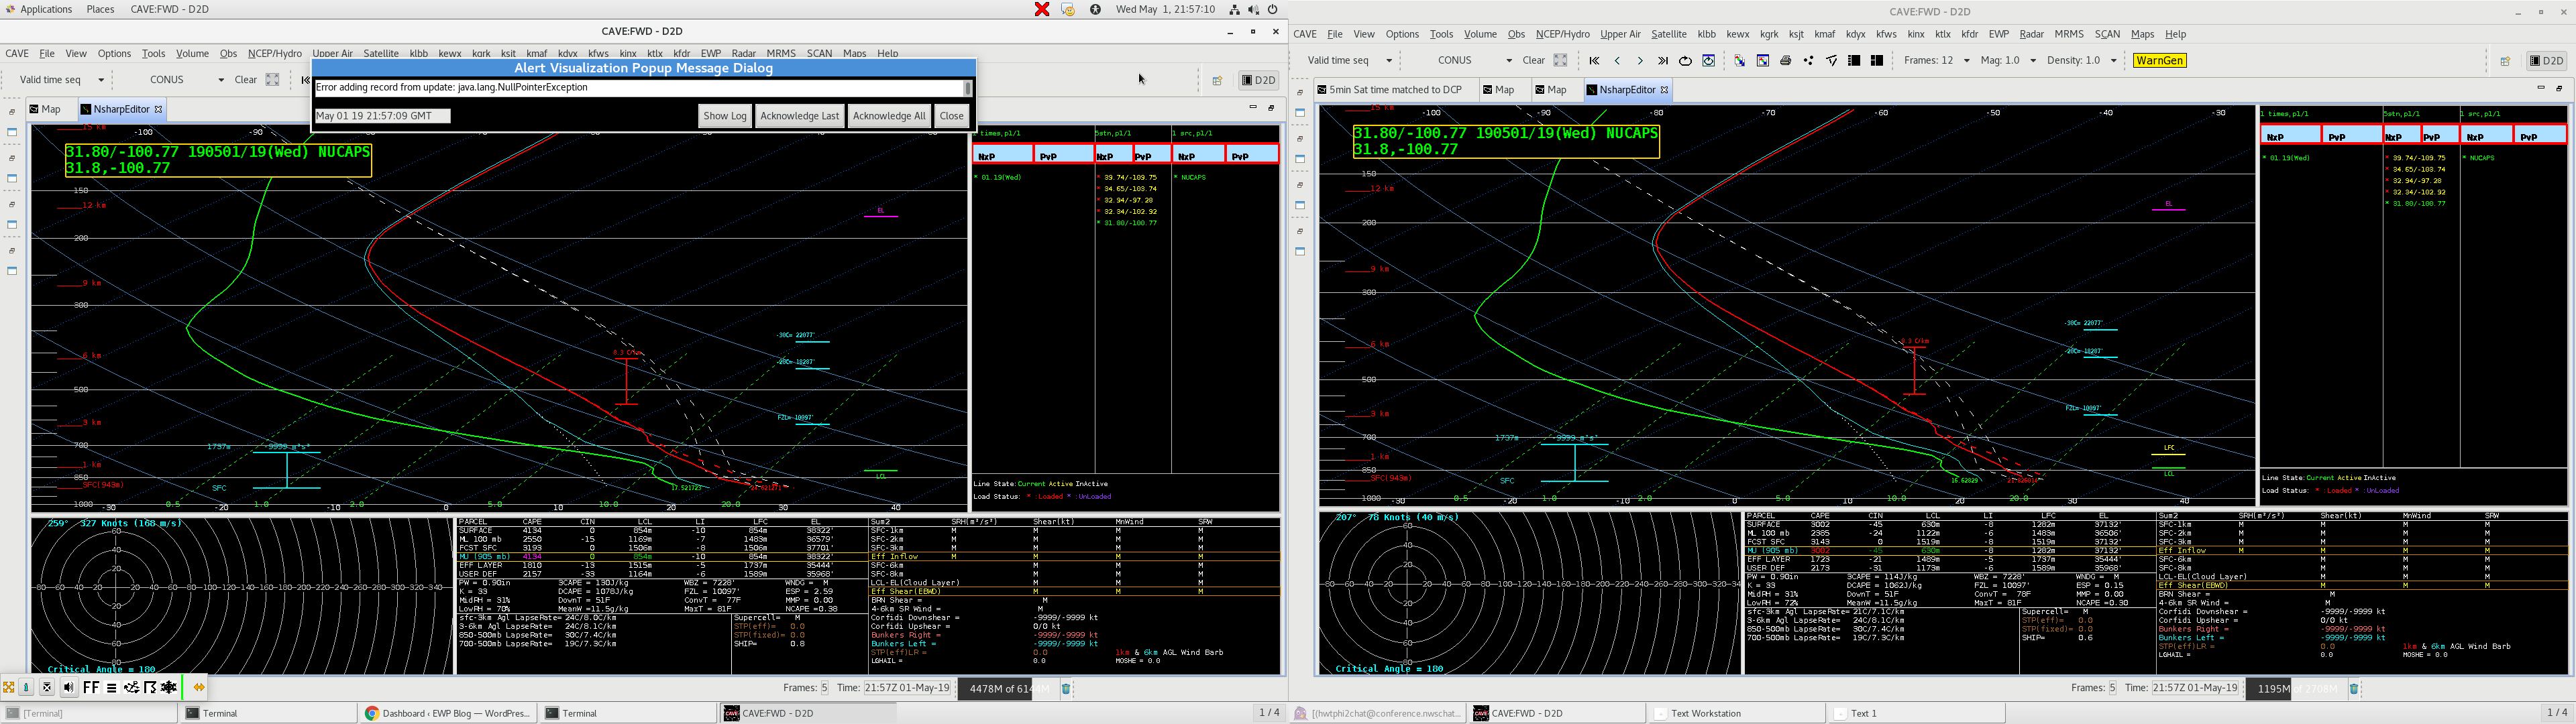
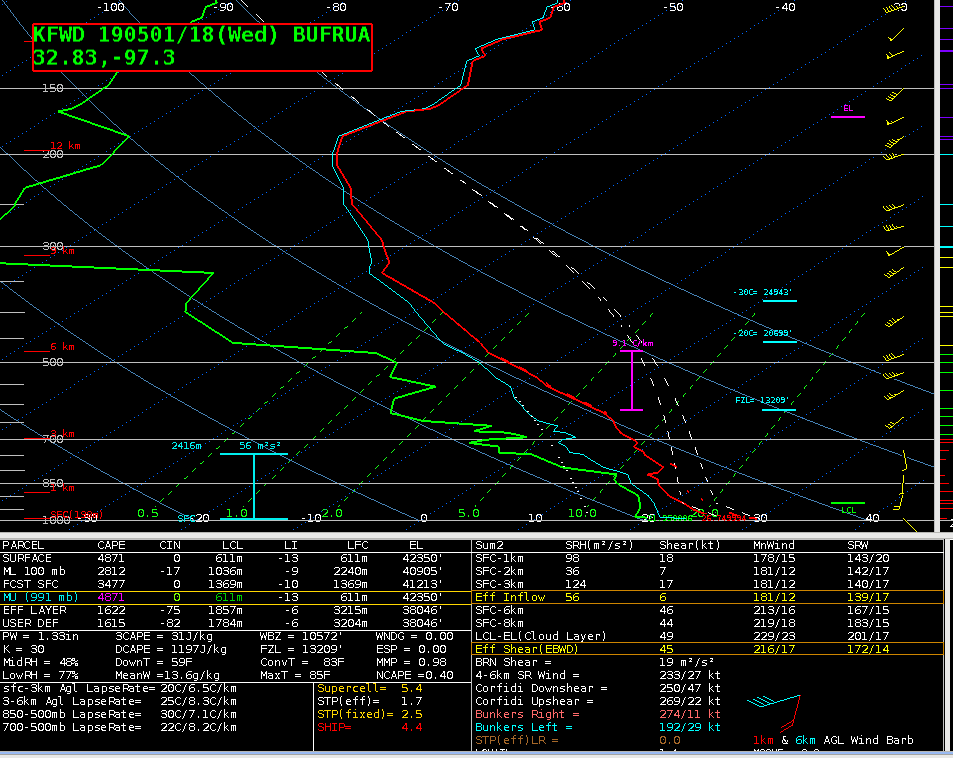
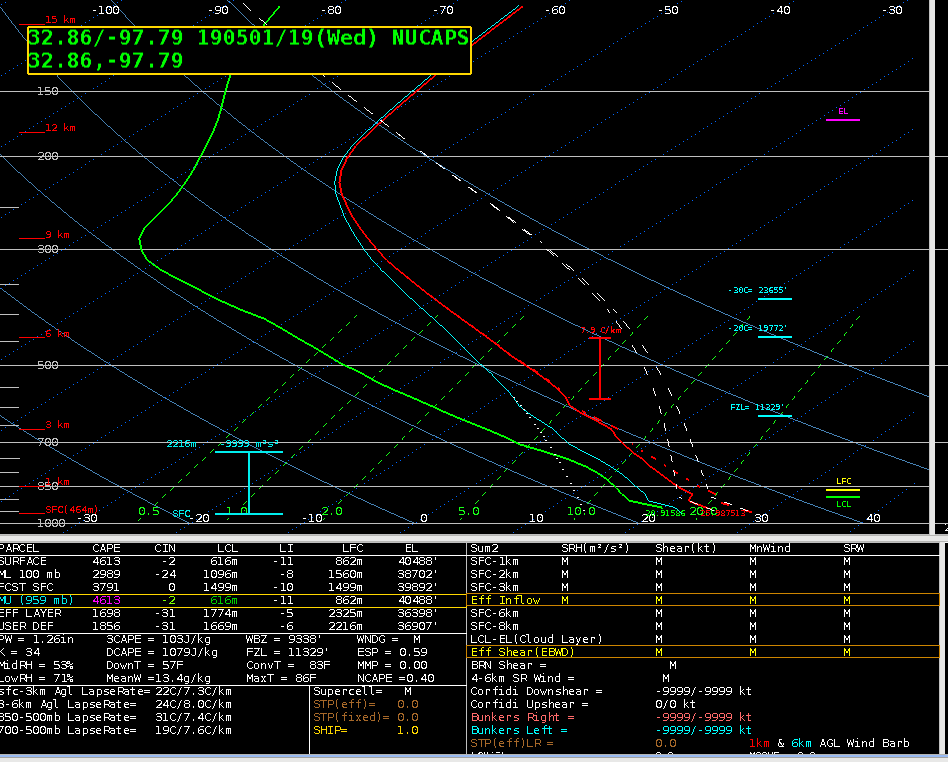
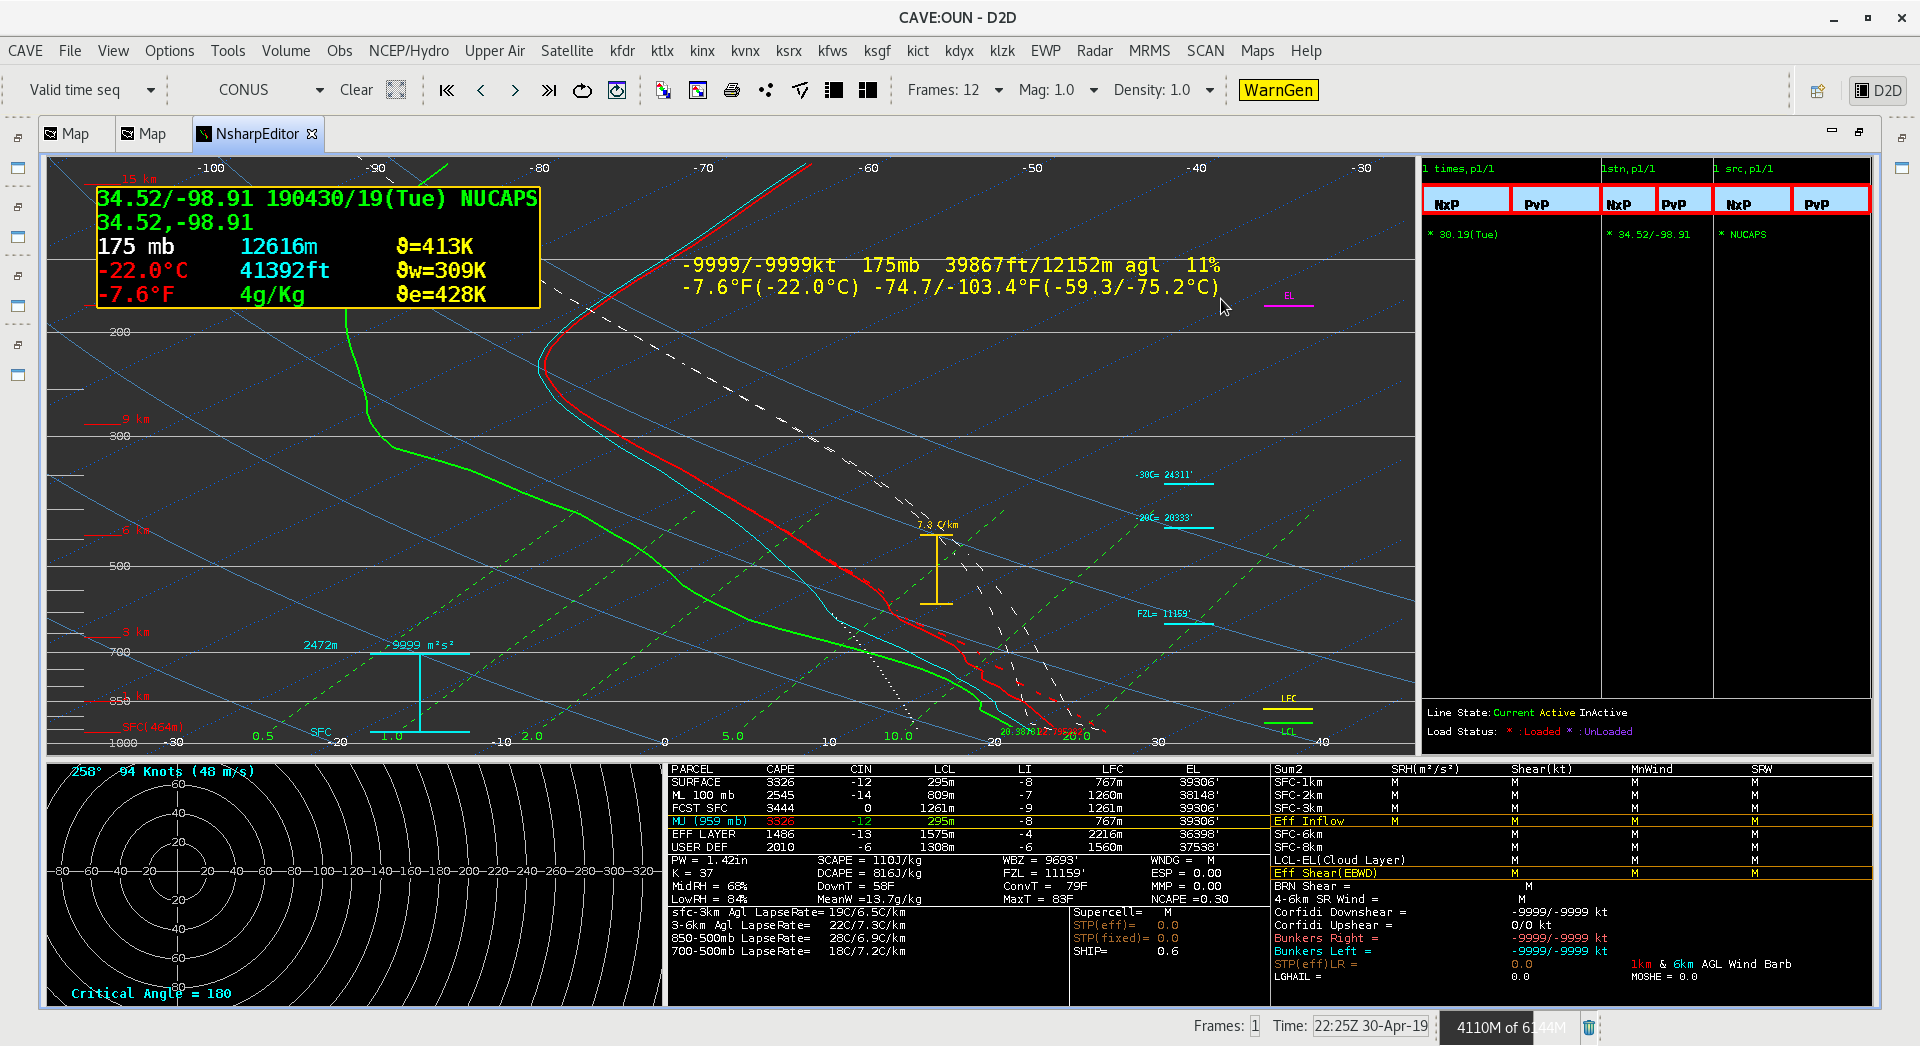
This sounding was a bit farther east, in the vicinity of increasing moisture east of the dry line. 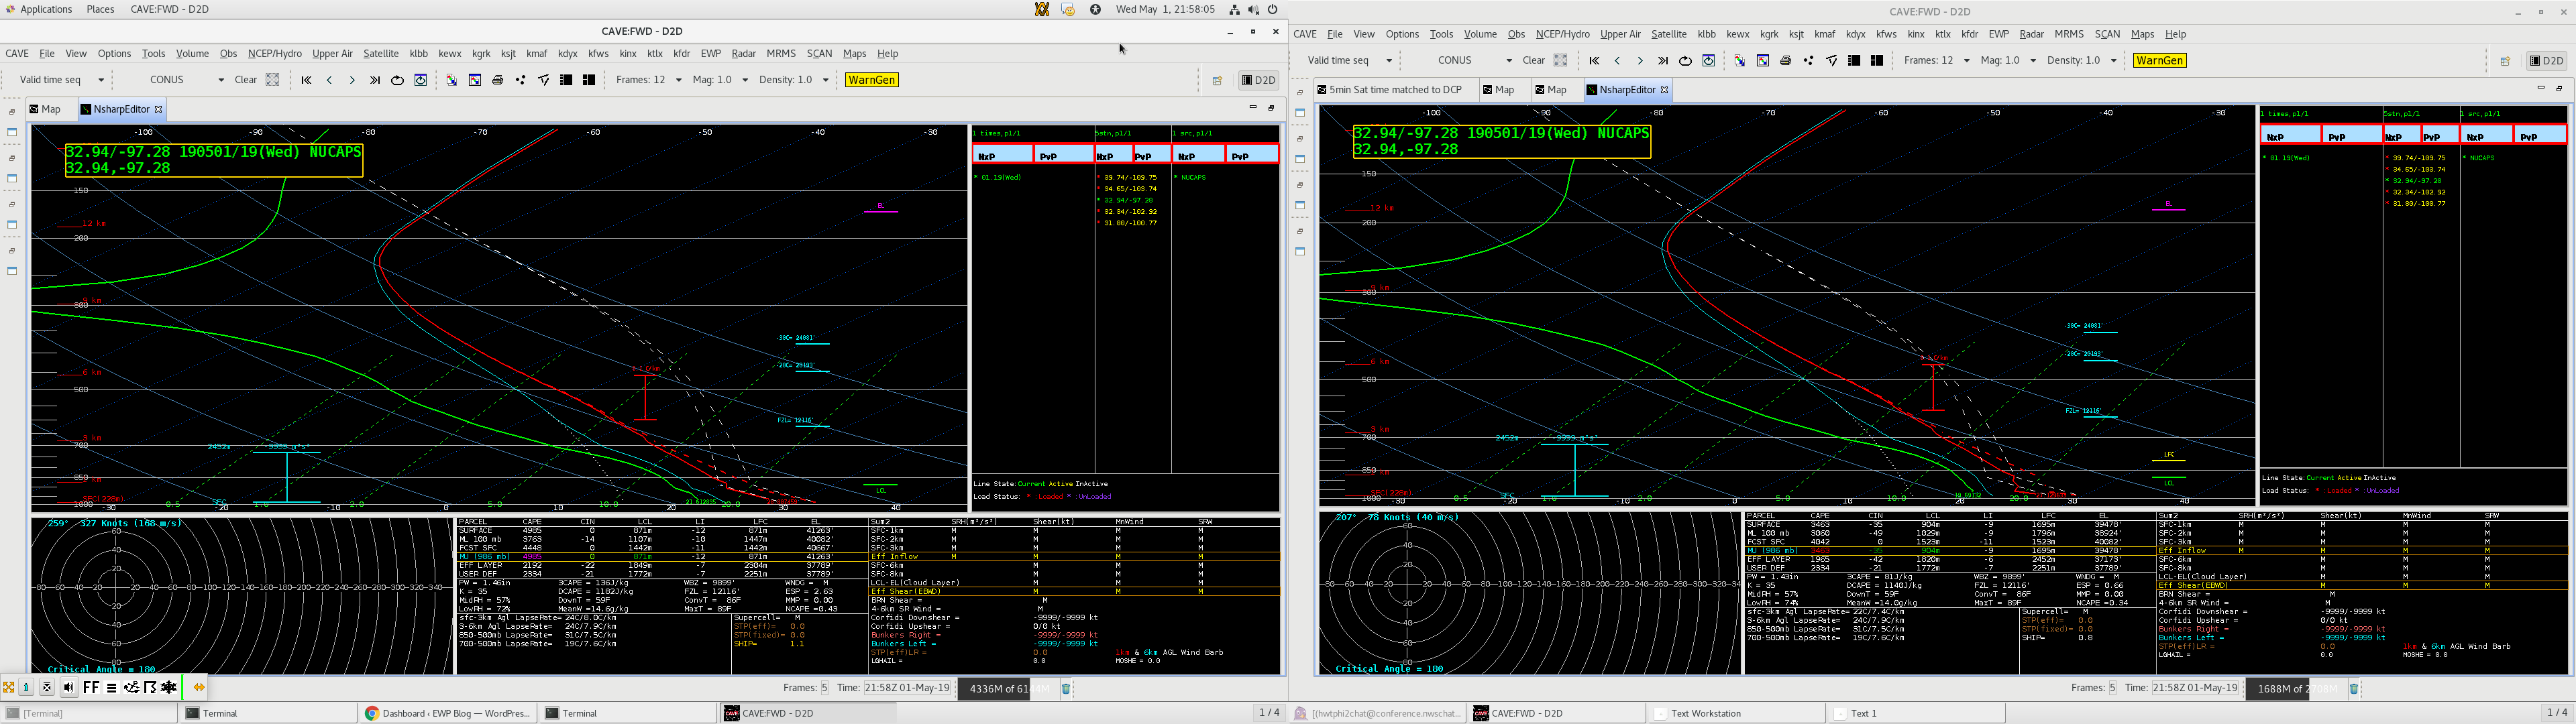 Finally this sounding was from well east of the dry line in the vicinity of intense thunderstorm development. Note the odd structure in the lower levels in the unmodified sounding on the left, these strange temp readings are eliminated in the modified sounding which greatly changes the CAPE values and other parameters.
-Dusty Davis


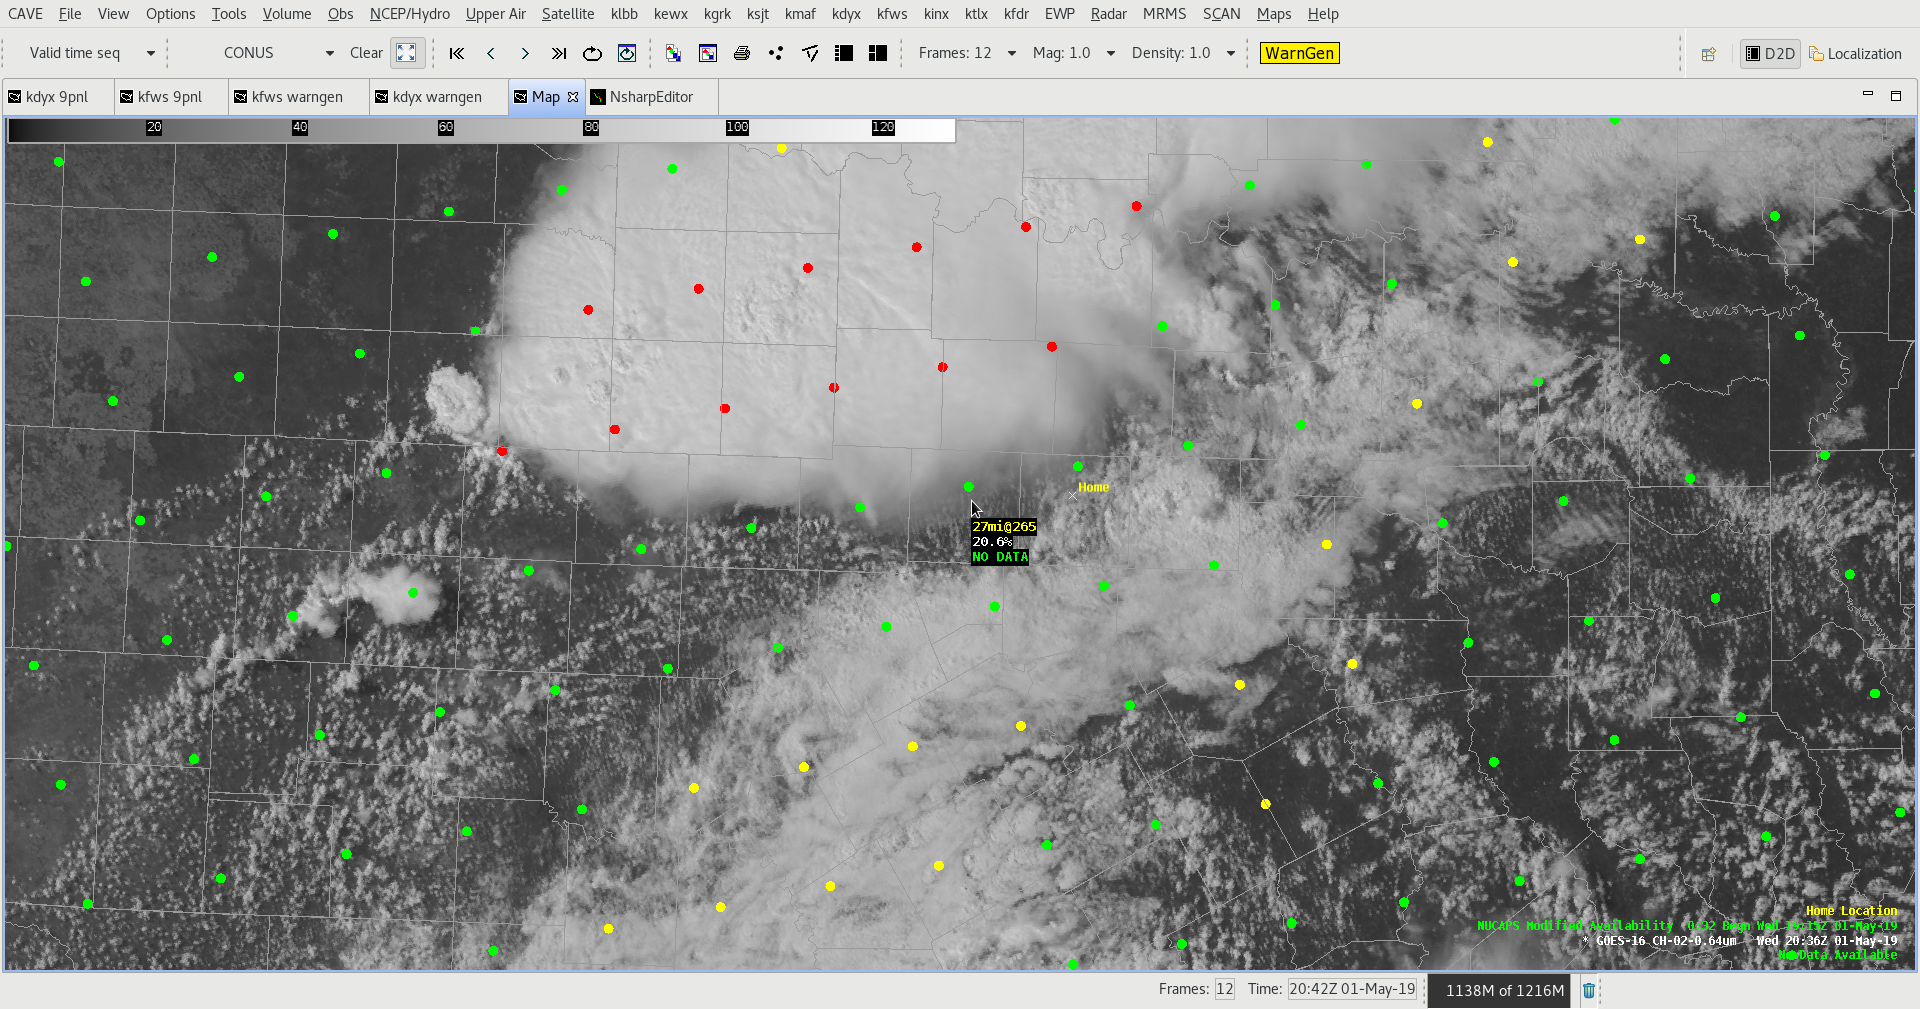
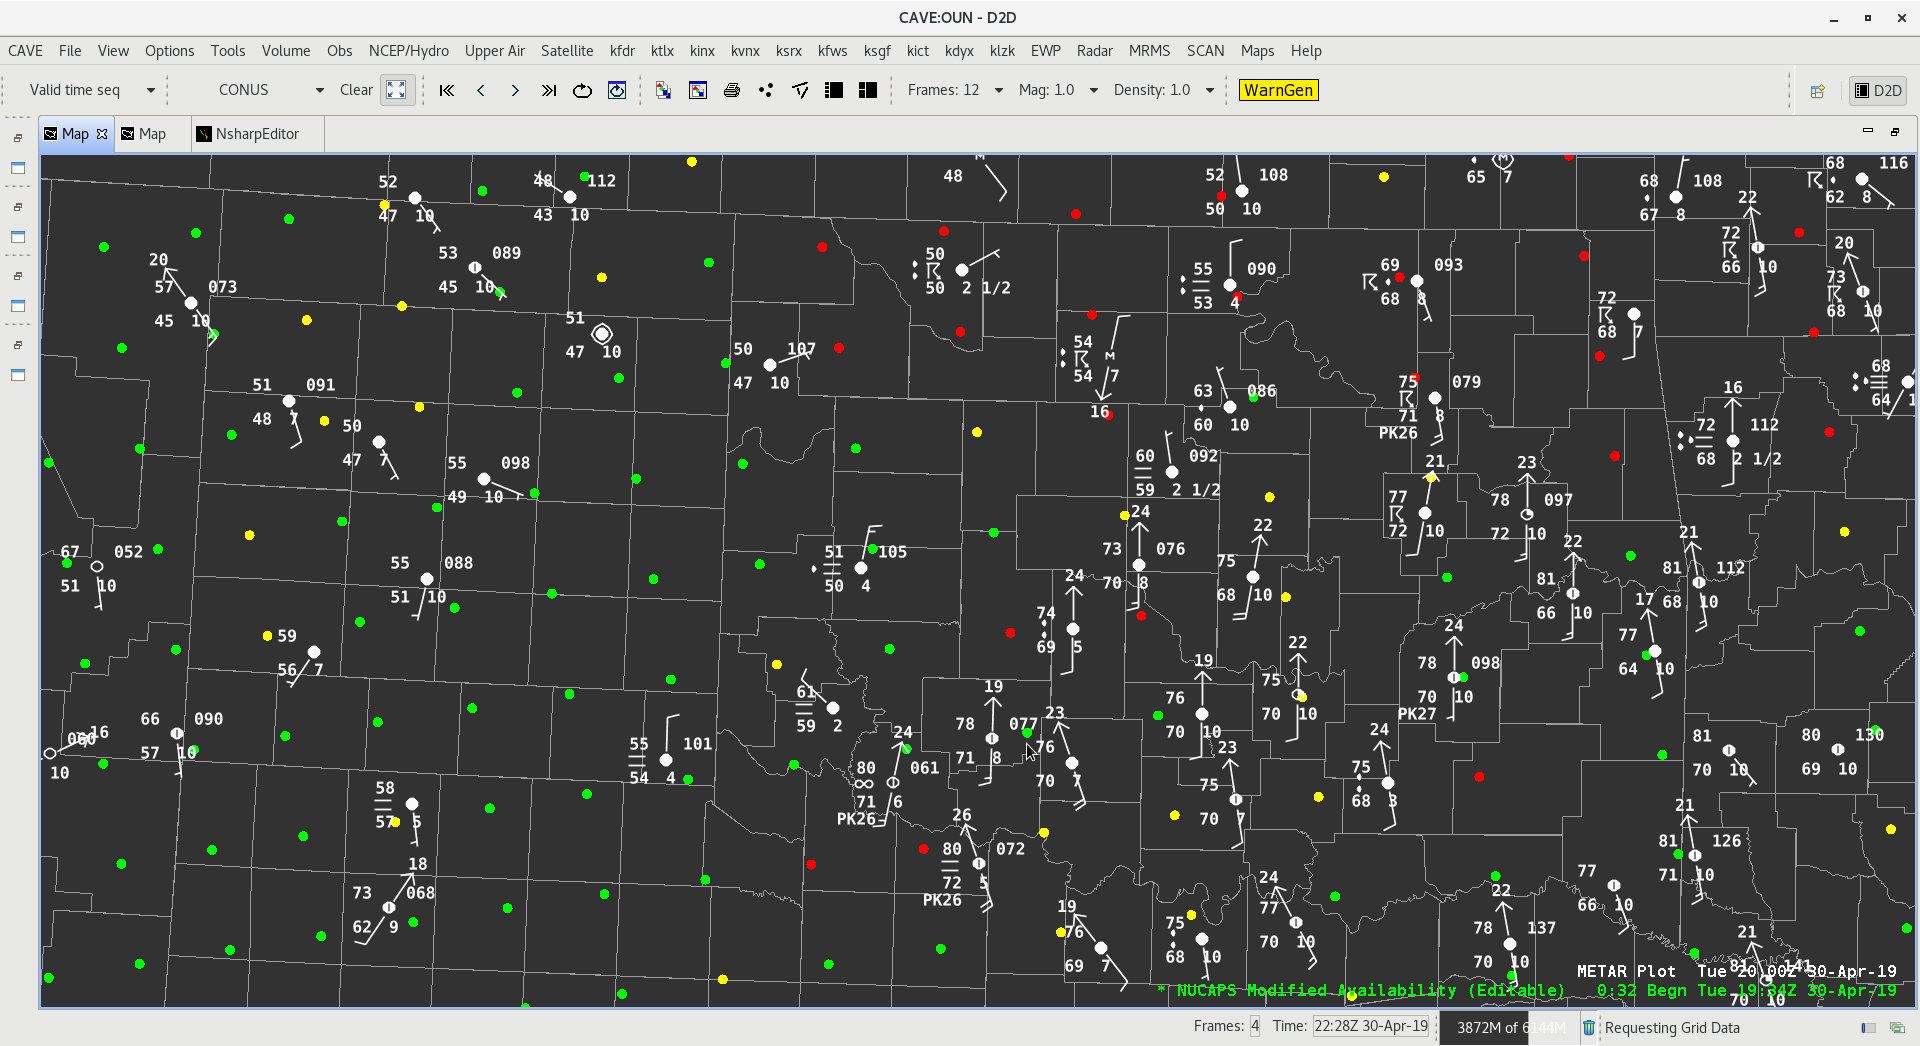
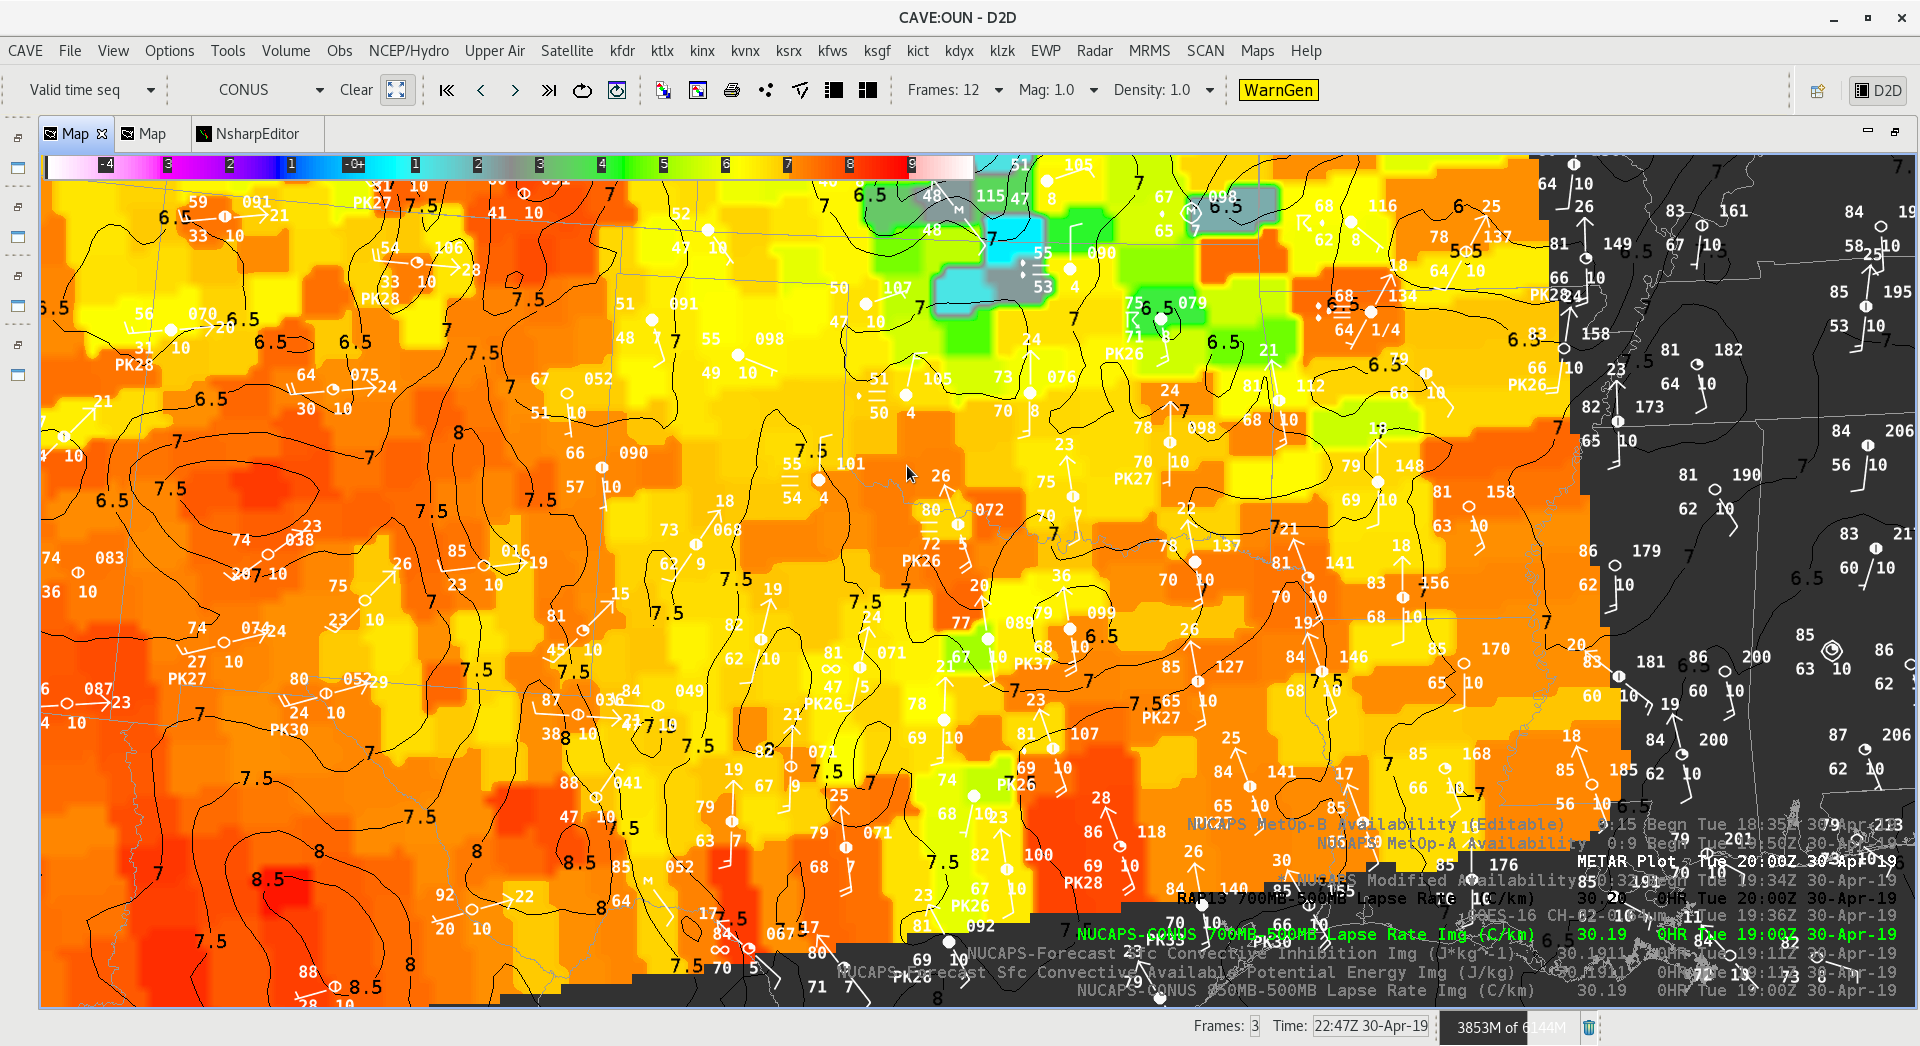
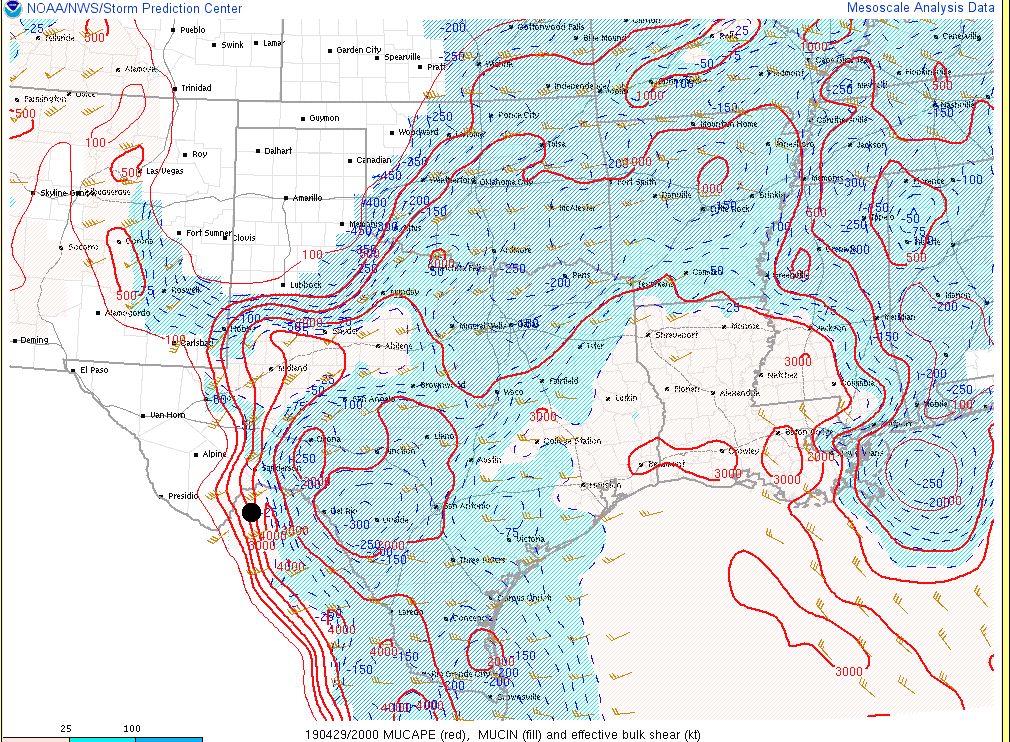
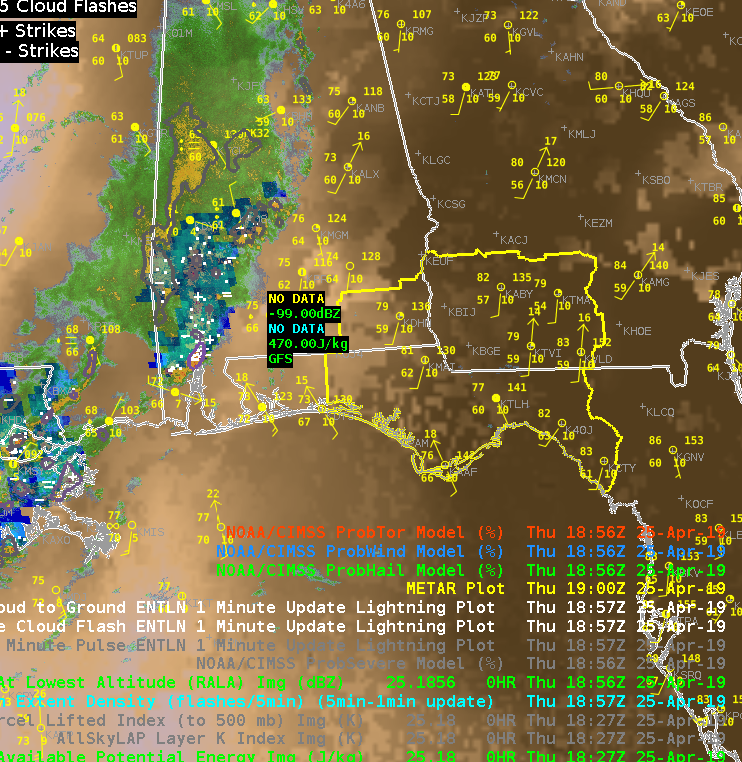 An 8 hour loop shows how the instability has built and gives more confidence that instability will continue to build ahead of the storms to our west.
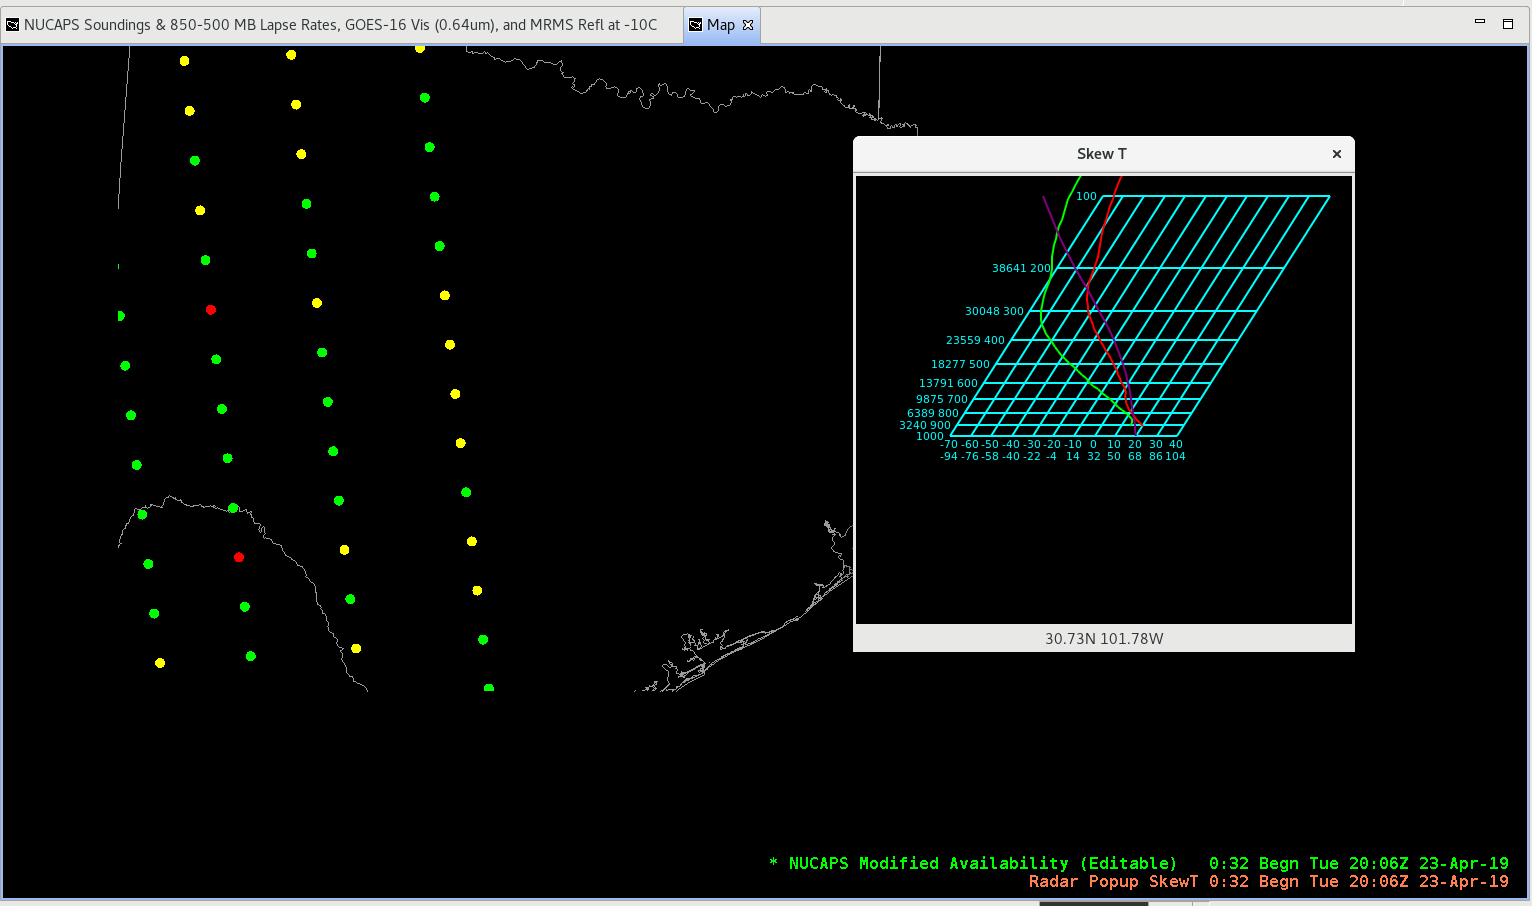
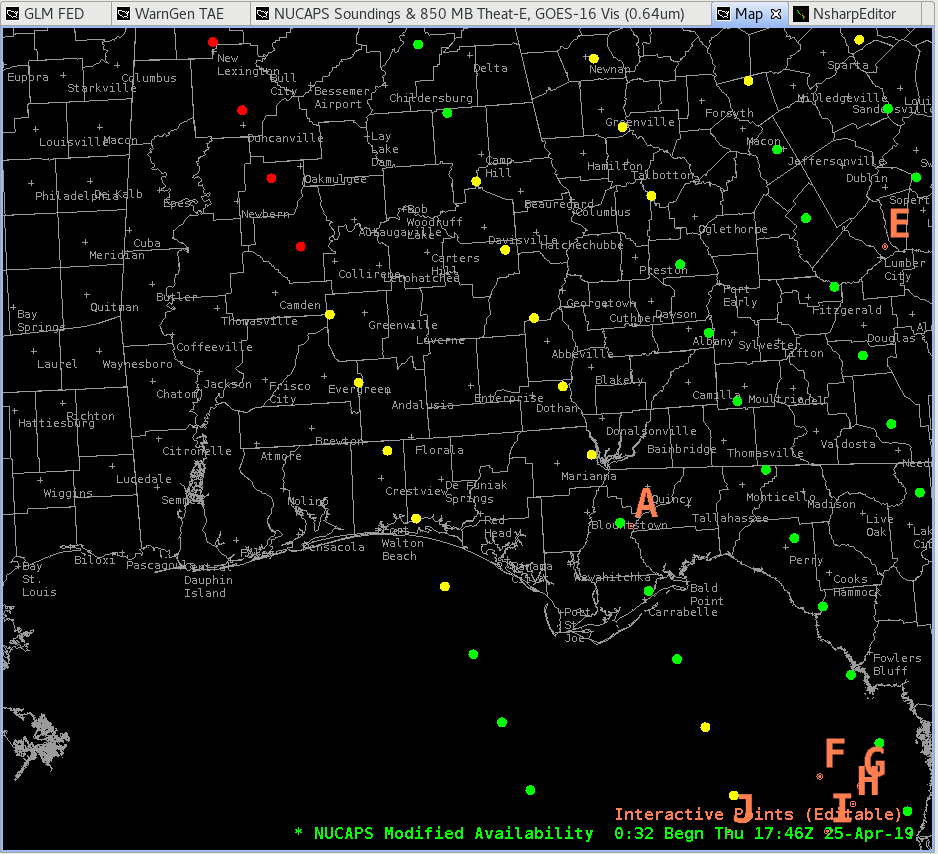
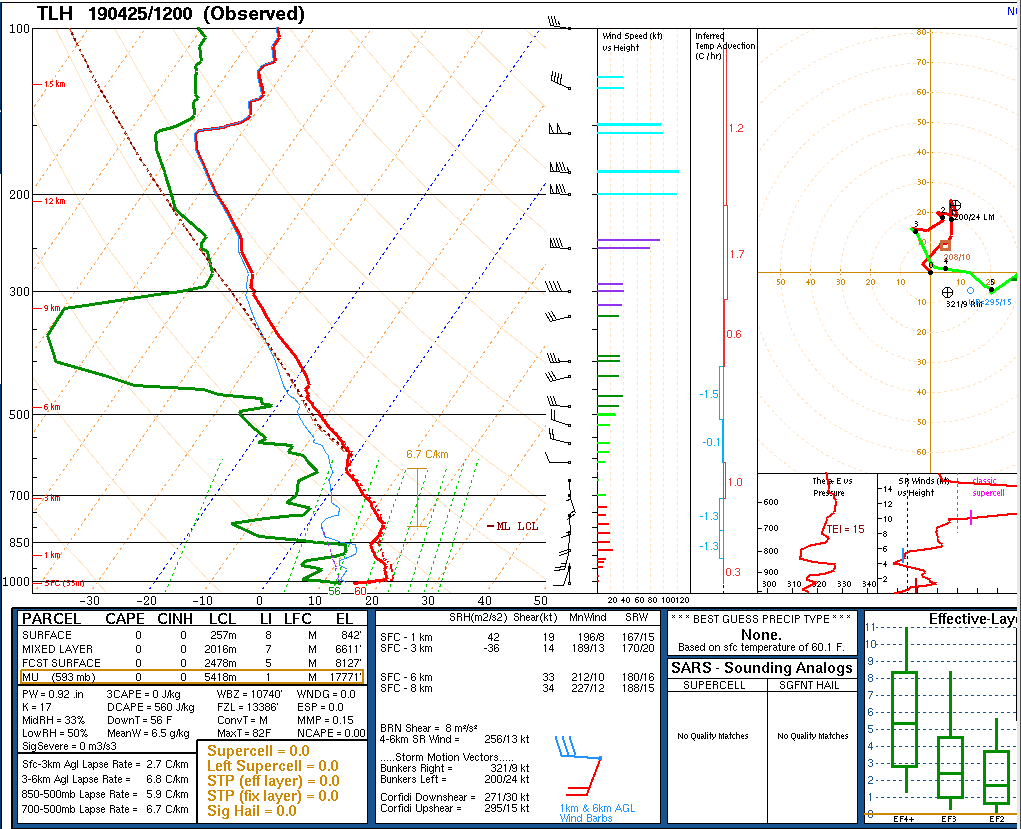
  We did feel that LAPS CAPE seemed a bit underdone given the intensity of the downstream of the convection, so we took a look at the latest NUCAPS retrievals. We examined the point in the extreme SE of our CWA.
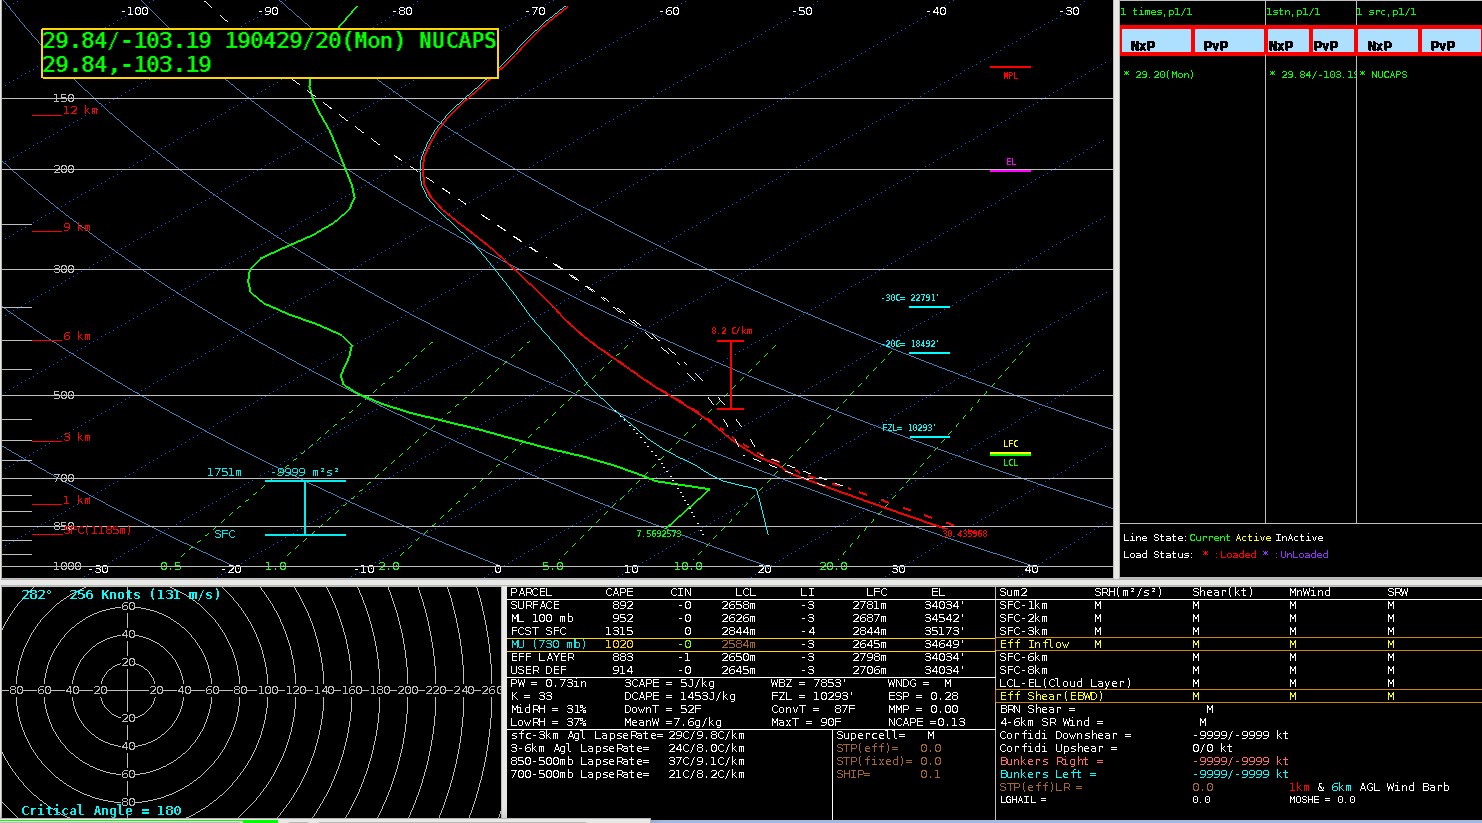
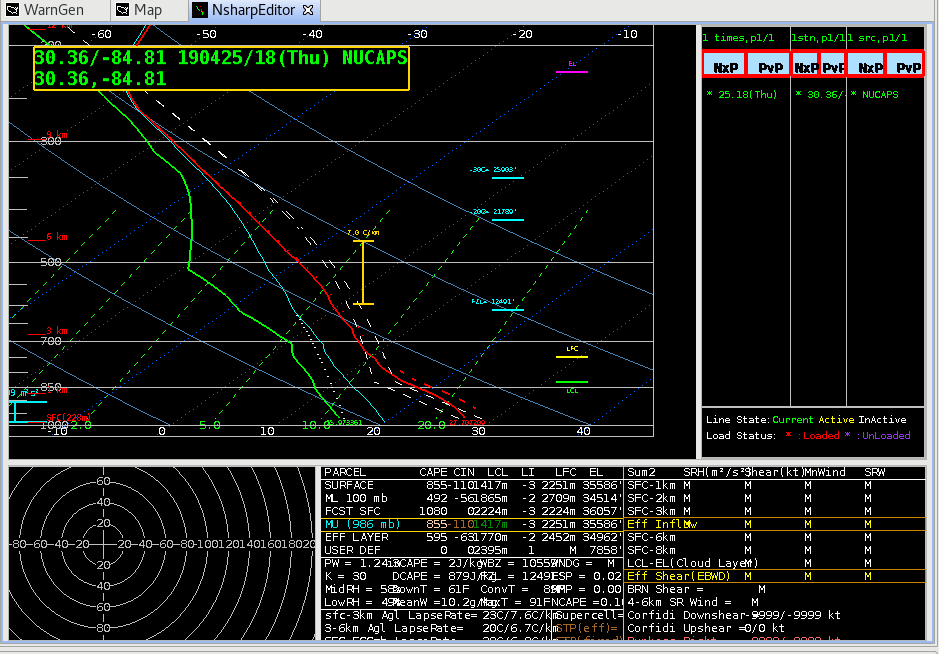
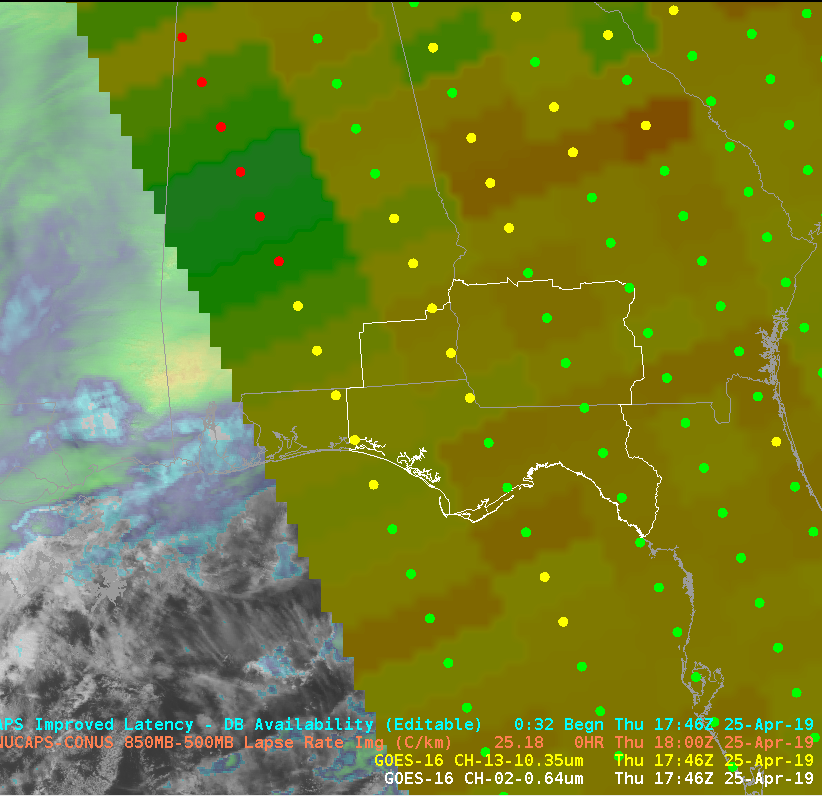 The boundary layer on the unadjusted sounding required some adjustment to match the nearest obs, but overall, seemed to capture the general profile well. I was initially skeptical about the warm nose just above 700mb, but a similar feature was evident on the 12z sounding from TAE. This feature may have an impact on storm intensity and potential hazards, and it would be particularly helpful to see how this feature changes over time.
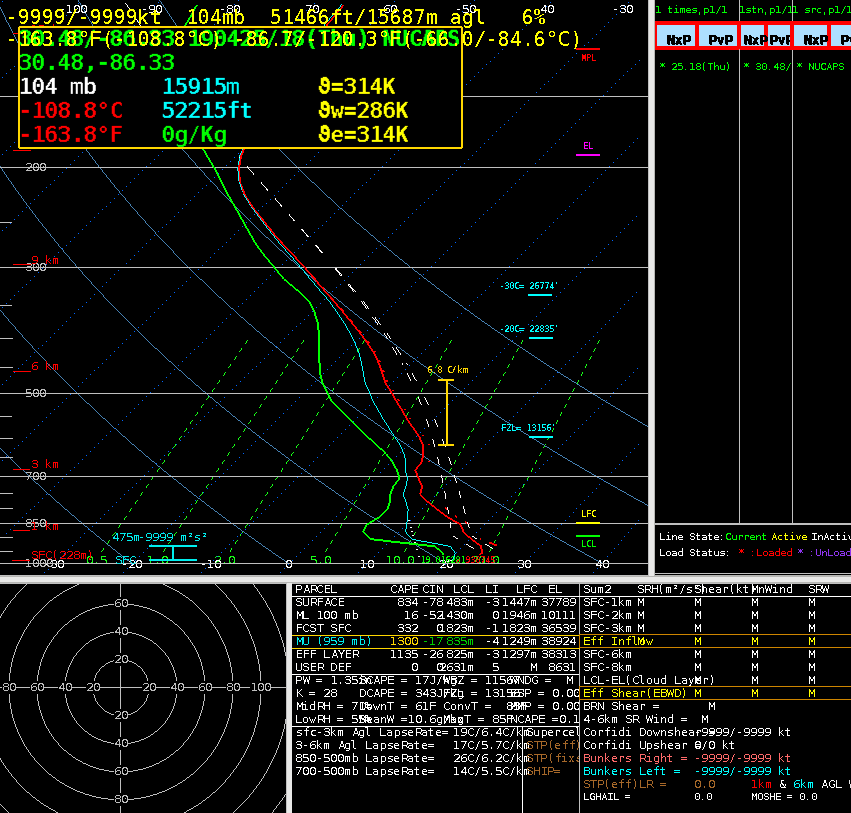
 Sandor Clegane
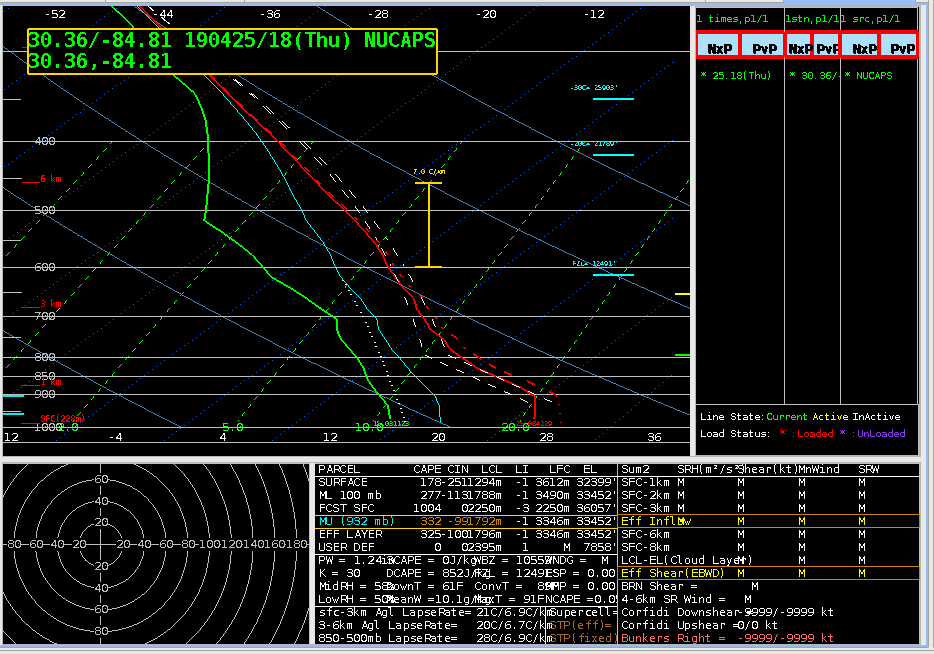
 All Sky LAPS retrievals indicate ML CAPE just shy of 1000 J/kg, but with this environment, I would expect instability to be higher.
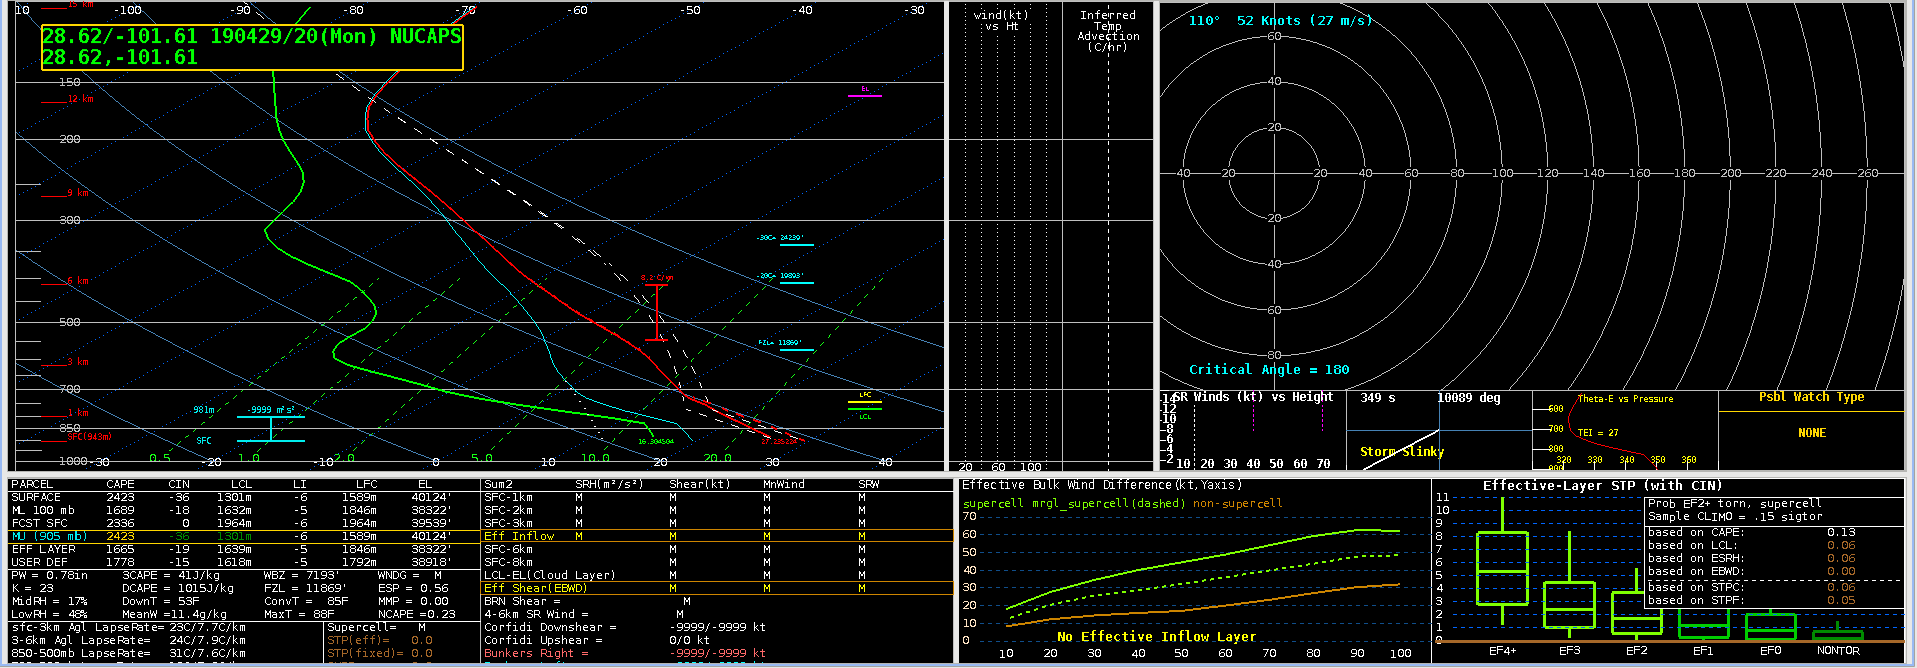
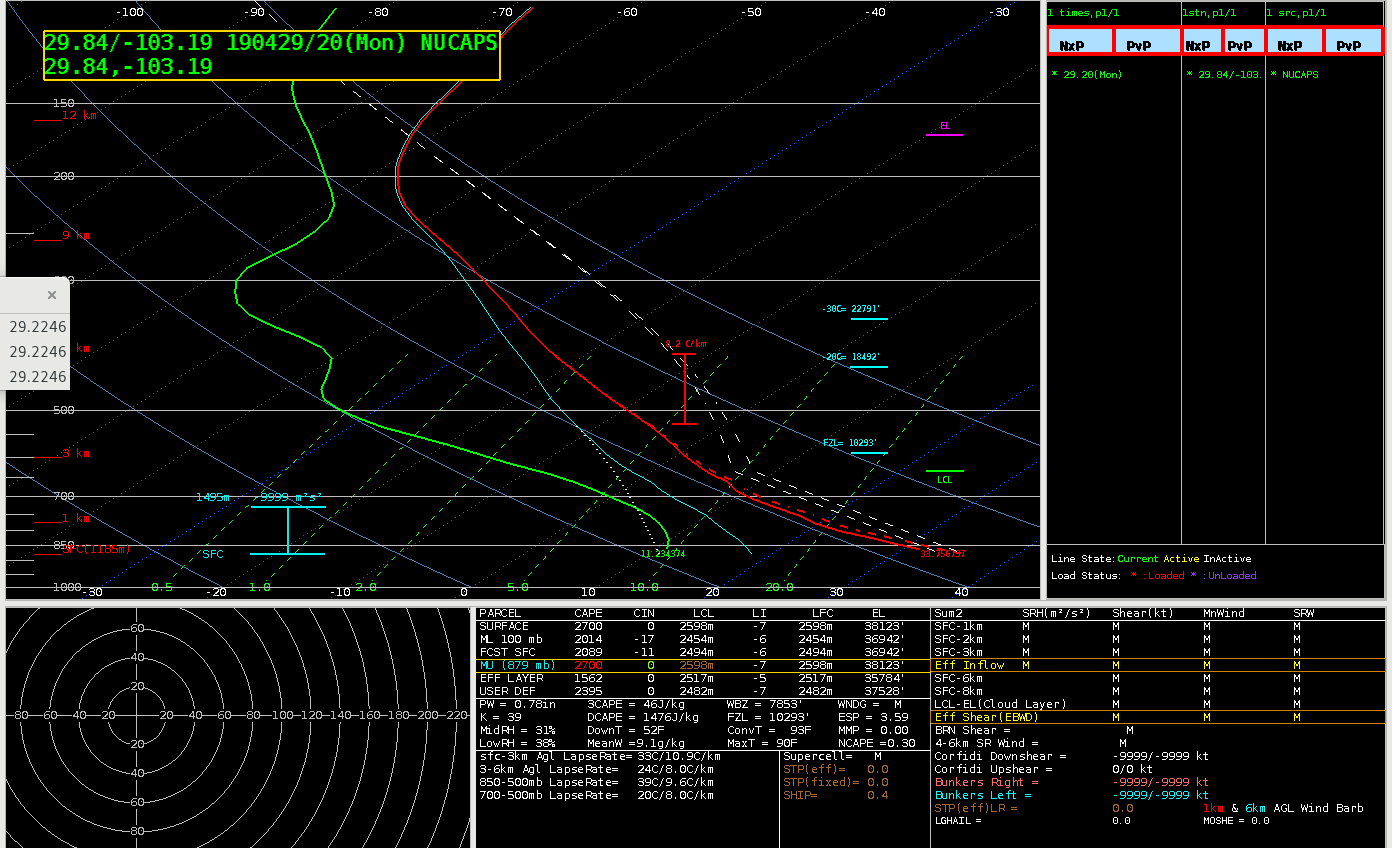
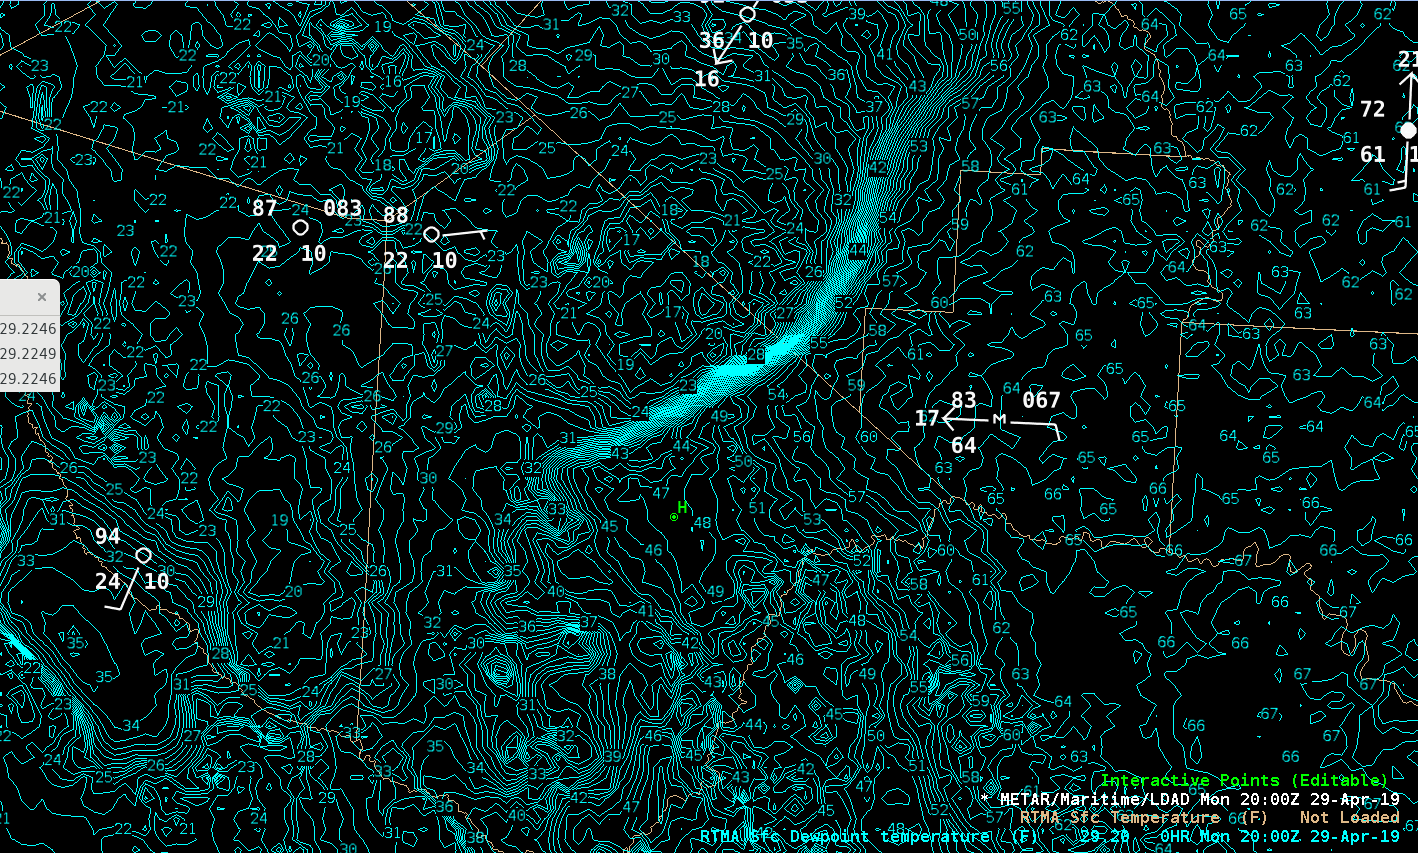
 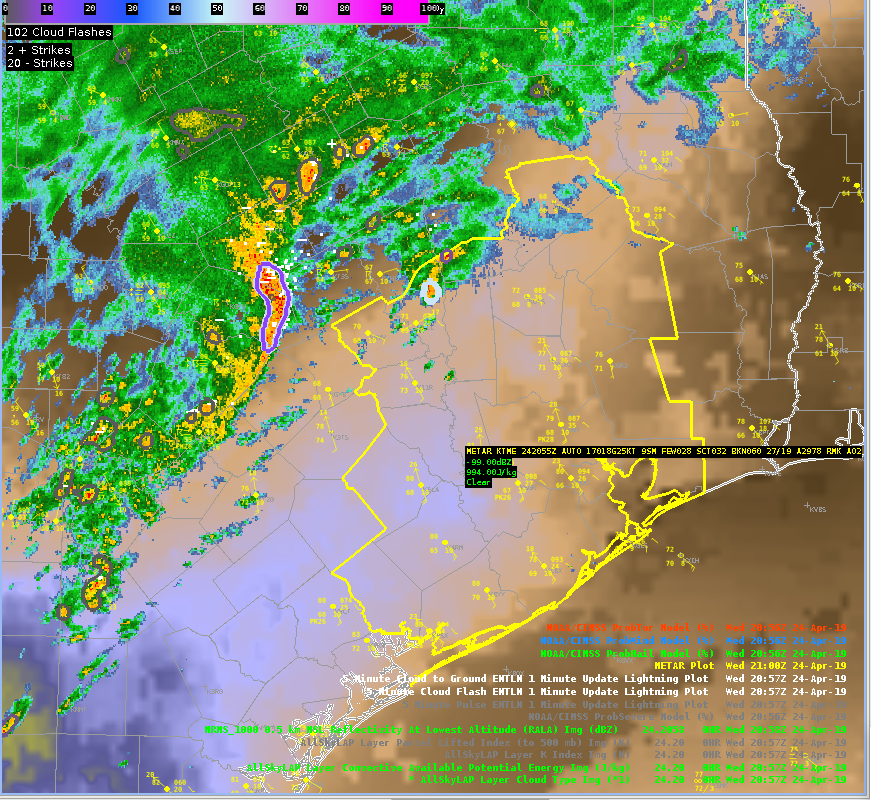 The modified NUCAPS shows a profile more in line with what I would expect to see. In this profile, the surface dew points were close to what surface obs show, but the surface temp did need to be adjusted up a bit. This sounding, coupled with analyzed deep layer shear, leads me to think severe weather is a possibility in this area.
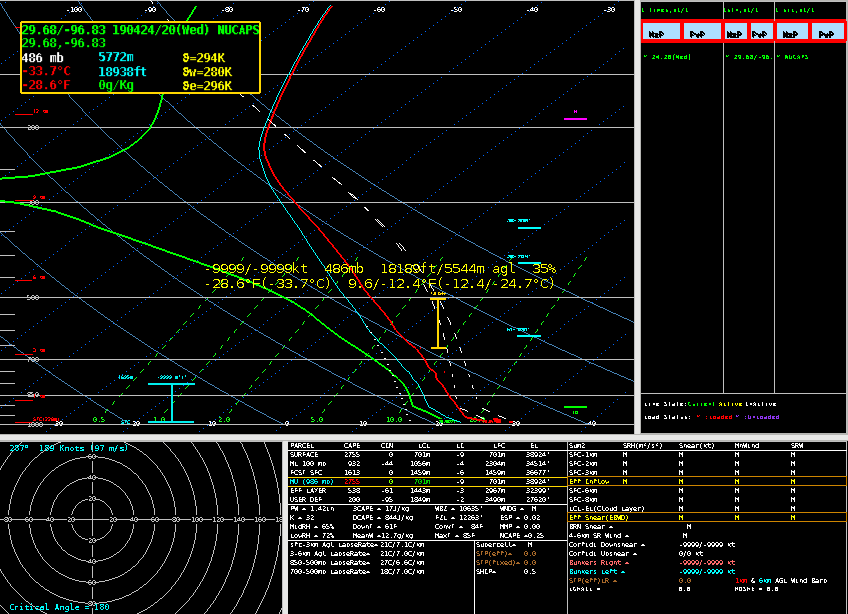 Sandor Clegane