
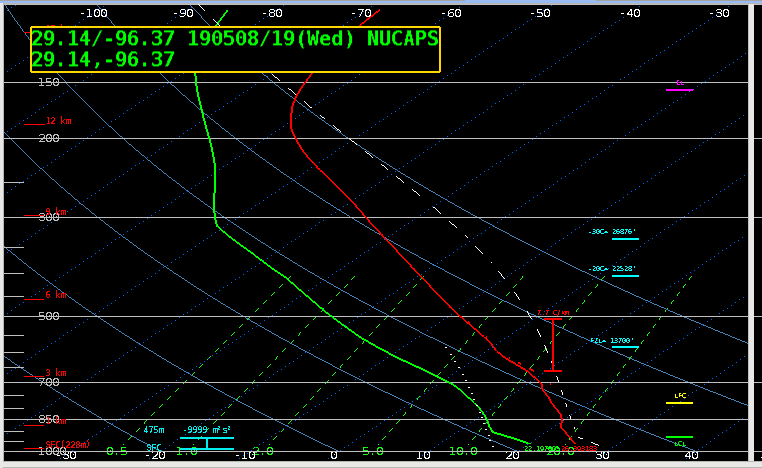
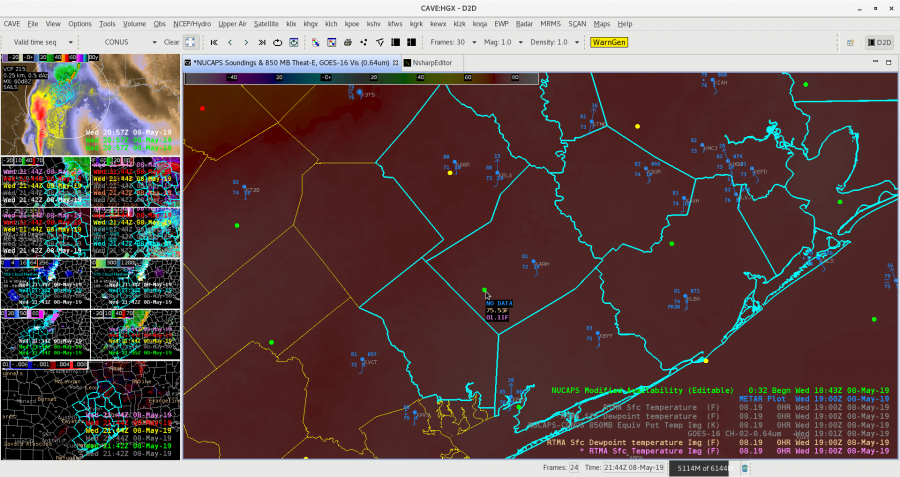
At 19Z, the modified sounding southwest of KARM compared to RTMA was about 2 degrees cool for temperature and 5 degrees cool for dewpoint, presumably due to temporal interpolation issues. Still is a useful tool.
ZDR_Arcophile
Official websites use .gov
A
.gov website belongs to an official government
organization in the United States.
Secure .gov websites use HTTPS
A
lock (
) or https:// means you’ve safely connected to
the .gov website. Share sensitive information only on official,
secure websites.

At 19Z, the modified sounding southwest of KARM compared to RTMA was about 2 degrees cool for temperature and 5 degrees cool for dewpoint, presumably due to temporal interpolation issues. Still is a useful tool.
ZDR_Arcophile
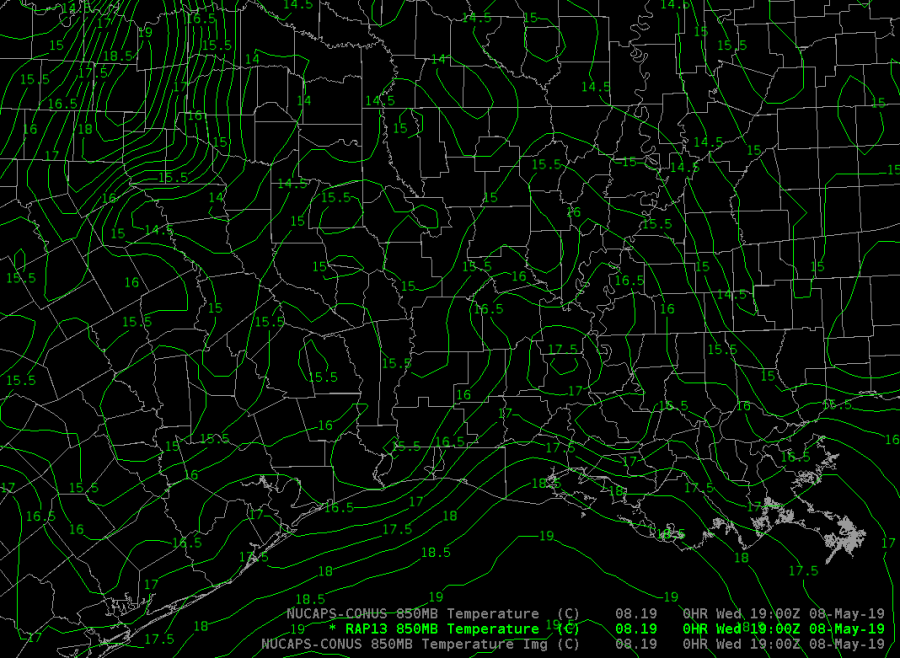
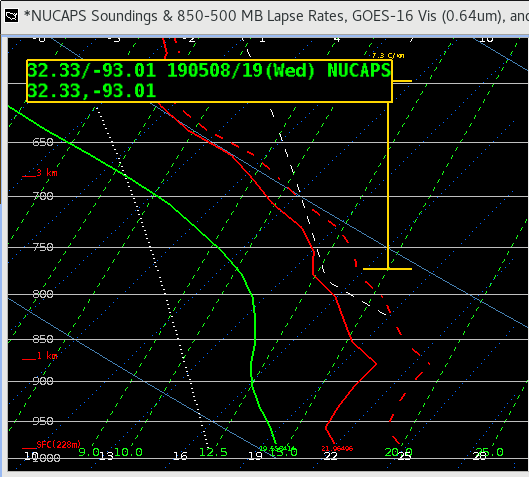
Comparison of NUCAPS soundings in pre-storm environment in SHV CWA. We’re warning for a bowing segment line with bookend vortices. There are several important differences between the generated soundings, including a better representative moisture profile from the modified sounding given the moist environment, linear convection, precip. loading processes. Also of note is the inversion shown between 900 and 850mb in the operational sounding. Analysis of the RAP13 850 temp fields suggest the modified sounding is more representative of what’s likely occurring. In this instance the NUCAPS modified sounding appears to be a better product for the current environment.
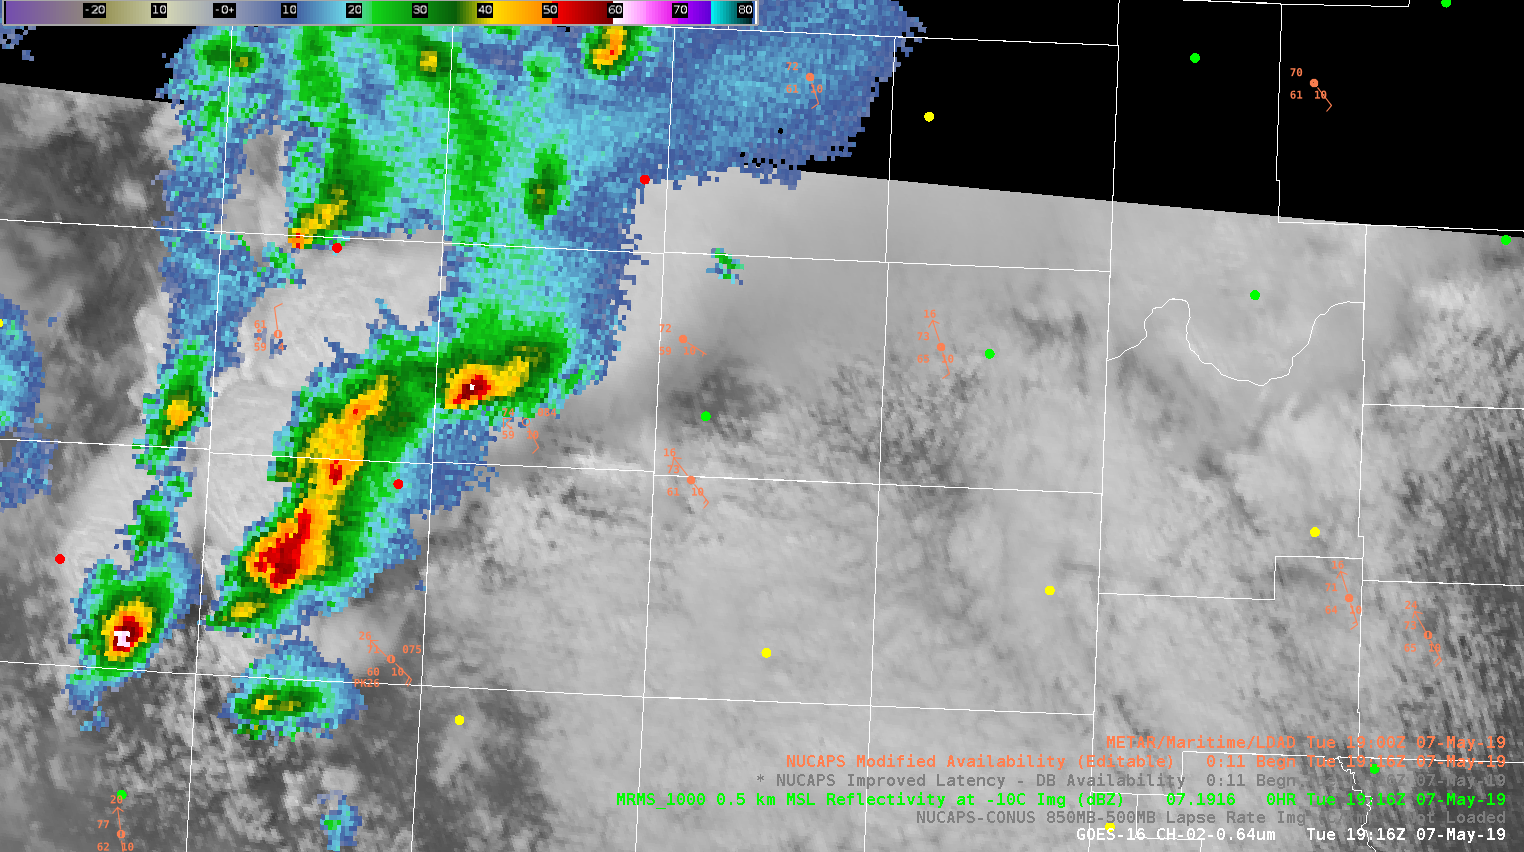
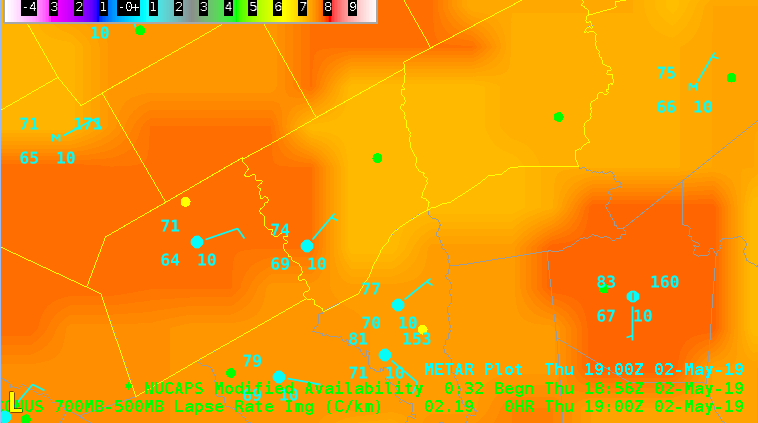
As an operational forecaster, I like to compare model output, real-time obs, and any additional derived data. This image from the NUCAPES H85-H5 Lapse Rate can potentially help boost one’s confidence in particular synoptic situations. For example, suppose you were expecting a dryline to emerge east across W Texas, but guidance indicated otherwise and sfc METARS were unavailable, using the NUCAPS Lapse Rate products can help determine the location of the dryline (for this particular setup). In this image, values reflect the drier air advancing east leading to steeper lapse rates. 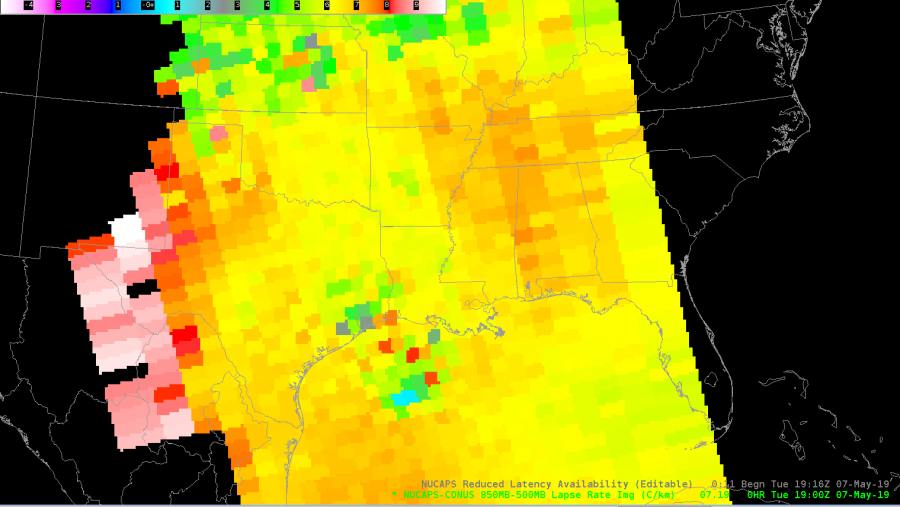
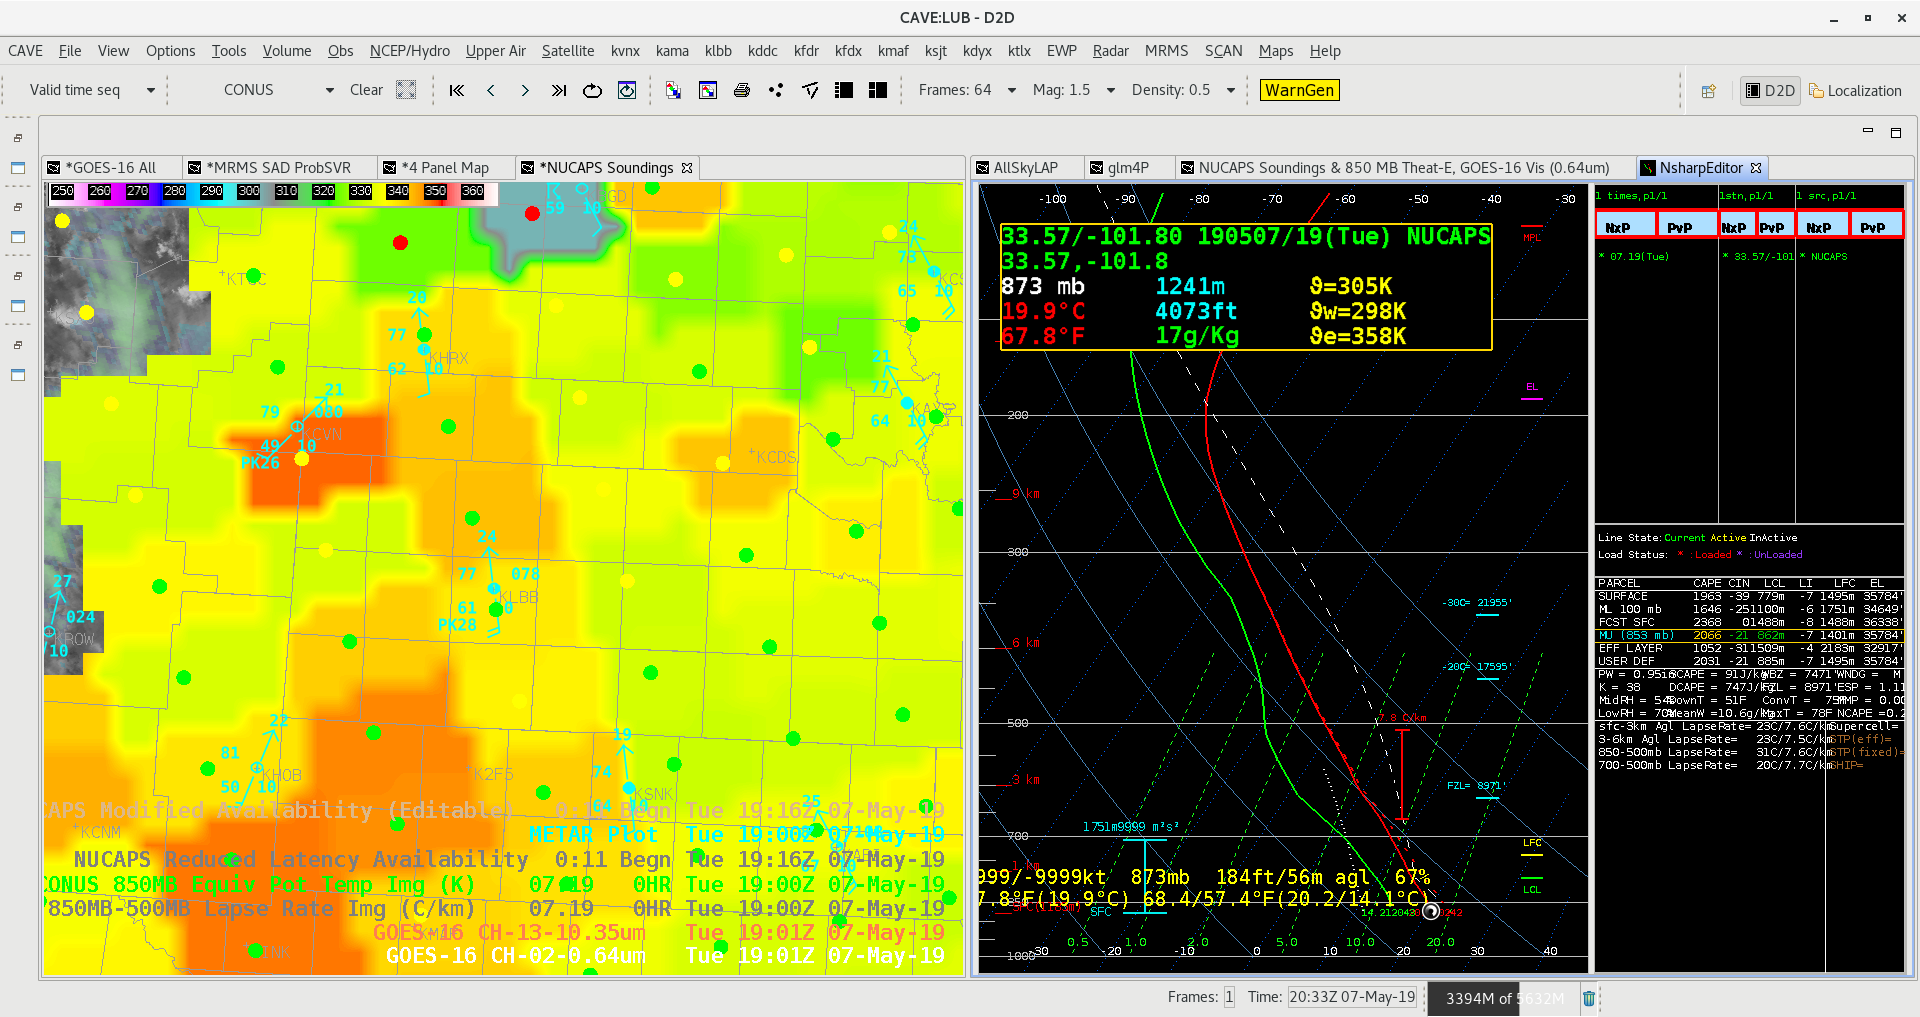
Modified NUCAPS soundings taken at 19Z became available in AWIPS and was noticed around 2030 UTC. The One taken near Lubbock was flagged as a Successful. I wanted to compare the NUCAPS sounding withe the nearby 19Z METAR observation and found the METAR measured temp/dew observations of 77/61 where the NUCAPS sounding at the same time had surface measurement of 69/58. The difference between the surface temperature observations for a modified sounding was concerning.
#ProtectAndDissipate
NUCAPS modified sounding doing a good job of representing the boundary layer in the near storm environment in the AMA CWA. Green dot ahead of cell in middle of image was selection point for provided sounding.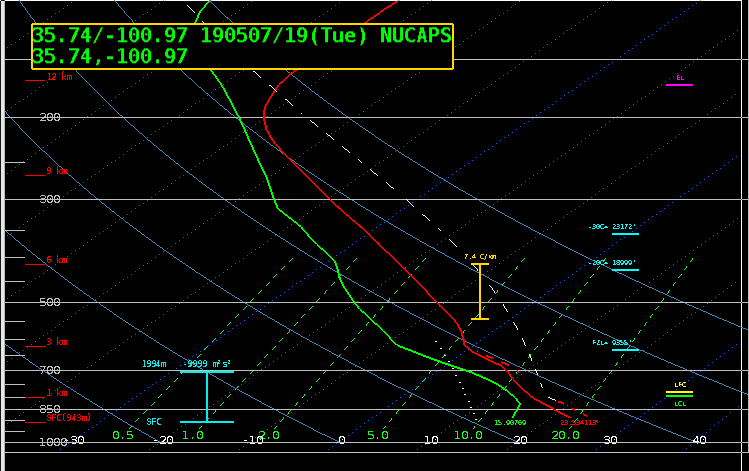
icafunnel
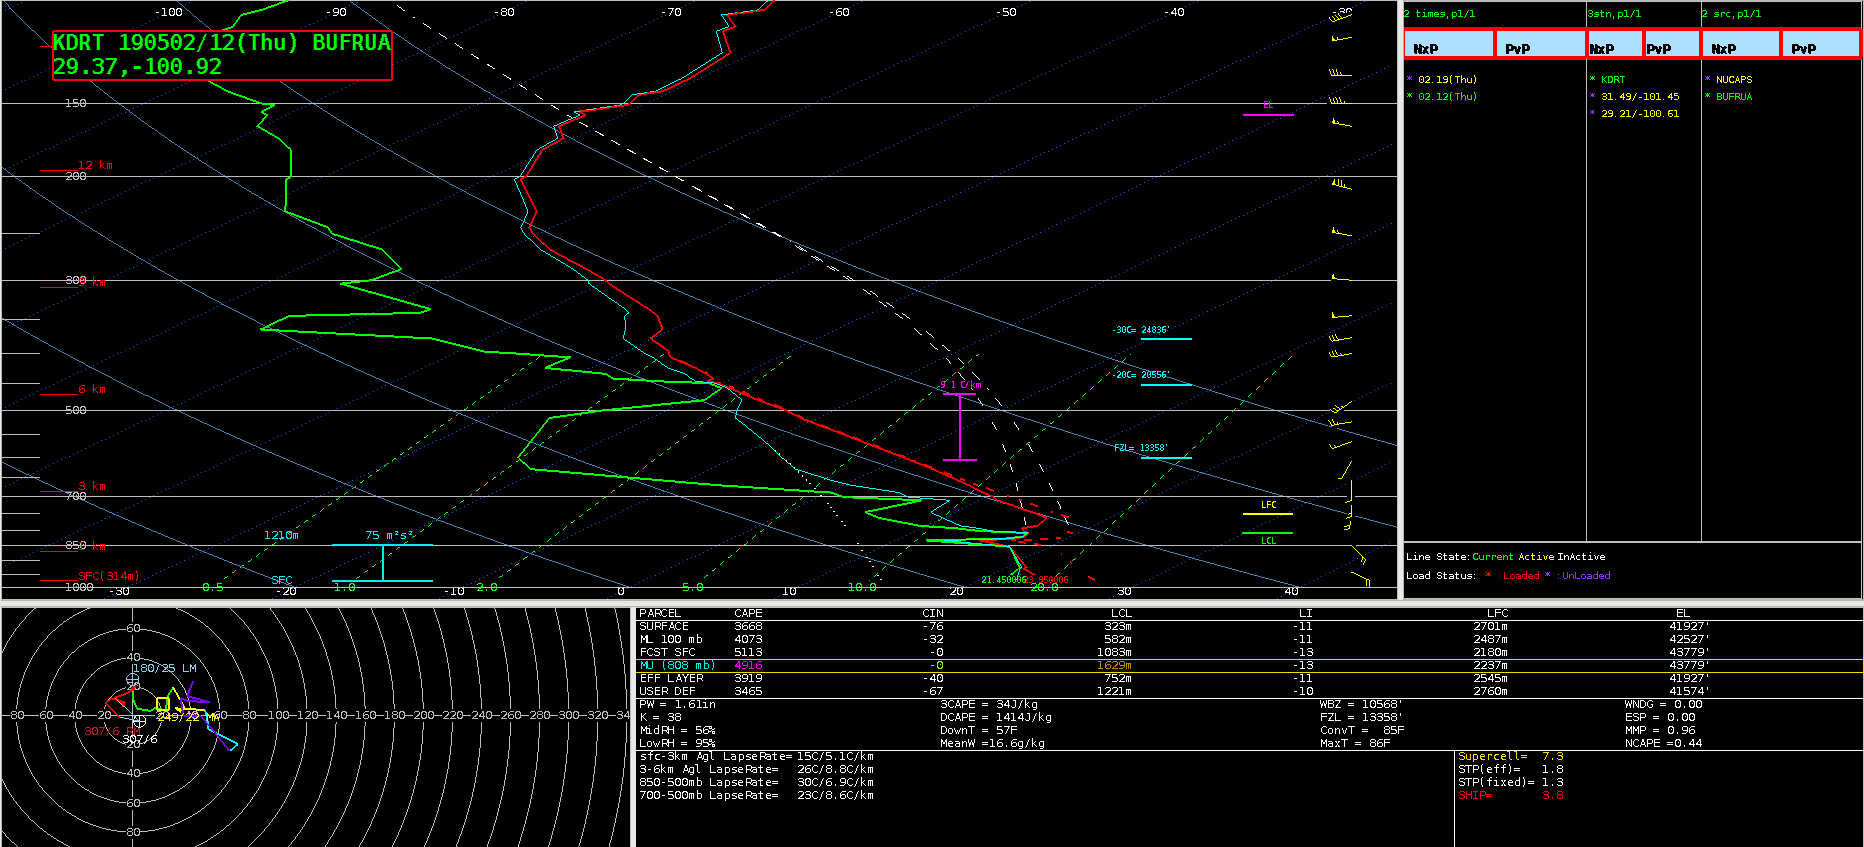
This was the 12z Del Rio sounding.
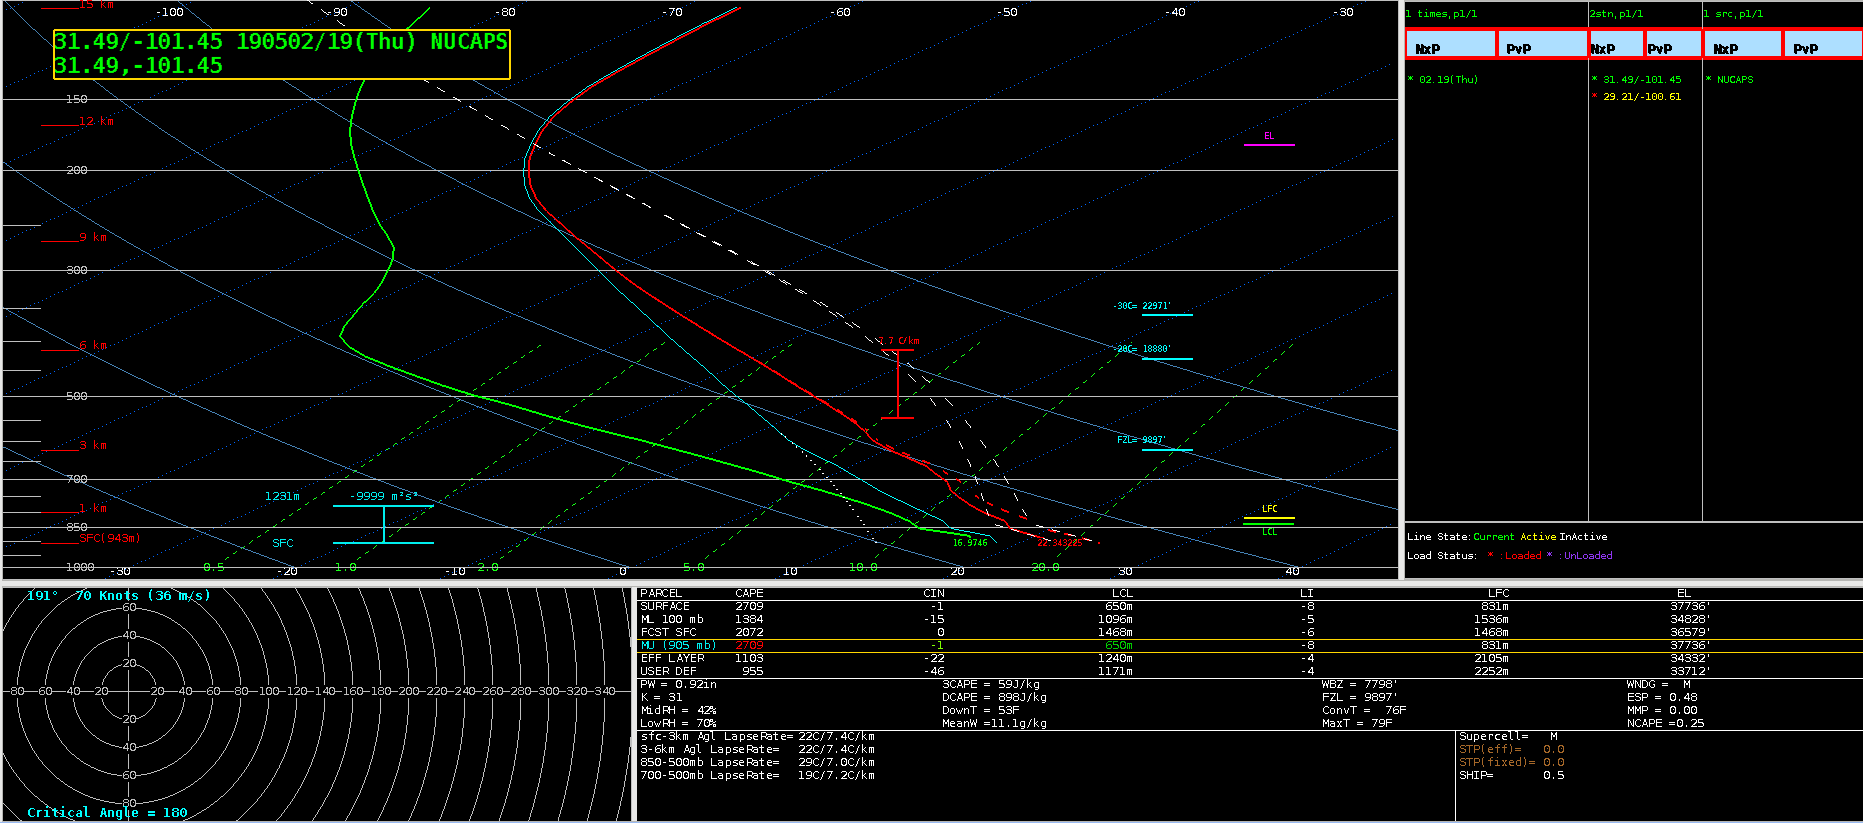
This sounding is a modified NUCAPS near Del Rio. While the lower level structure was a bit different than the actual sounding, the observed sounding was taken several hours earlier before boundary layer modification. 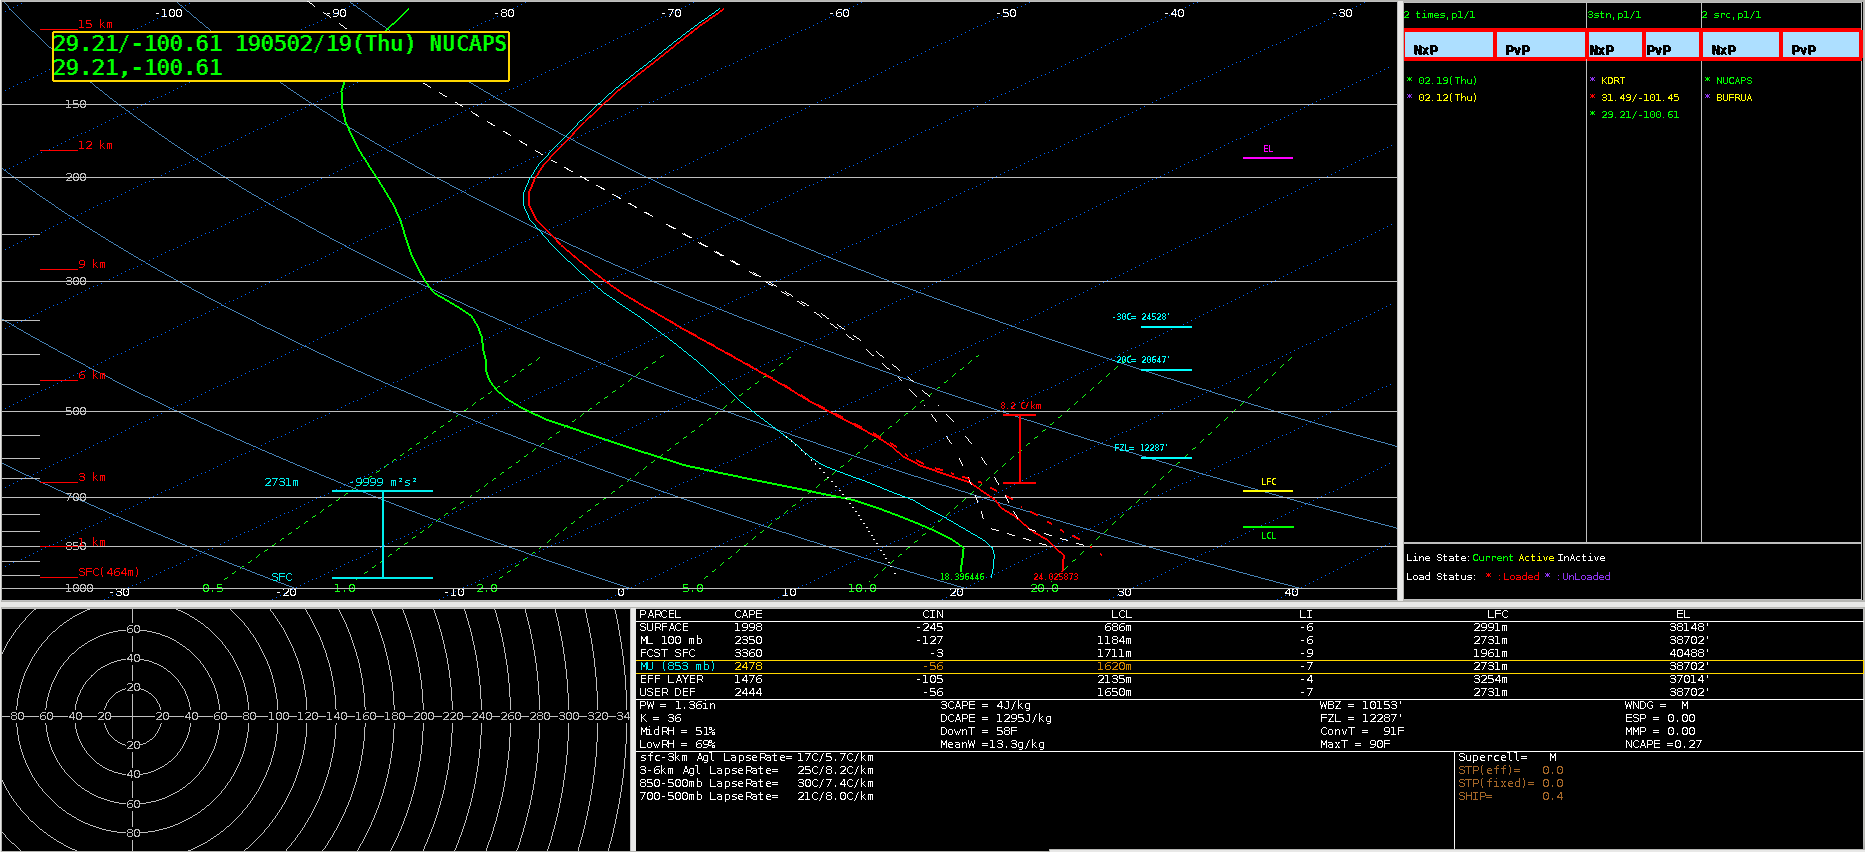 This was an unmodified NUCAPS sounding from the same region. Boundary layer moisture is not captured nearly as realistically as the prior modified example. Overall, trust in the modified NUCAPS sounding data has increased dramatically after some exposure to it. I would say many forecasters need more experience learning about the soundings through simulations to trust the data more.
-Dusty
NUCAPS offer a way to get a vertical profile of the atmosphere across the US. However, in areas where soundings were not “retrievable” it can leave many of the products with large holes in them.
A great application would be some type of algorithm that fills in the “data holes” Two ways to approch this would be:
A smoothing of some sort would still benefit the product above, but this would be of great benefit to forecaster’s trying to determine the afternoon environment. (Note: I think it would be beneficial to include a mask that said whether the data was from NUCAPs or a model in each location if a product like this was developed. All in all, this is a useful product, but it needs some further refining.
South Beach
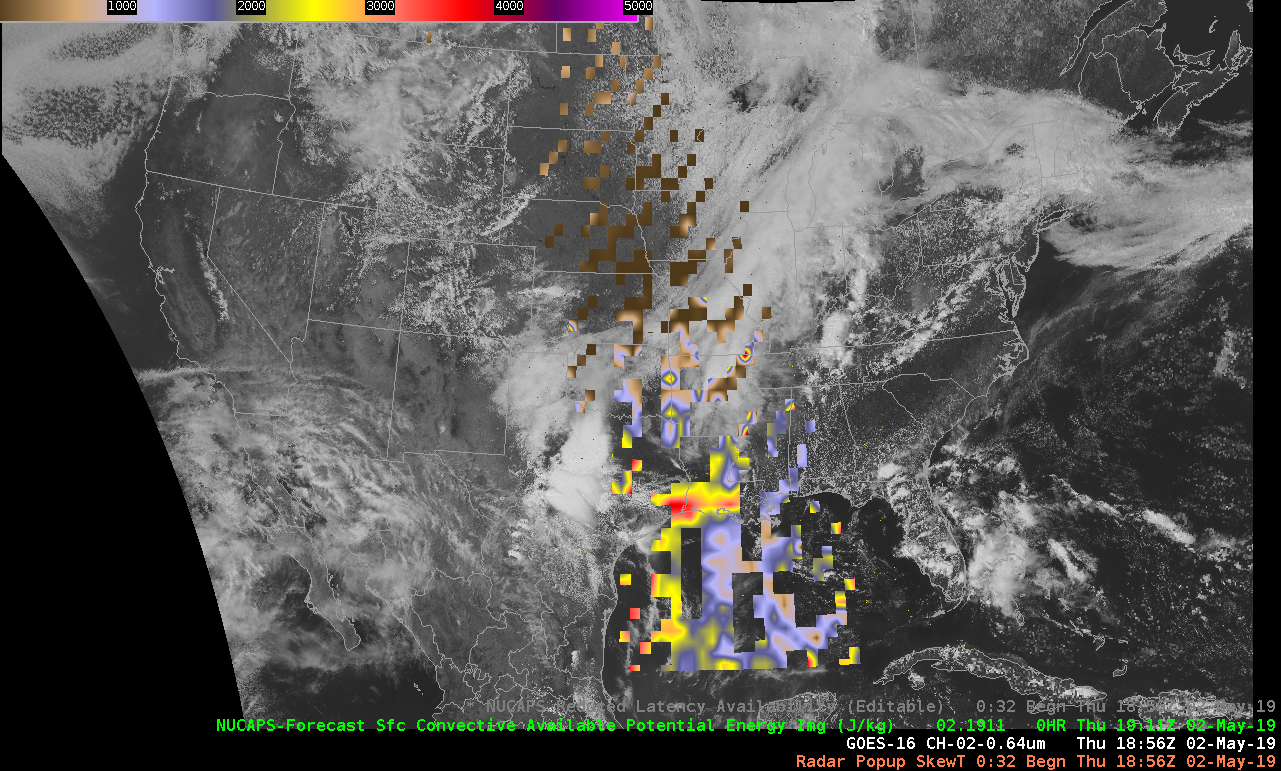
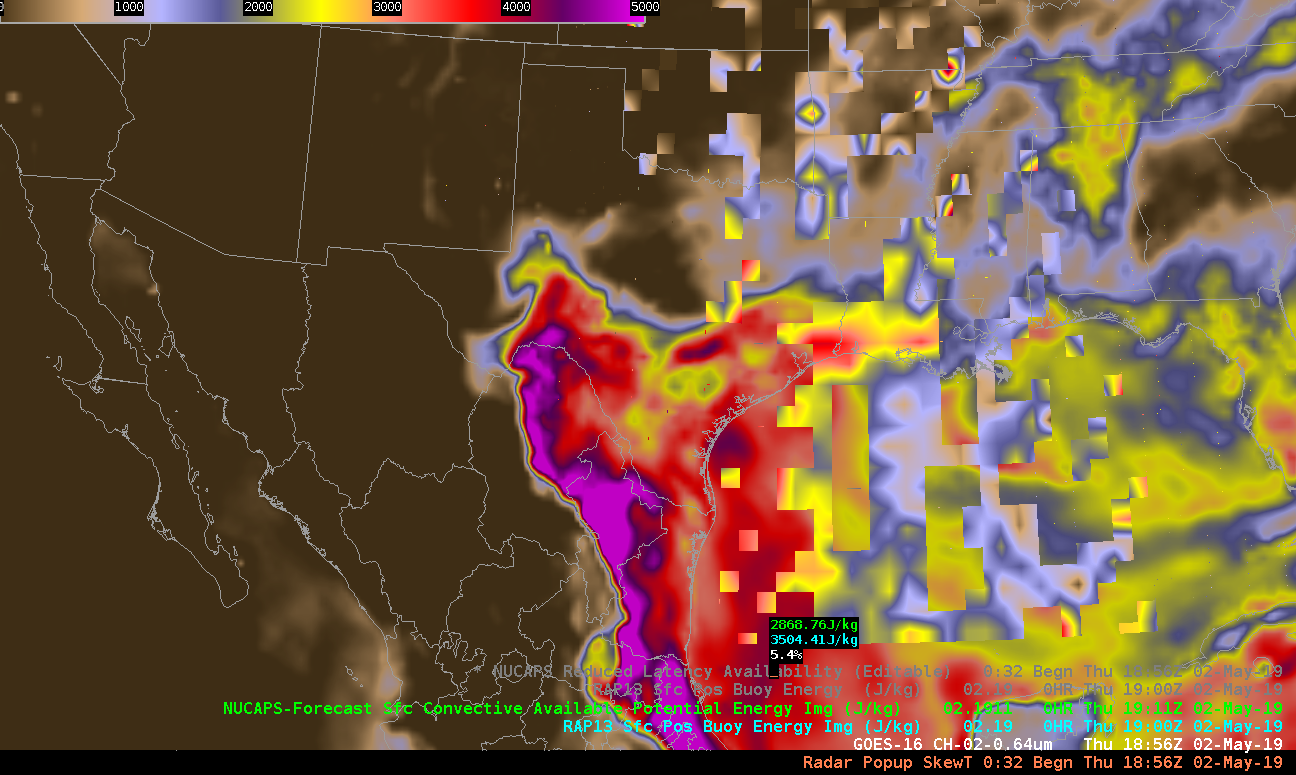
NUCAPS forecast product unrealistically advects the CAPE east through the evening. In reality the CAPE axis extends along and east of the Rio Grande and will likely stay in place but slowly modify toward sunset. Also it might improve the product to interpolate or fill in the gaps with a model (actually Jake’s comment) not mine.
— SCoulomb
NUCAPS gridded 700-500mb Lapse Rate and Modified sounding points. Lapse rates are favorable for storm intensification across the southern part of FWS CWA.
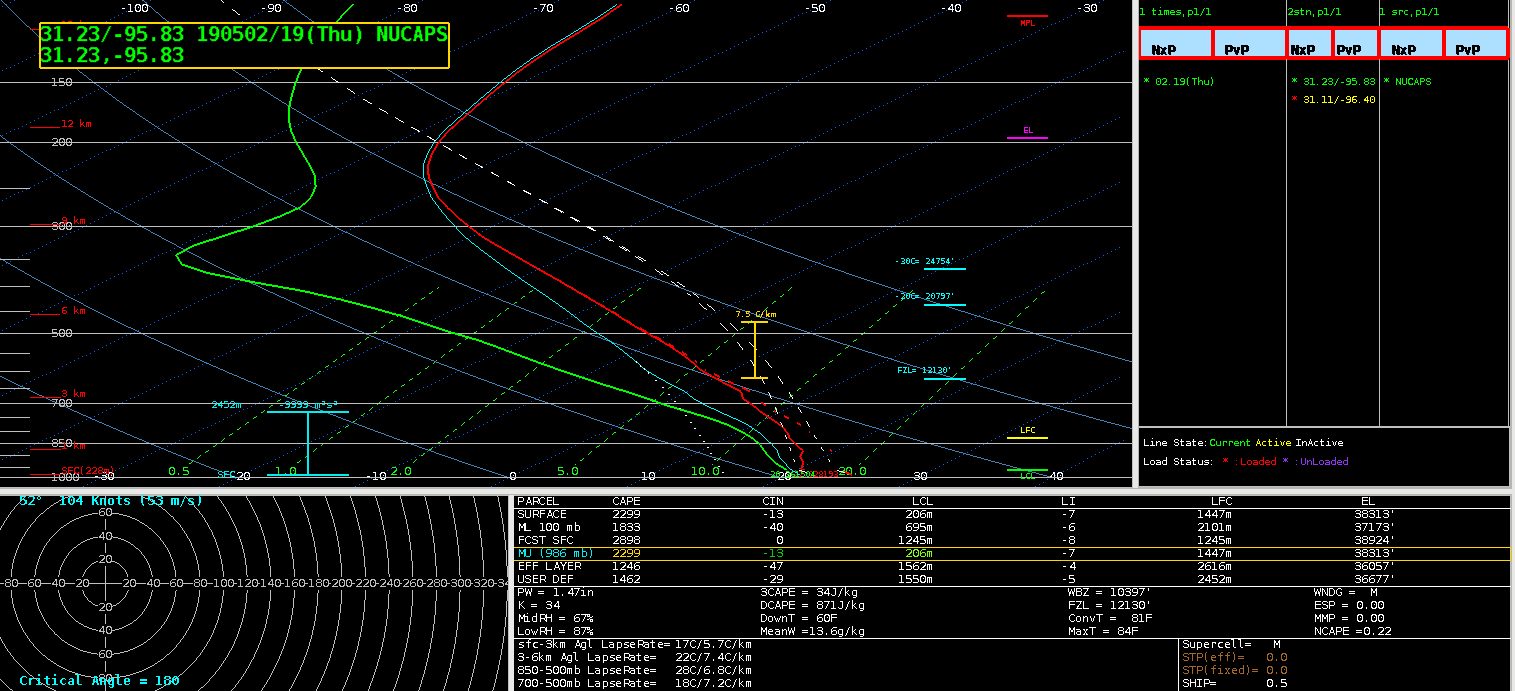
NUCAPS Modified sounding had 72/69 (temp/dewpoint), compared to closest surface METAR KLHB 74/69 (temp/dewpoint). This sounding data showed un-capped and unstable environment supportive of surface based convection in southern FWS CWA. -Jake Johnson
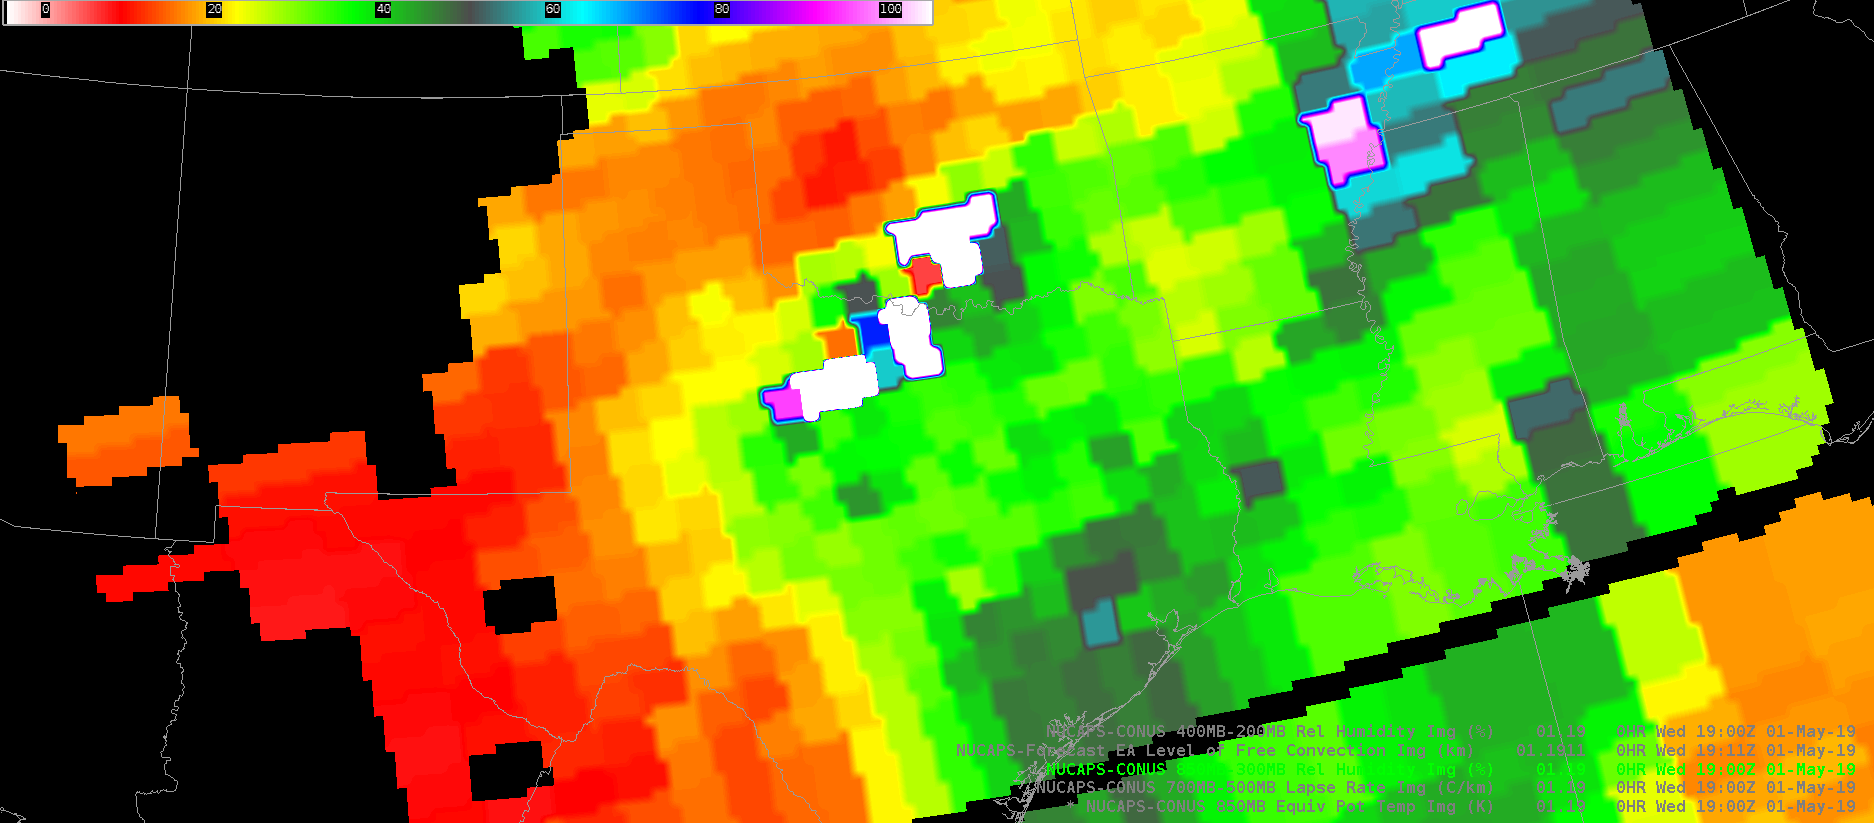
An example of NUCAPS gridded data over Texas. Convection was already underway at this time, as seen by the very high pixels in south OK and north TX. This field is 850-300mb RH. The dryline is evident, however the usefulness of this and other NUCAPS gridded data is questionable for operations because of the poor resolution. With so many other much higher resolution surface and gridded data sources available, I doubt I would be using these products much at all in operations.
-Dusty Davis