I know, I know; a lot of posts about the GLM. What can I say…I’m a lightning person. ANYWAY, let’s look at some other things that we are testing; today it is NUCAPS soundings. Pretty handy when you don’t have a sounding station nearby and if skies are clear (well, mostly clear…it works with clouds in some situations); you can get a sounding profile for your area. Nice! The caveat is that you need to have a satellite overpass across your area and that is the tricky part. There are only a few satellite overpasses on any given day and you have to be right under the overpass to get the best data but we can make it work. Here is one from today and we’ll look at the point right on the TX/OK state line.
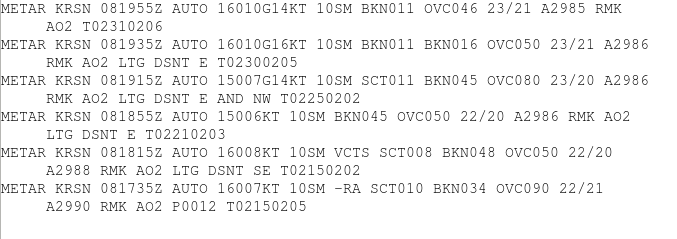
With a possibility of storms across western Oklahoma along the cold front as it moves east, we need a point somewhere in the warm sector with a close enough METAR site that we can adjust to if needed. That point along the TX/OK state line should work…
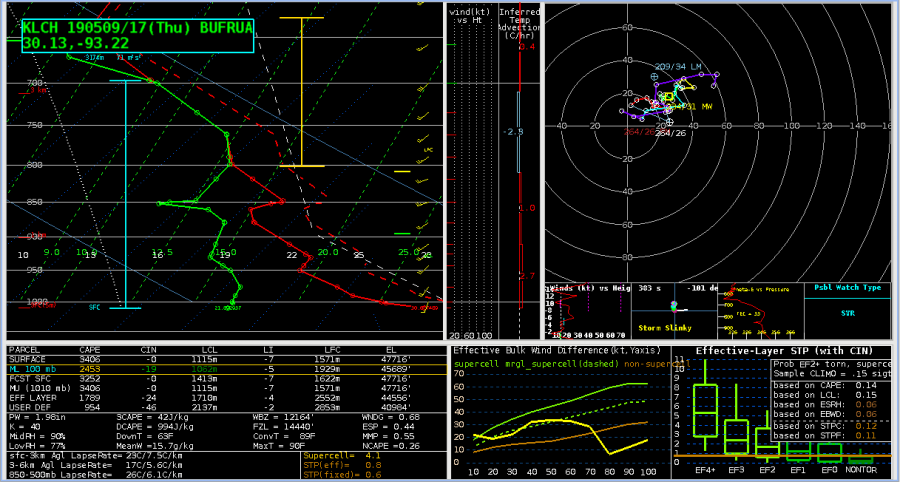
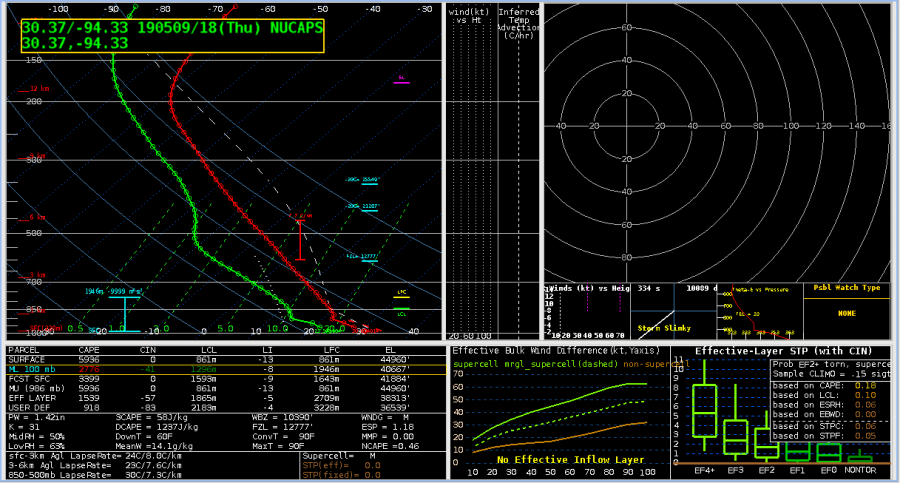
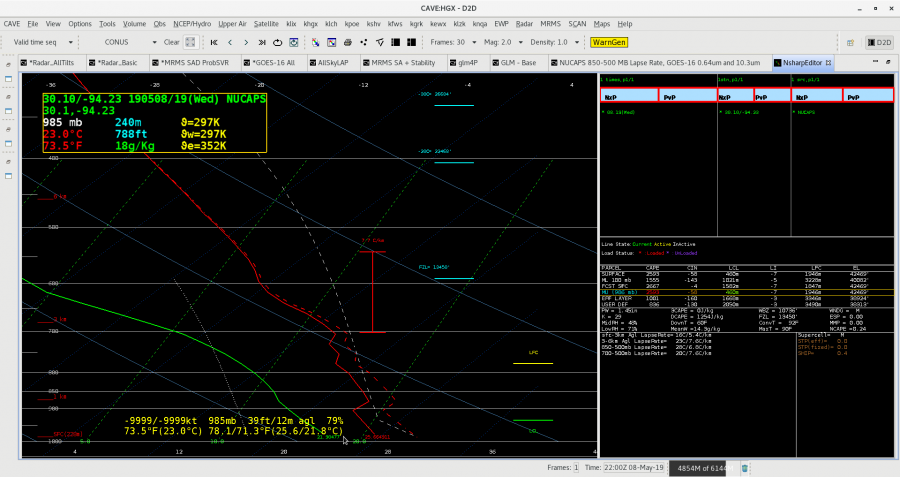
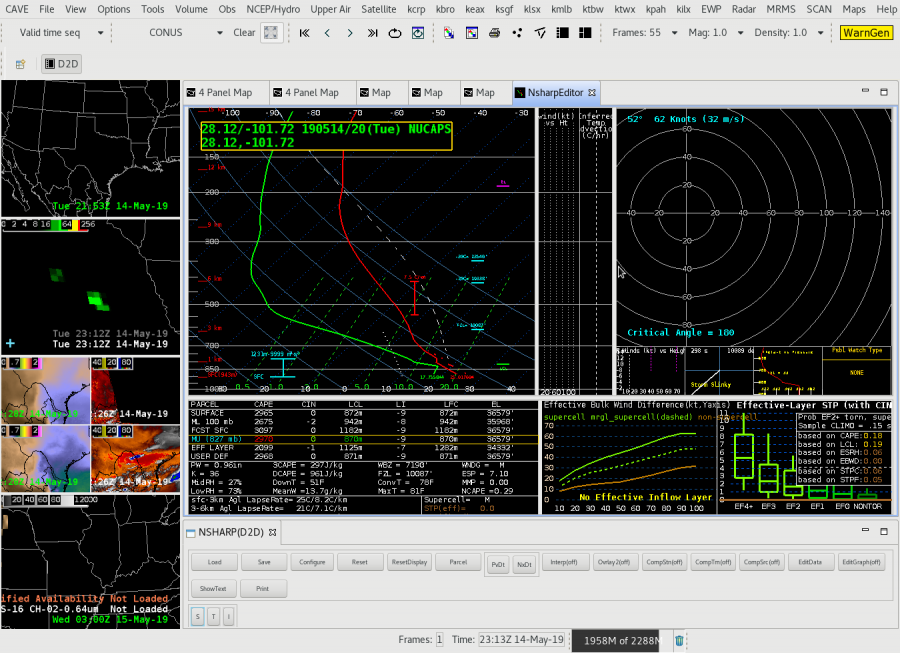
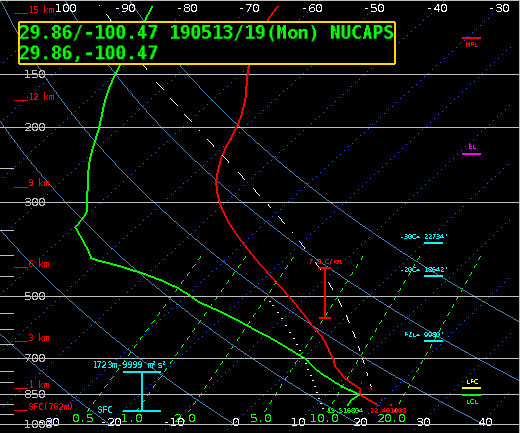
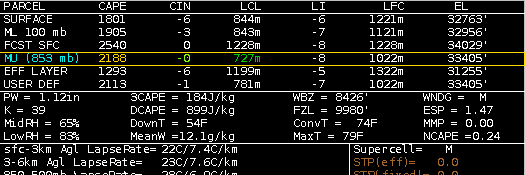
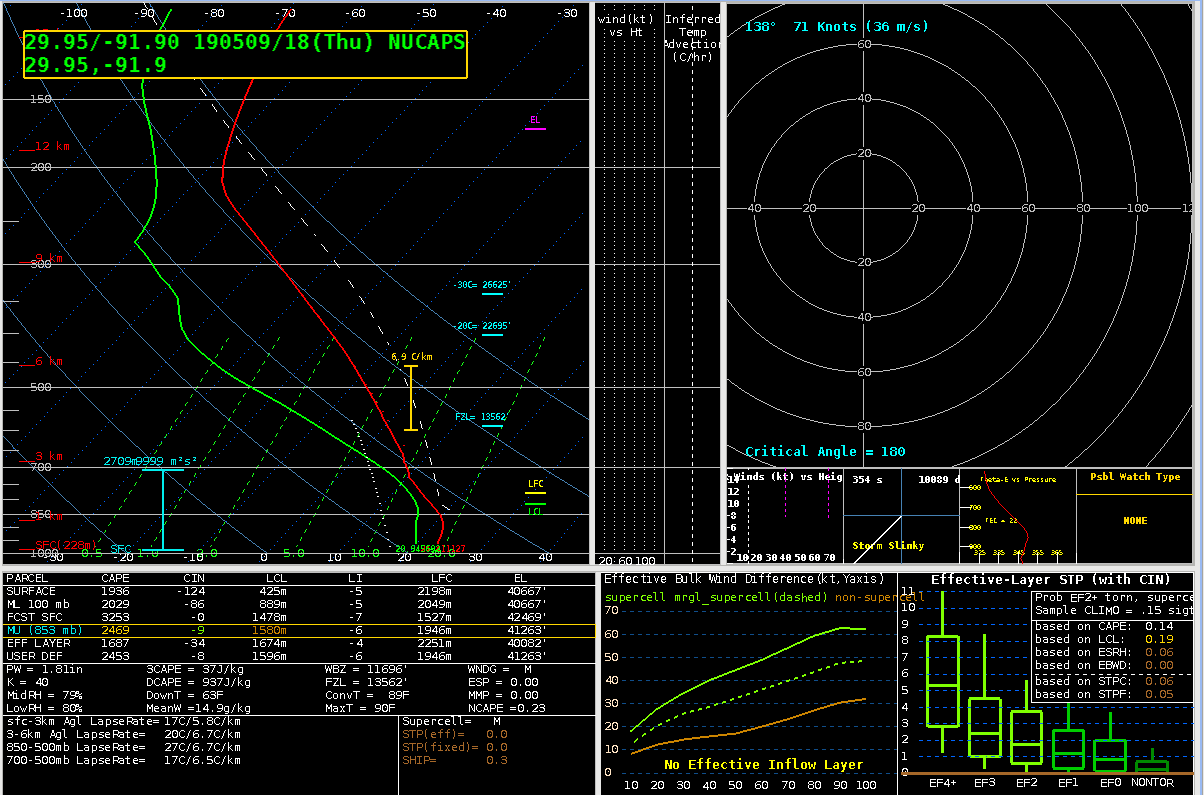
Here is what the original, unedited sounding looks like:
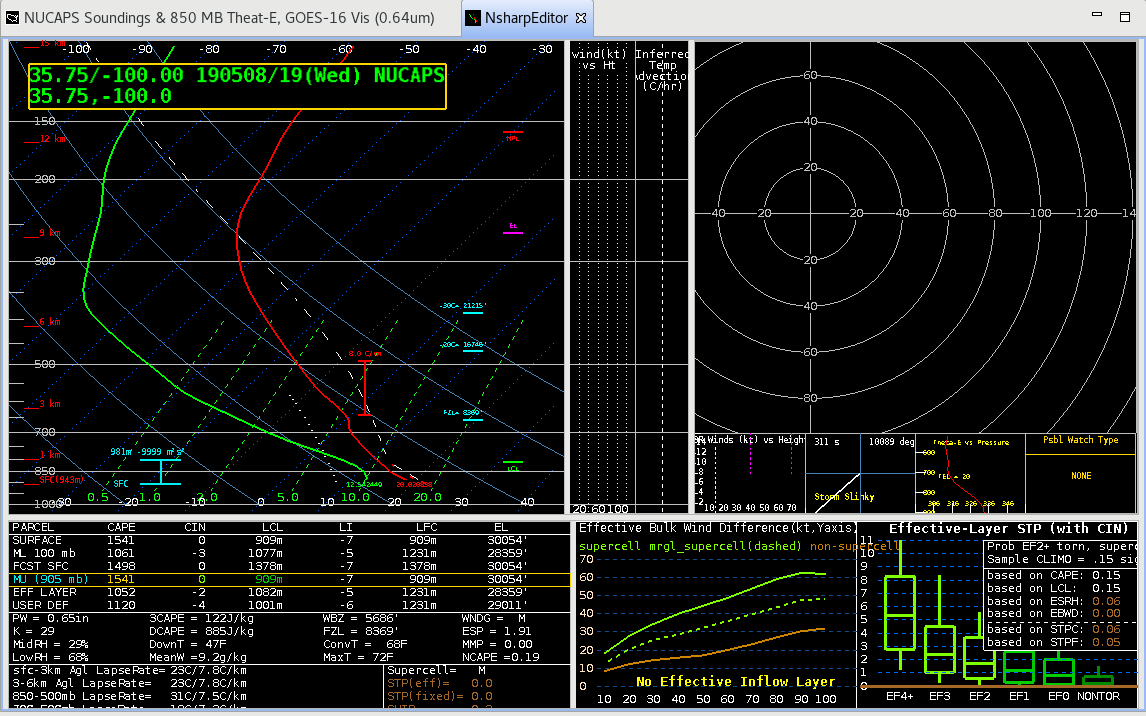
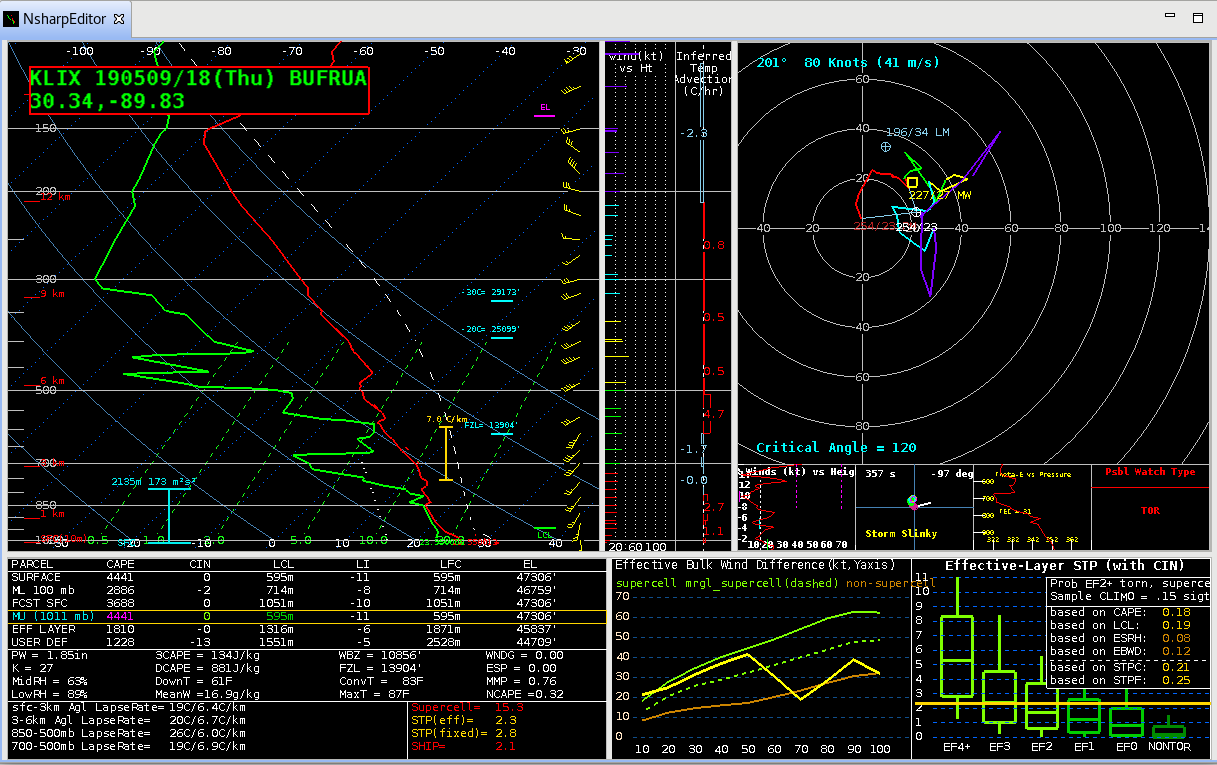
It’s not too bad; comparing to the 12Z Amarillo and Norman soundings (not shown), the soundings do have an EML between 3-4 km which the NUCAPS sounding temperature profile does hint at although it doesn’t have the dry air associated with it, and the NUCAPS sounding does have the tropopause a bit lower than the actual soundings. Overall however, it looks at least somewhat representative. However, the one area it needs some work is the surface. Dewpoints are a bit low with the sounding around 54 F but the temperature is within 1-2 F of surrounding METARs. Well, let’s adjust the surface parcel in the sounding to match surface conditions in the warm sector to the east; say a Td of 60 which should advect northward through the day…
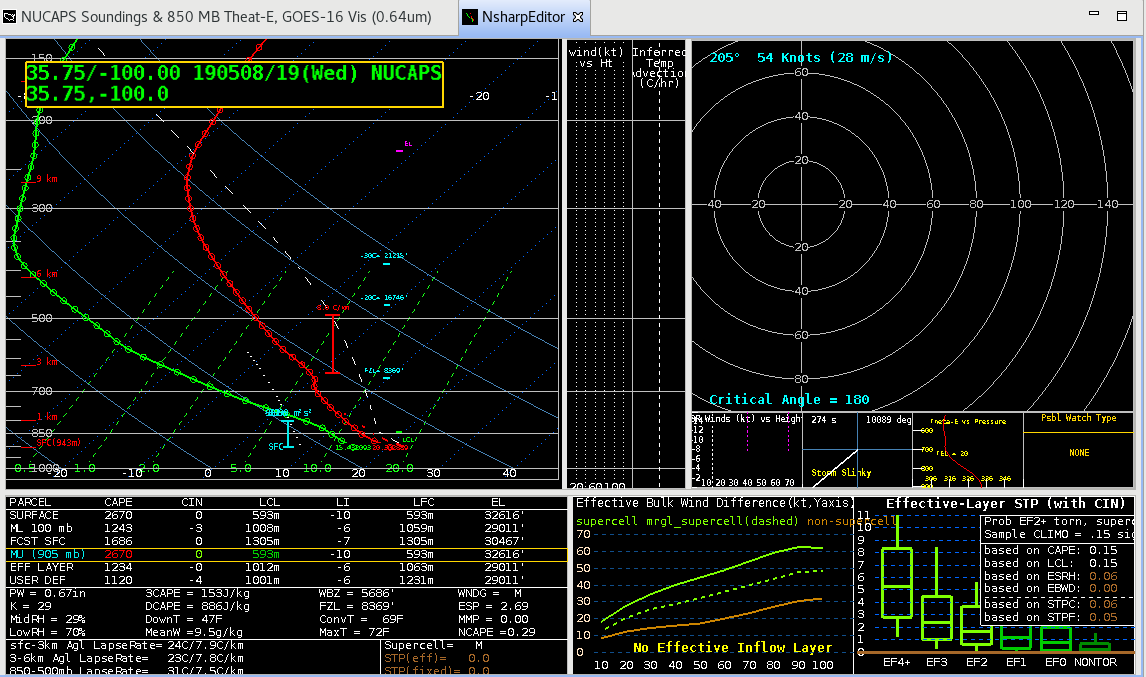
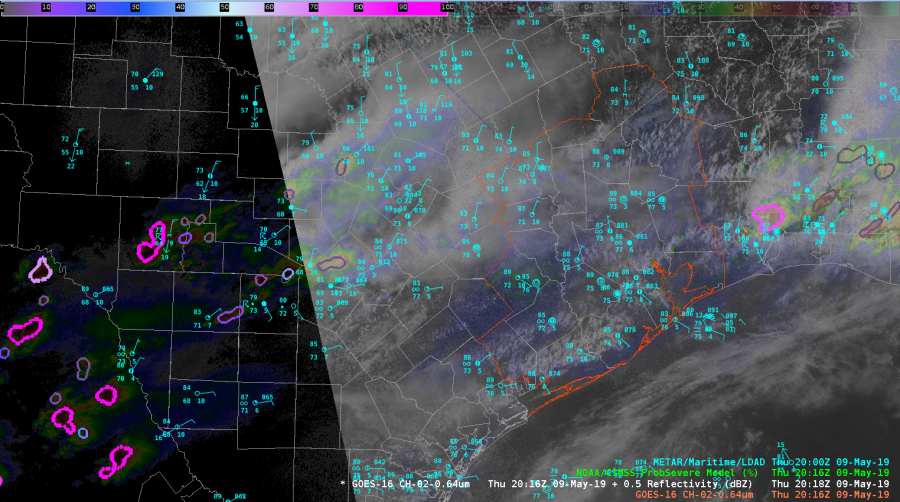
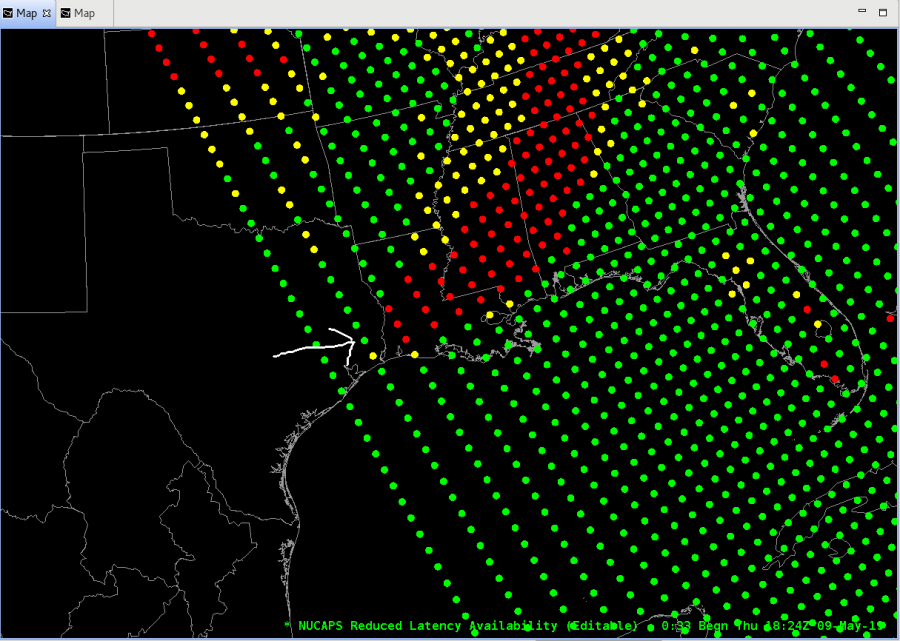
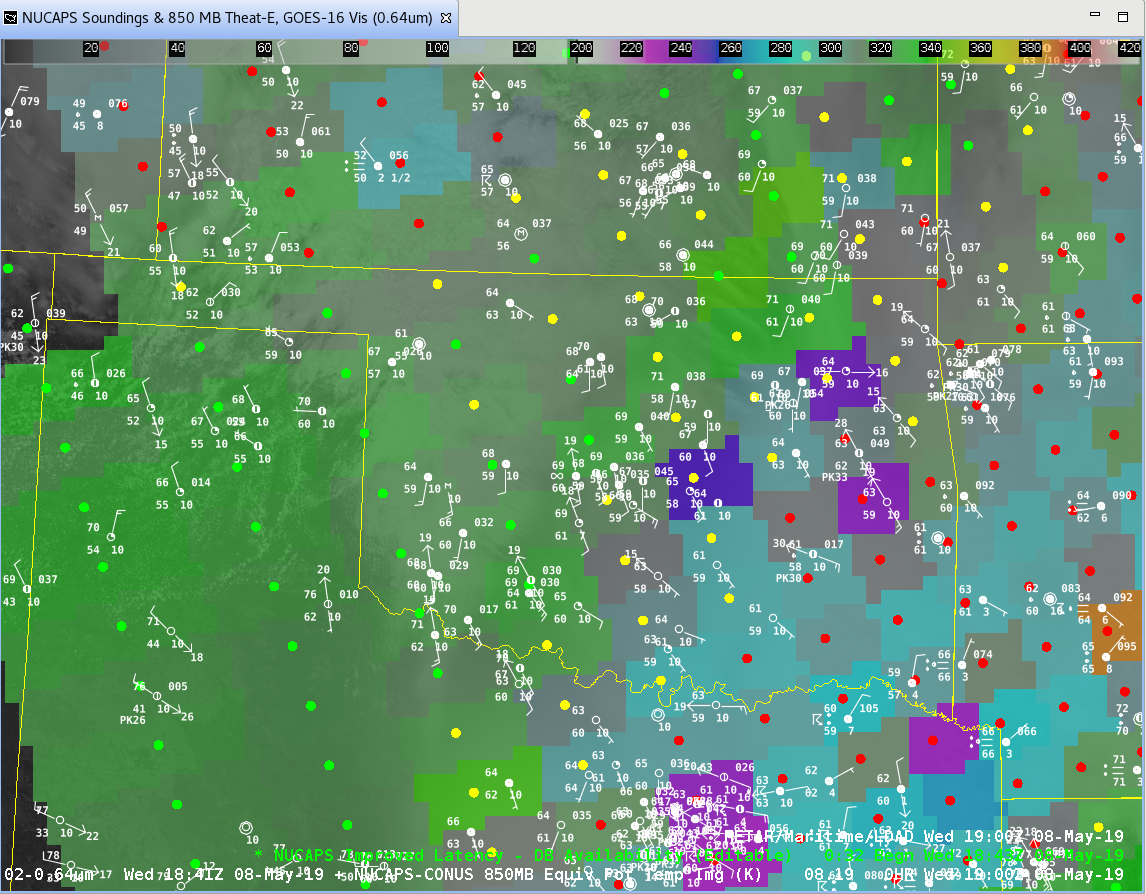
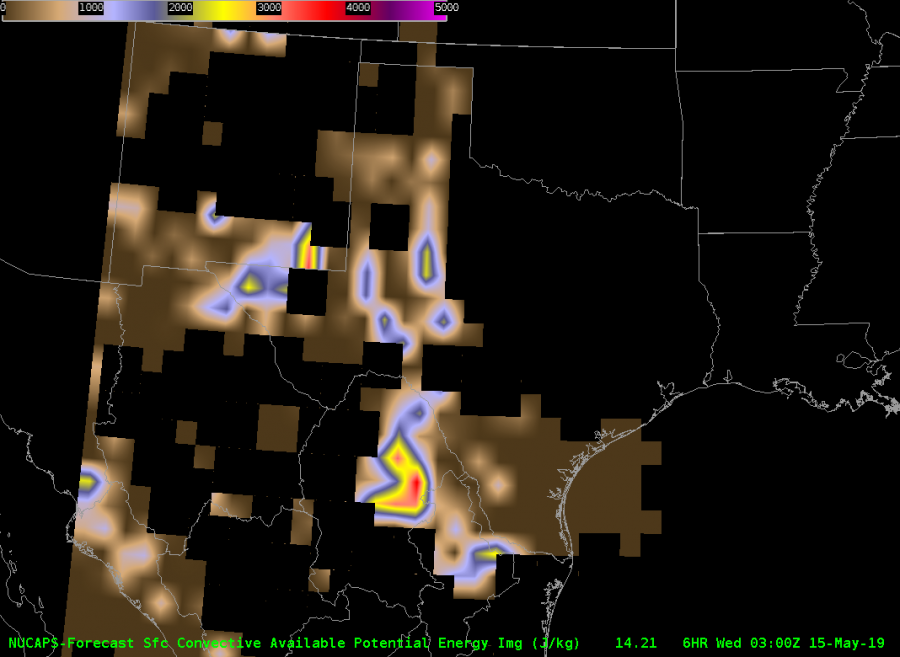
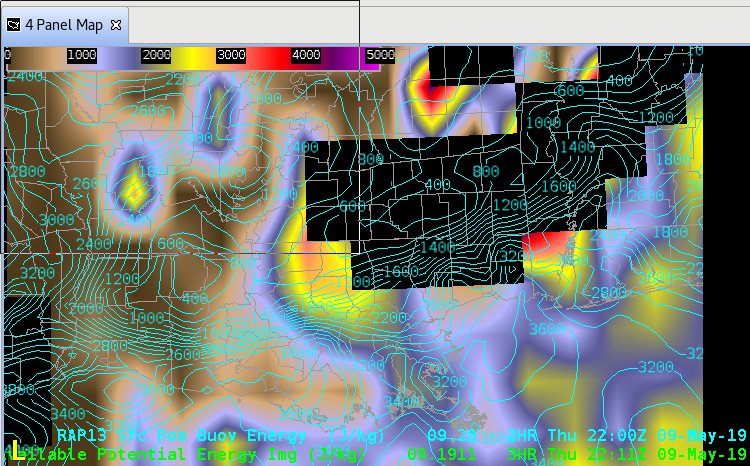
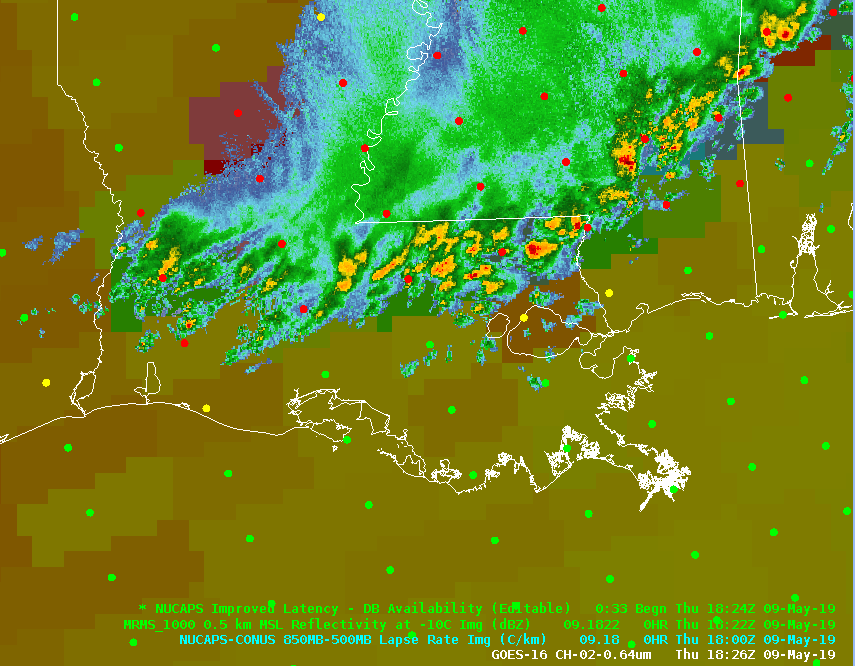
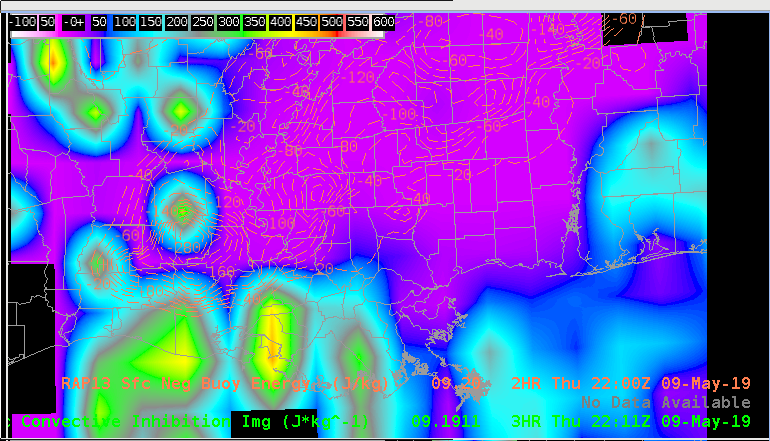
Wham. MUCAPE values jump by almost 1000 J/kg. But that’s pretty optimistic so let’s used MLCAPE which is a smaller, but still respectable increase of 200 J/kg. Not to shabby and should indicate at least the potential for storms to form. But what does that CAPE value compare to other fields? Well, fortunately NUCAPS is available in a plan plot so we’ll look at that along with the RAP40 CAPE values.
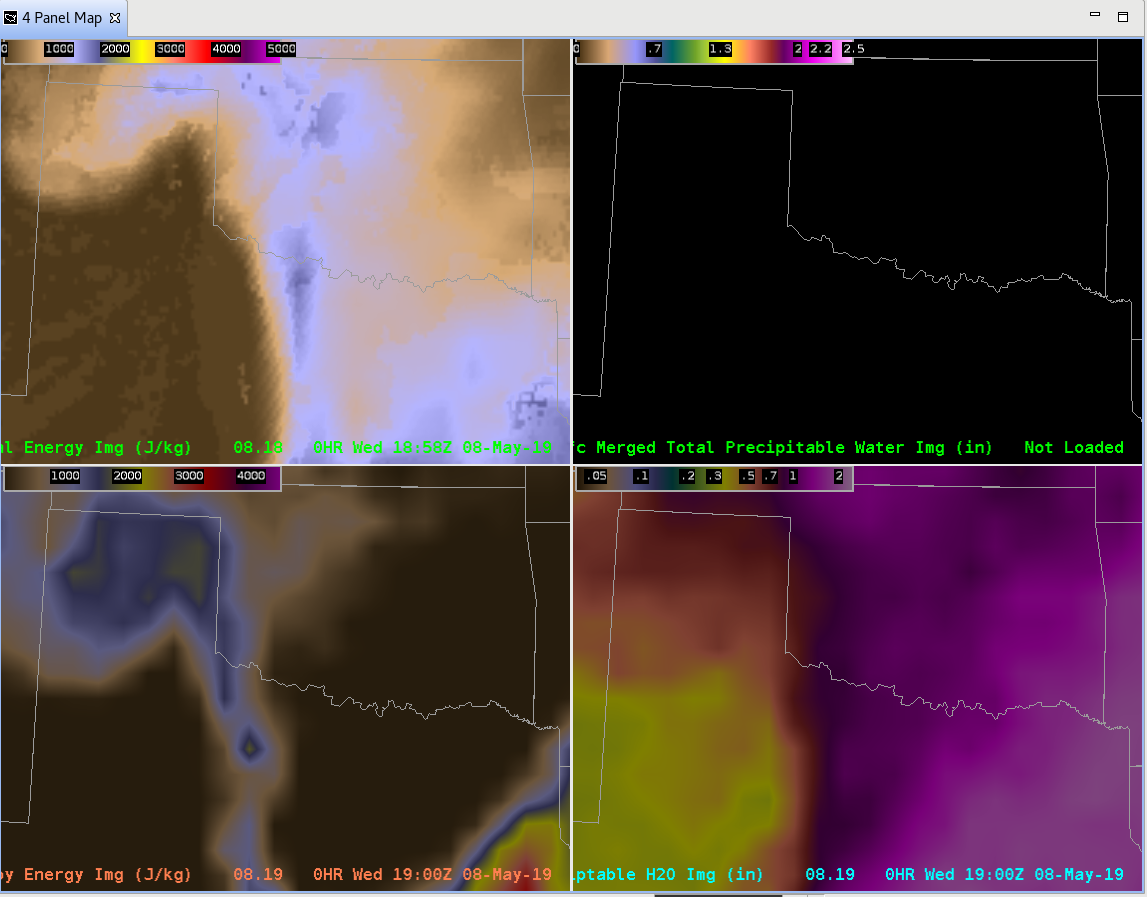
Unfortunately the NUCAPE sounding was a bit fast with the dryline pushing east and had CAPE values along the TX/OK state line around 475 J/kg so…no. The RAP40 wasn’t too far off with values around 1500 J/kg.
So, if you are looking for some extra “sounding” profiles in and around your area AND you are lucky enough to be under one of the Polar Orbiter tracks that has a sounder on it, give it a spin. I think I’ll be looking at it quite a bit more…
-Dusty


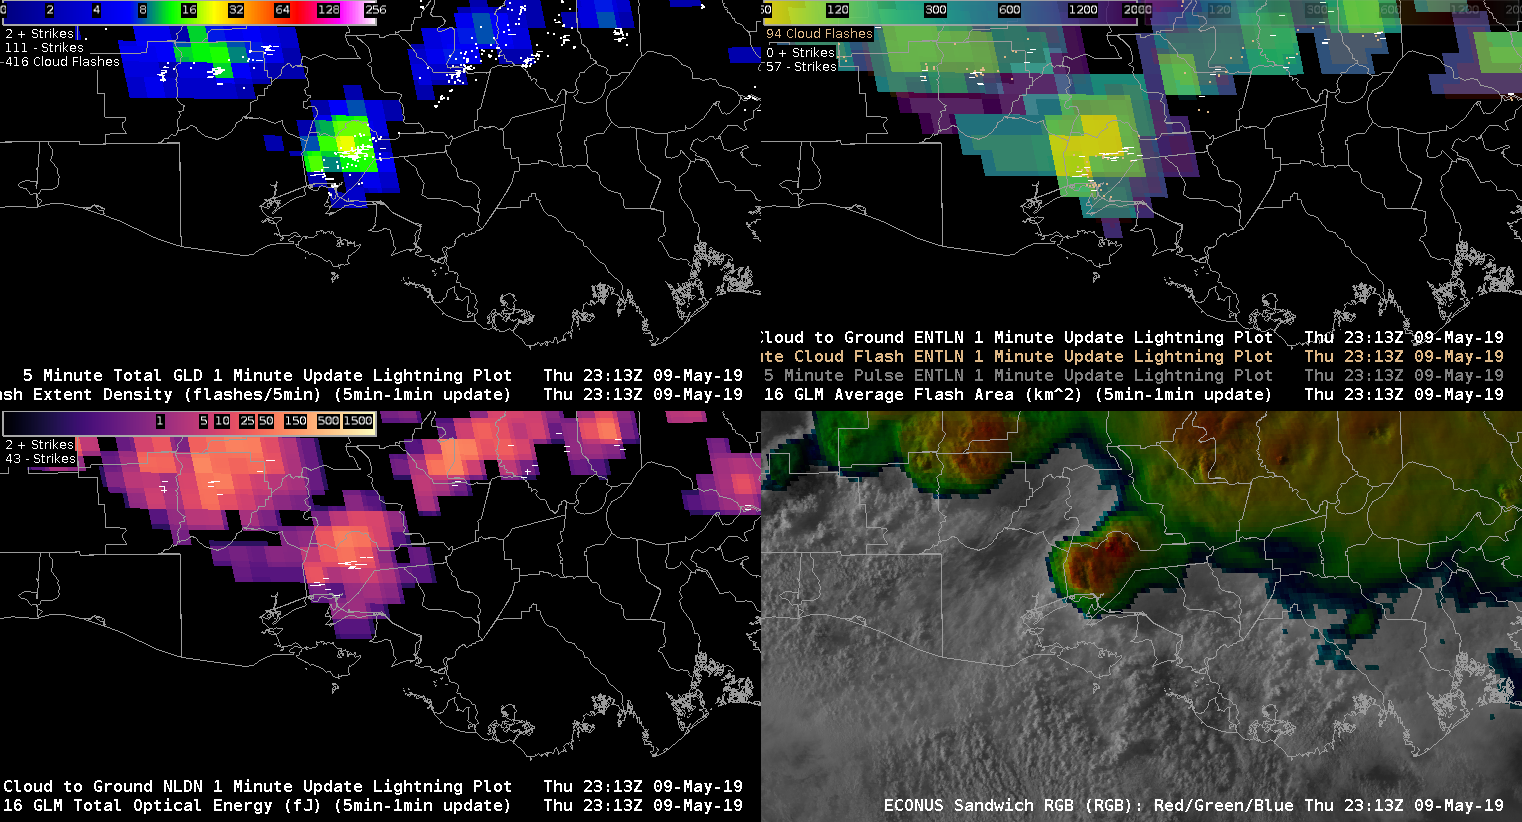
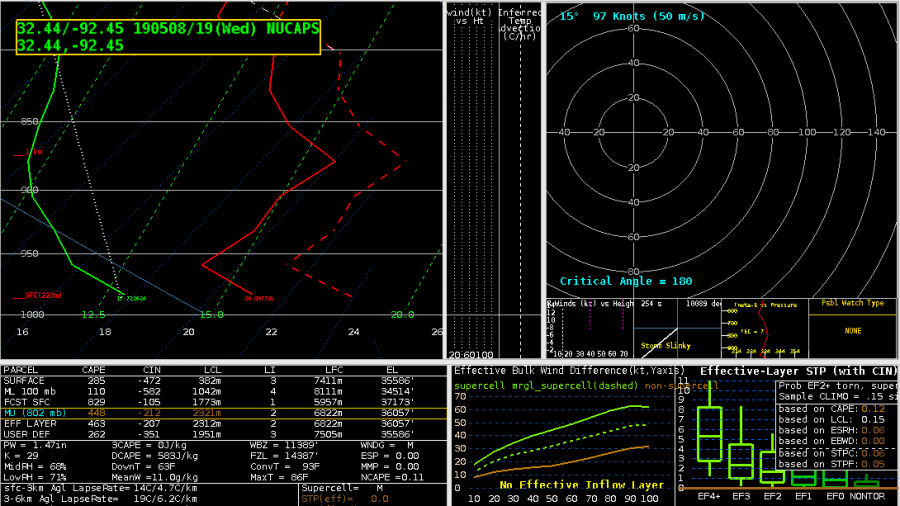
 This was my first exposure to NUCAPS FCAST this week as it wasn’t available….it’s worth a second look. It’s also an indication that you need to work hard and diligently through the end of the shift!
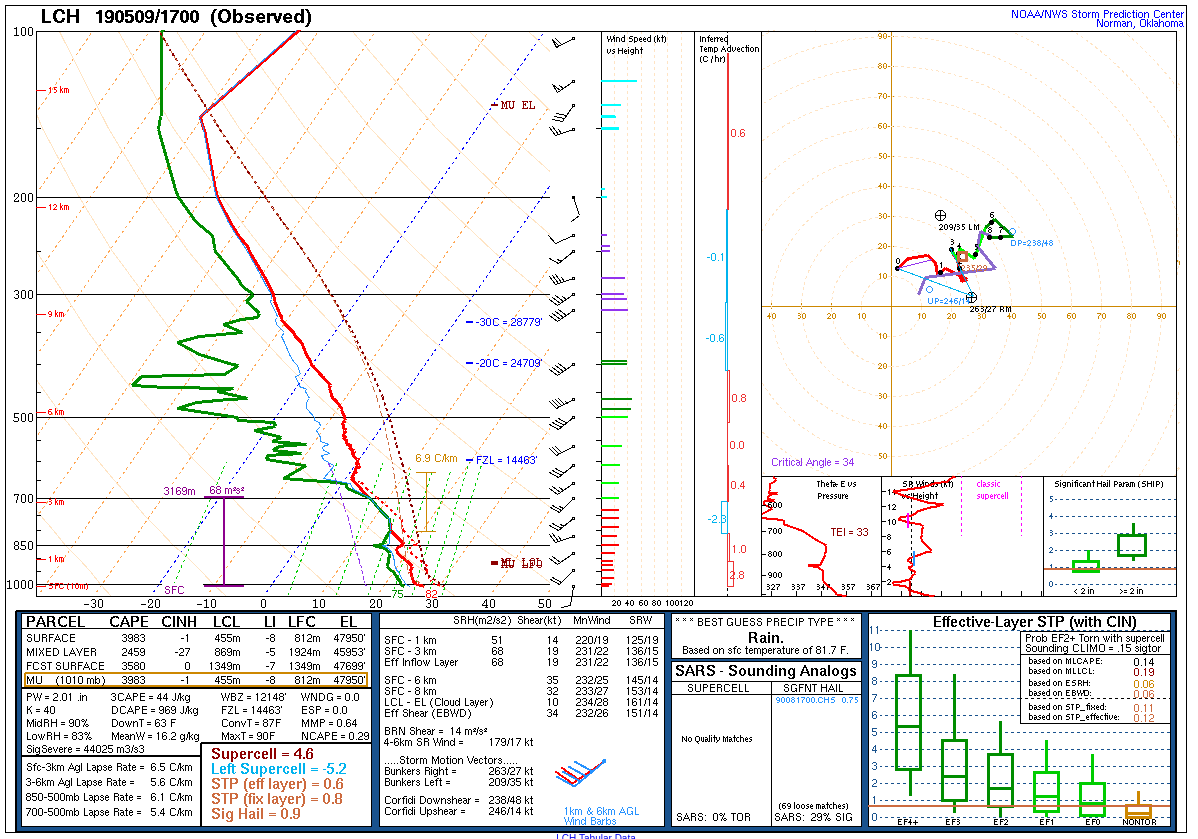
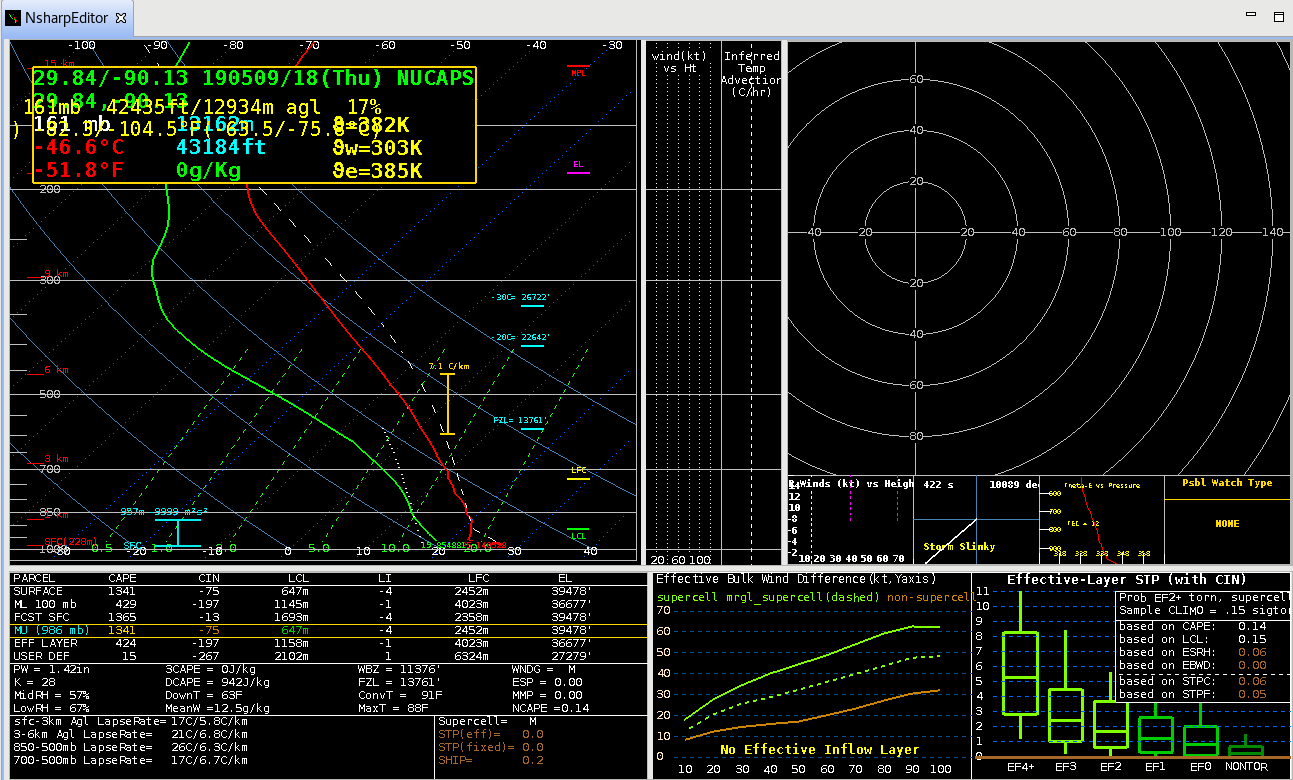
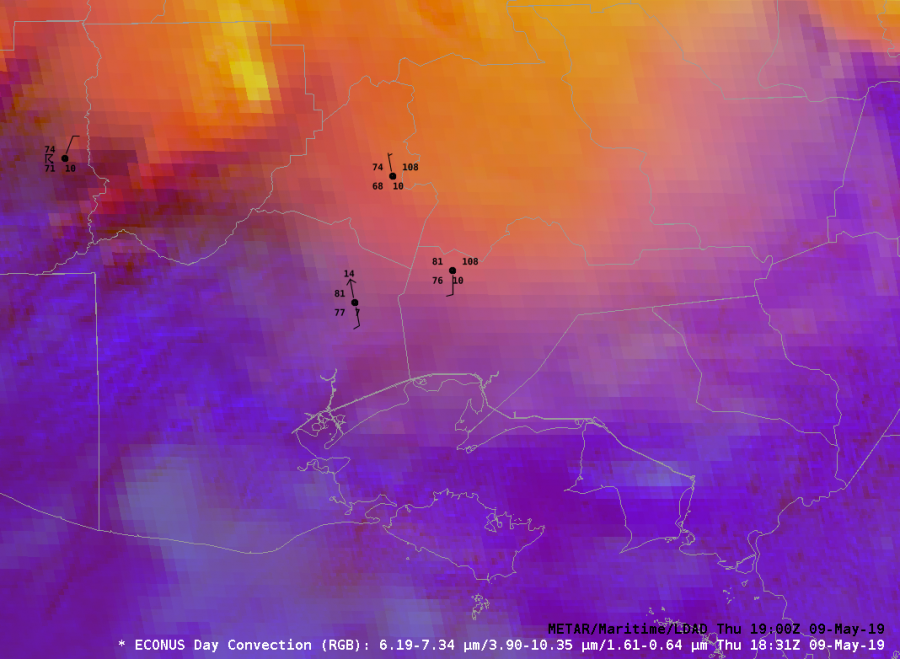
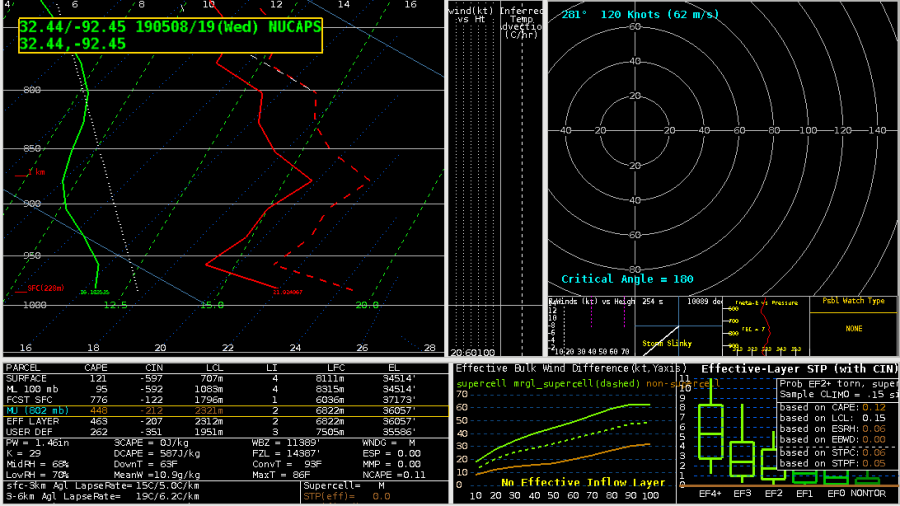
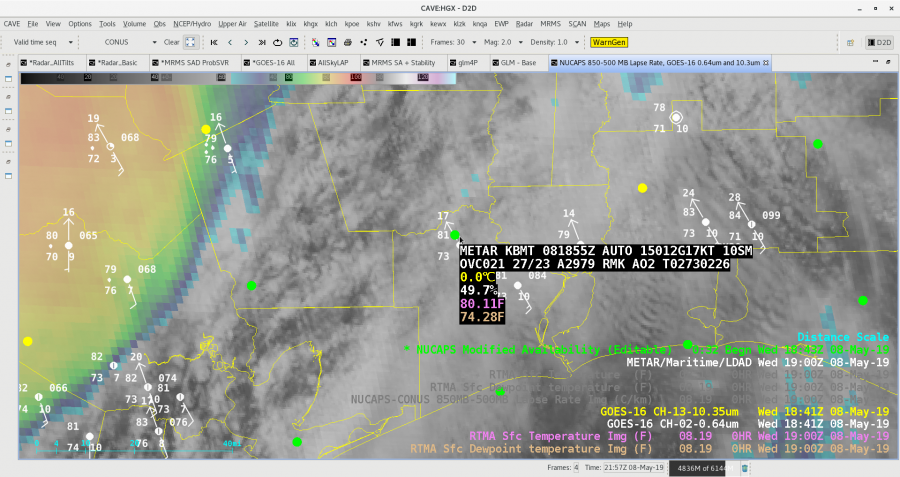
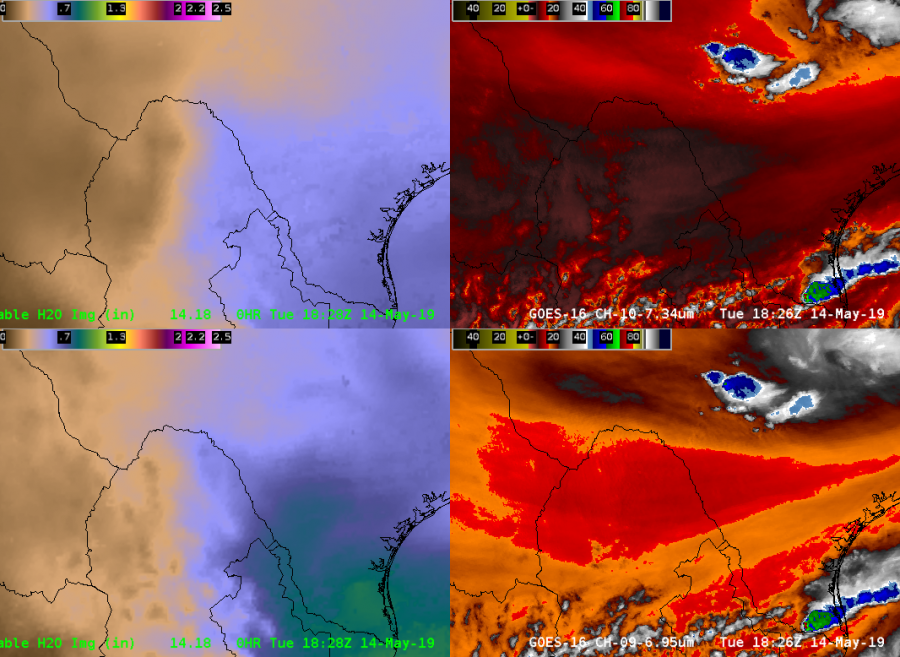
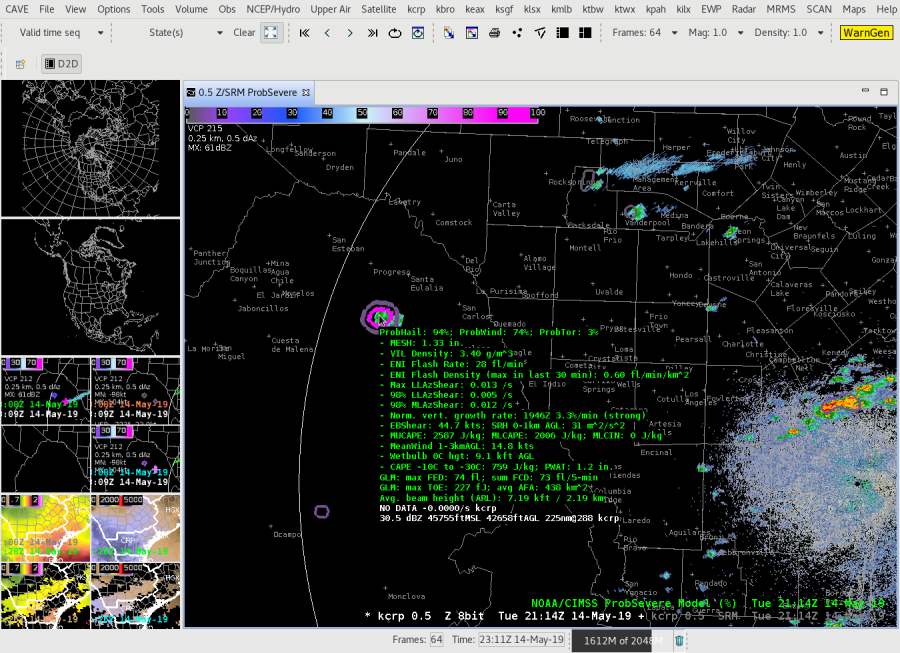
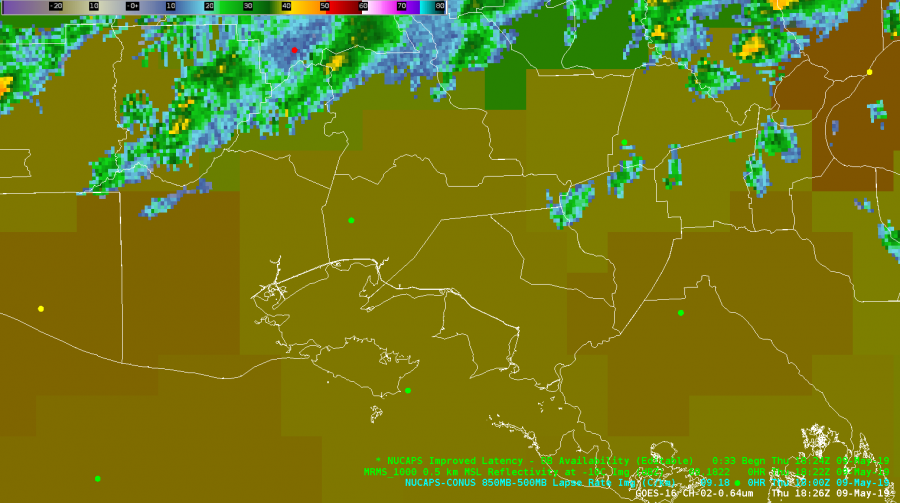 NUCAPS data in advance of convective line today. Iberia County METAR station coincides with NUCAPS operational sounding (modified soundings not available today).