
Knowing that the NUCAPS FCAST information was in today for the first time this week, I decided to do some analysis of the fields. Initial thoughts are that the missing blocks of data (not sure if that is typical – more visible in the CAPE field in top image – similar data holes observed in LCL, LFC and EL) make it hard to have confidence in it at first glance.
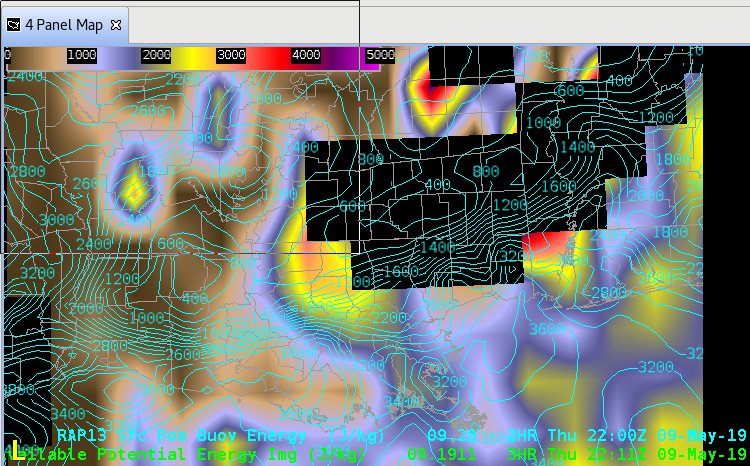
CAPE (Top Image)
NUCAPS FCAST CAPE data isn’t good in the pre-storm environment along the LA coast. RAP13 initialization is overlayed for comparison. RAP13 values are 2500-3500+ and much more representating thatn the NUCAPS values that in some cases are less than 500 ahead of the line.
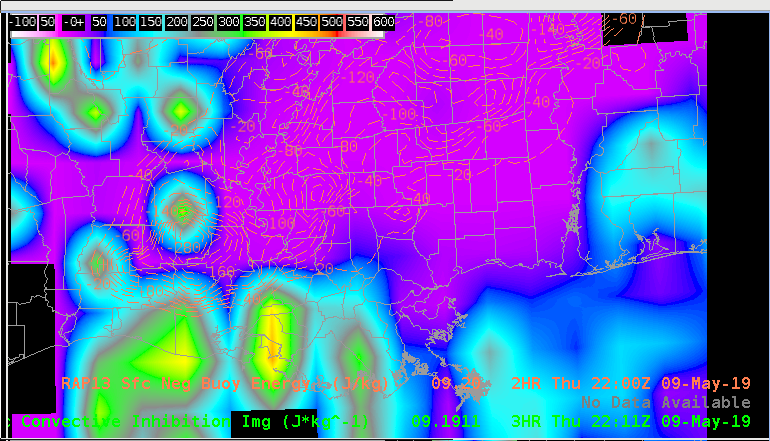
CINH (Lower Image)
While these values appear to be more closely representative compared to the RAP13, the inability of the product to adequately represent the boundary layer at times during the week don’t provide me much confidence for these surface based stability parameters.
-icafunnel