
So, at the map briefing this morning there was a LOT of discussion about yesterday’s event, and the fact that despite the tornadoes that did occur, this was a “bust” of sorts. That is, there wasn’t near the widespread development of supercells that was anticipated. There may be multiple reasons for this, but I thought I’d take an initial look at some data and soundings again from yesterday to see if anything stands out that I happened to miss.
Here’s a sounding (radiosonde) taken from Norman (KOUN) yesterday at 18 UTC 20 May 2019.
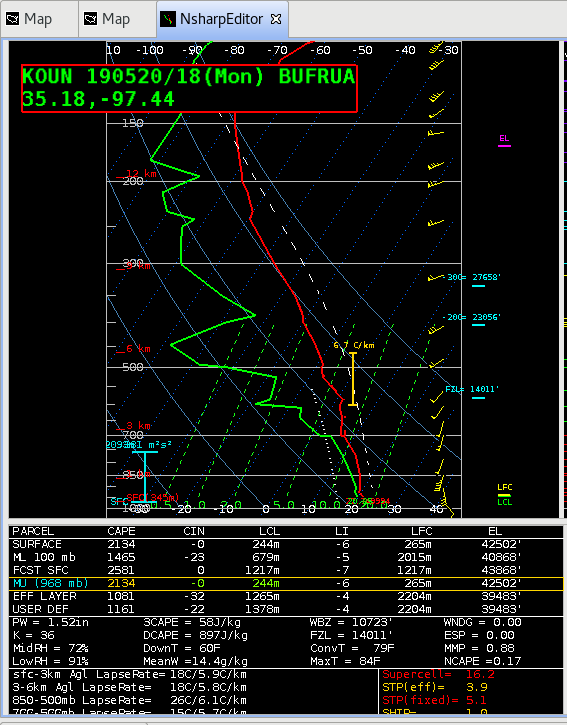
Notice that lapse rates were not particularly steep through the sounding, with 850-500 lapse rates around 6 C/km. Also, notice the deep moist layer from the surface up through ~700 mb, which I’m told that this is rather unusual for this area.
Ok, let’s take a look at a NUCAPS sounding in this proximity taken from the ~20 UTC swath.
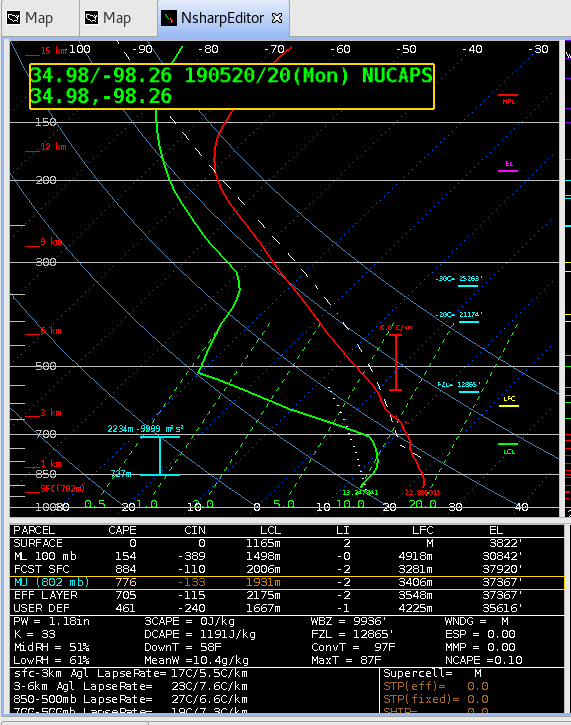
Immediately, I notice that the NUCAPS sounding doesn’t have the deep moist layer that the KOUN sounding showed just about 2 hours earlier. If anything, this layer did not disappear during the 2 hours, it remained, and perhaps even got a bit deeper. The 00 UTC KOUN sounding (not shown) indicated a moist depth up through about 680 mb or so. Ok fine…there’s the limitations with the accuracy of observations in the boundary layer in NUCAPS, but this is still important to capture since many severe weather parameters are derived from the surface or near-surface layers. However, it was noticed that lapse rates aloft were fairly similar, showing lapse rates that were not very steep, about 6.6 C/km in the 850-500 mb layer. The modified sounding (shown next) also didn’t capture the moist boundary layer.
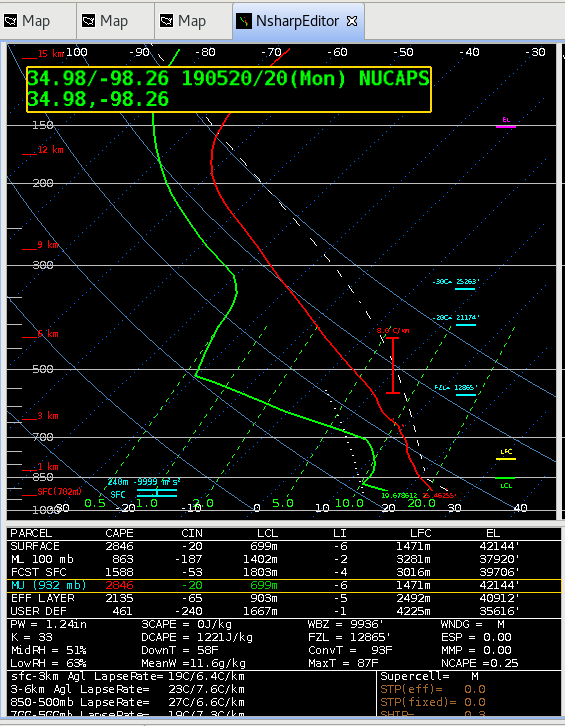
I did want to point out again the good characterization of the mid-layers. Granted, while the NUCAPS soundings didn’t capture every squiggle in the dew point temperature aloft, it did capture the overall character of the moisture profile.
Well, I ended up having to give up my workstation, but perhaps this case should be investigated some more. Although not shown here, the lapse rates and theta-e from my memory did appear to show a relatively large W-E gradient across the area from north Texas into S-Central Ok.
Kris