I initially wanted to compare model data, especially skew-t’s, that I usually use, to the NUCAPS products. My purpose was to ascertain the feasibility of replacing or supplementing point based model products with NUCAPS. As I was unable to access the model data I use daily I decided to compare NUCAPS with NAM and GFS.
First the comparisons in the rapidly changing thunderstorm environment in which I interrogated a large MCS over the Illinois/Indiana border.
I compared NUCAPS 18z skew-t (from clear air area) to NAM and GFS skew-t’s, at the same time and location.
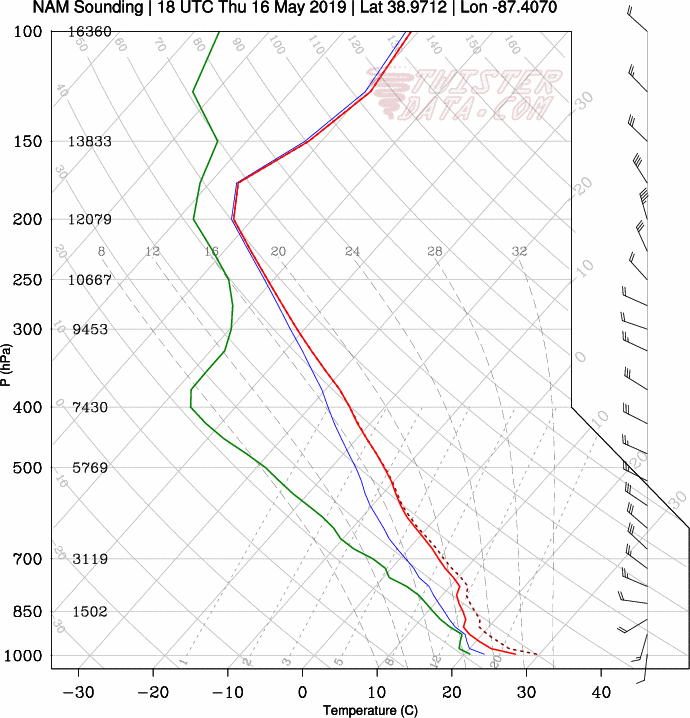

NUCAPS presents a much more stable and dry environment than the model skew-t shows, and also much more stable than the actual current environment considering this storm has already produced hail, tornadoes and heavy rain.
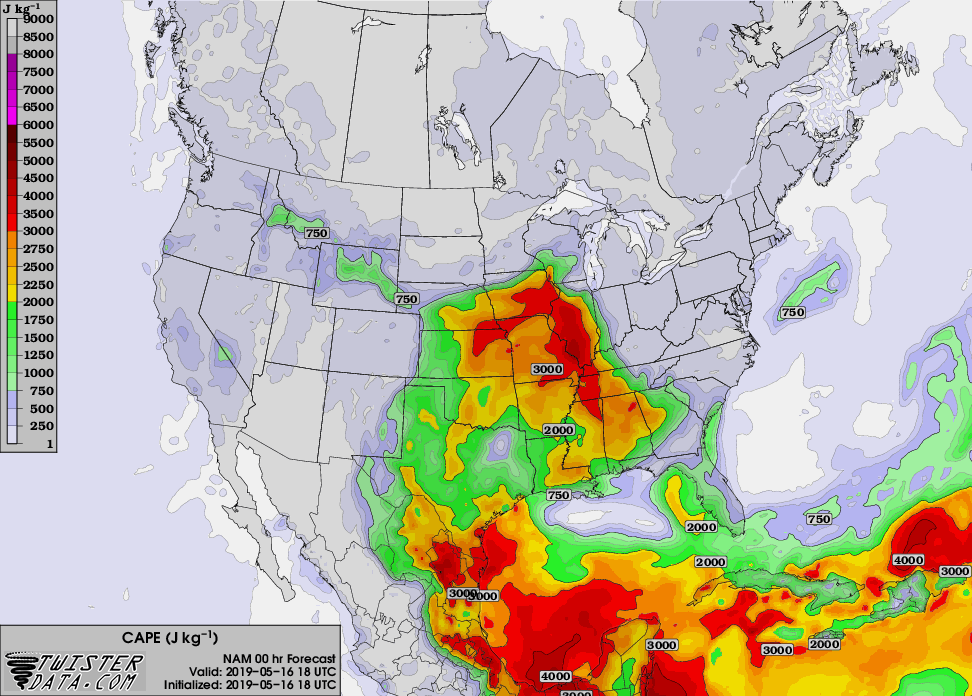
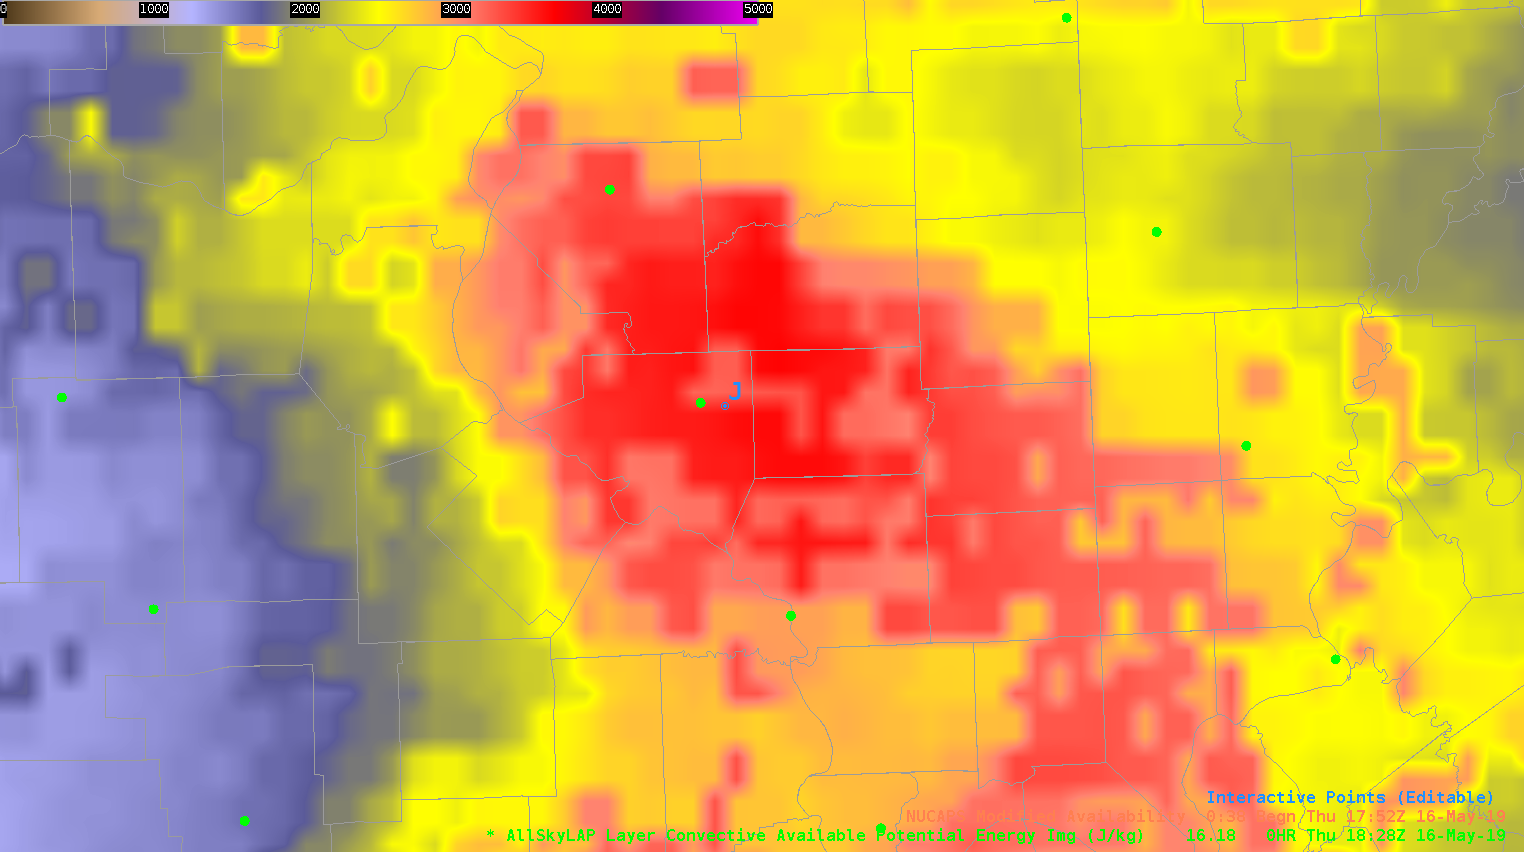 Next, I compared an AllSkyLAP CAPE img at 18z (point J on the above picture), to a NAM CAPE map over the same area/time. AllSkyLAP seems to be about 500J/kg higher than the NAM CAPE map.
Finally, I compared a NUCAPS CAPE img and the NUCAPS Skew-T at 18z over the same area and there was a huge variance. The skew-t was higher than the CAPE img by over 1300J/kg.
Lastly I decided to compare NUCAPS and model data from a stable area, non changing area.
I compared an observed skew-t from the KS/OK boarder to a NUCAPS skew-t. There is a one hour difference in the data but for the sake of this comparison I think this will work. 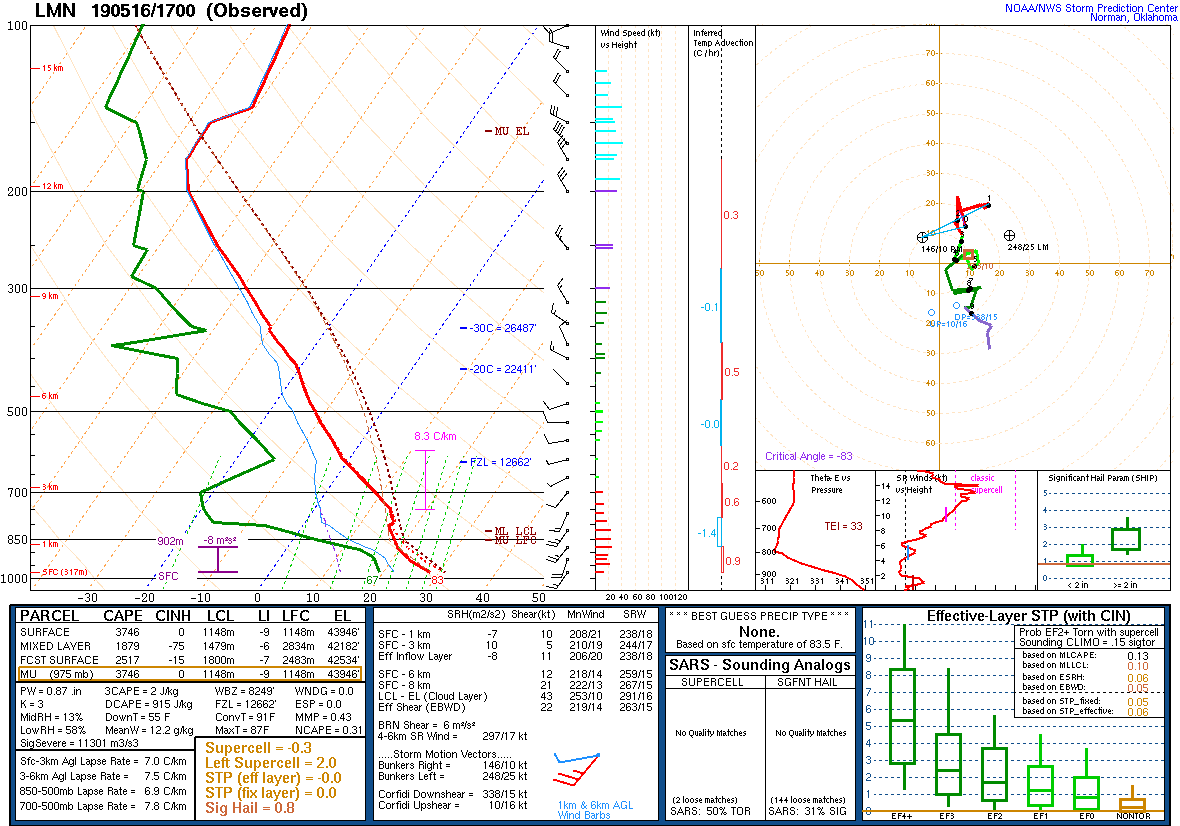
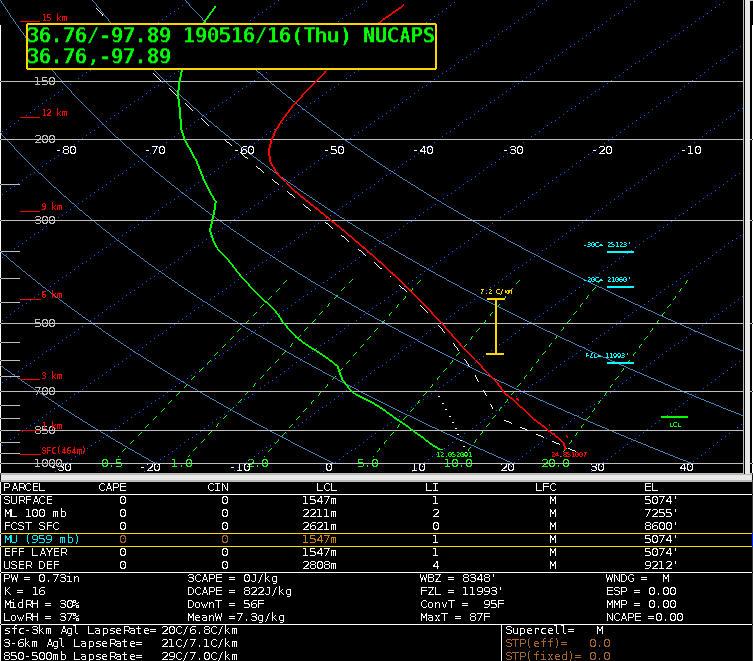
The observed skew-t is a relatively dry column with .87pw and a T/D of 31/20C at the surface and 10/-20C at 700mb. The CAPE is at a ridiculous 3746 J/kg. But with no moisture, lifting mechanism nor shear I wouldn’t expect development. When compared to the NUCAPS skew-t one can see a definitive difference. CAPE on the NUCAPS is at 0 with T/D at 24/11C at the surface and 7.9/-9.3C at 700MB which is a huge departure from what the observed skew-t showed…but how would the observed skew-t hold up to a model skew-t?
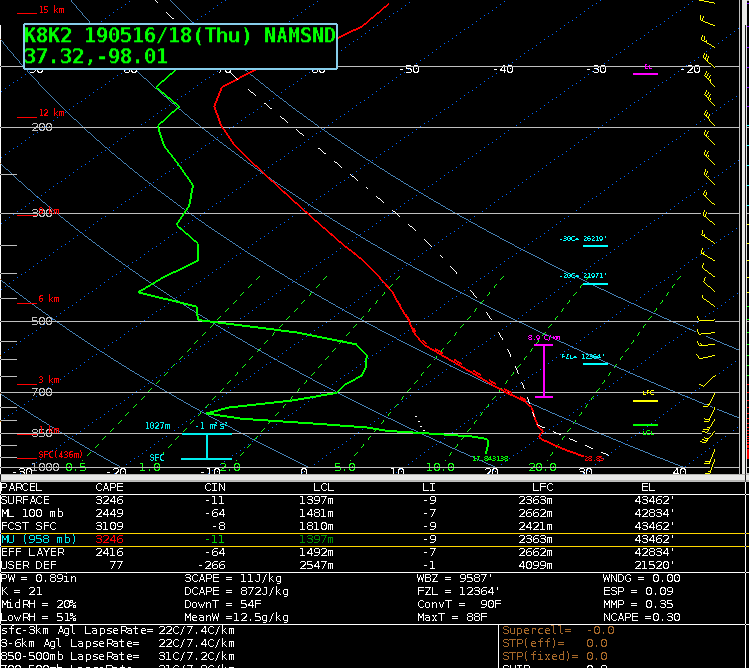 NAM 18Z model skew-t compared to the 17Z observed skew-t from the same area shows 28/17C SFC temps, only 3C off from the observed skew-t and at 700MB NAM shows 9.5/-8C only .5C off the temperature and 11 off the DP. Also, CAPE was much closer than when compared to the NUCAPS where SFC CAPE on the NAM is 3246J/kg and 3746J/kg on the observed.
Overall, after this small sample size of data, both severe weather and in clear weather, I believe that I would continue to use NAM/GFS over NUCAPS for my point based forecast needs.
***DESMOND***
