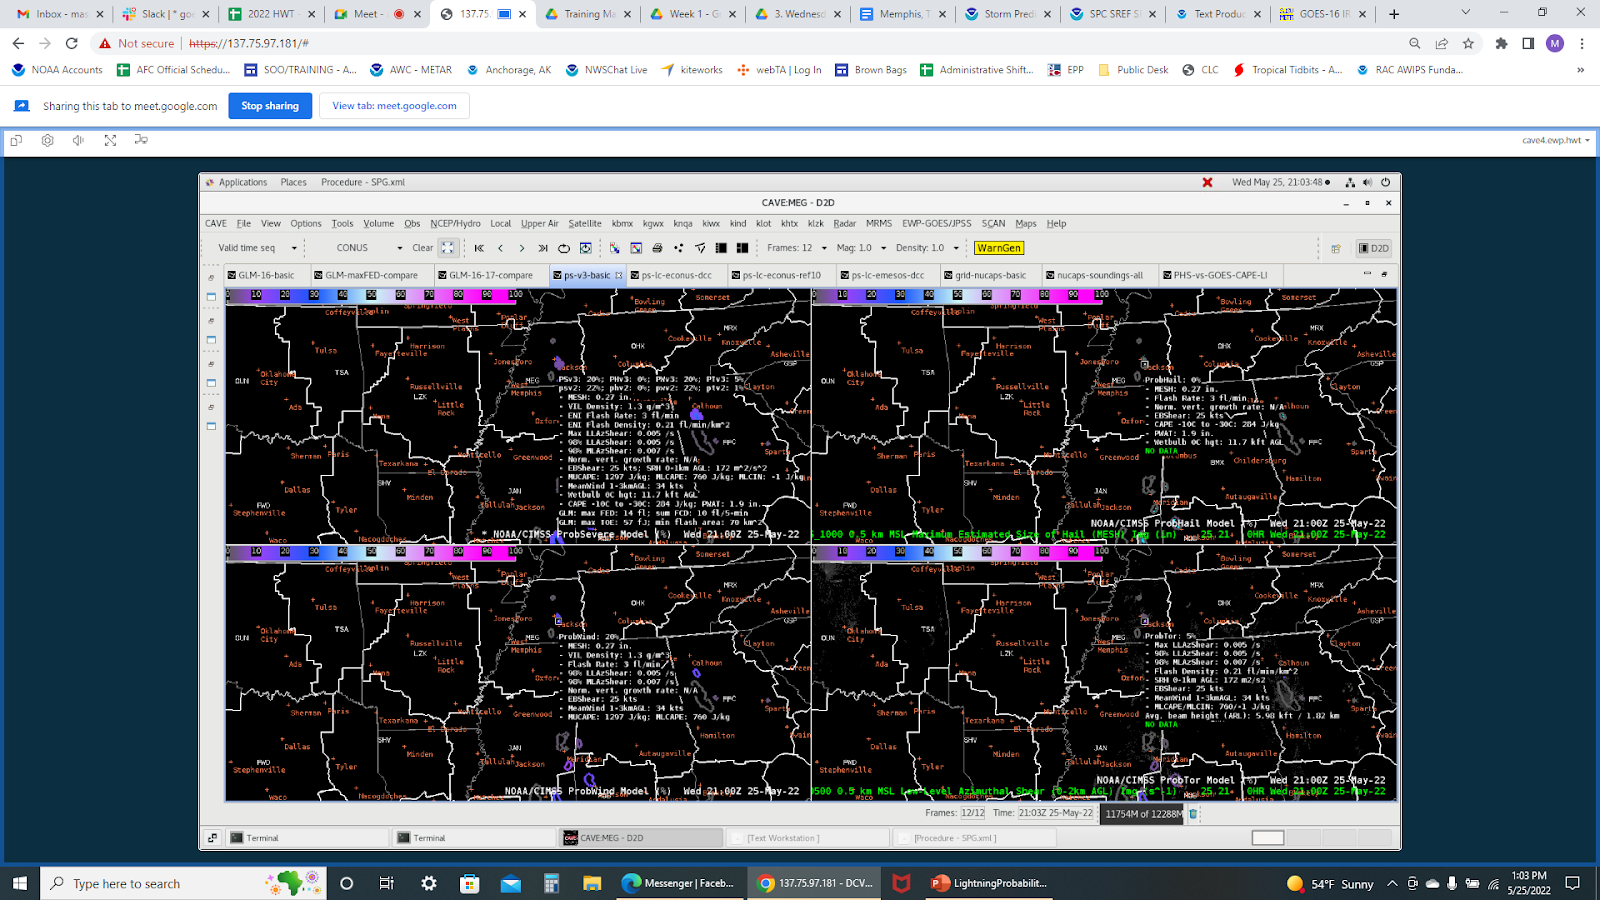
Memphis, TN Synopsis

Synopsis

An upper low and cold front is expected to move across the lower MS Valley. As the upper low moves east today, weak shortwaves embedded in southwest flow will lead to a marginal risk of thunderstorms as they form along and ahead of the front over the Memphis region. The main concern was a moderate risk of excessive rainfall for this afternoon/evening.

IR imagery. Upper low located near the OK Panhandle.

Surface analysis map of the surface low and attendant front.

Surface observations as of 4:00PM CDT.

SPC Day 1 Convective placing TN at a marginal risk.

MLCAPE ~500 J/kg.

PHS displaying weak CAPE/LI values and a well-defined dry line just west of AR.

WFO Memphis headlining excessive rainfall outlook.

WFO Memphis headlining marginal risk of severe storms.

Most of the severe storms were east and south of our area of interest shown here with GLM.

GLM overlaid with Radar.

GLM overlaid with satellite imagery.

LightningCast

ProbSevere3 showing a low risk of thunderstorms.

Optical Flow winds show an area of divergence over eastern and southern AR/TN border.

Vortex Power

BMX – Daily Updates

GLM proved useful early on in combination with MRMS VII. It showed areas of strengthening storms that were reflected in radar later. A pair of severe warnings were then issued.

This was a good prob severe null case where odds remained steady along with stationary or declining GLM values. A correct no-issuance followed even with base velocity showing 50 kts or so of wind on the lowest scan. Some other prob severe oddities occurred during the day such as odd object tracking and weird percentage changes. QLCS tornado odds seemed too low as discussed. Overall though, it continues to provide useful information.

The PHS forecast again correctly identified the highest risk areas where storms strengthened and tracked. It mirrored other sources so I would still like to see if overall it is better or not.

Prob severe highlighted this storm ahead of time before it went severe in Mobile’s area.

NUCAPS provided limited use today. Overall, heavy cloud cover limited usefulness of a number of products compared to the clearer case in Texas the day before.

Some Random Guy

MAF Testbed Observations

ProbSevere v3

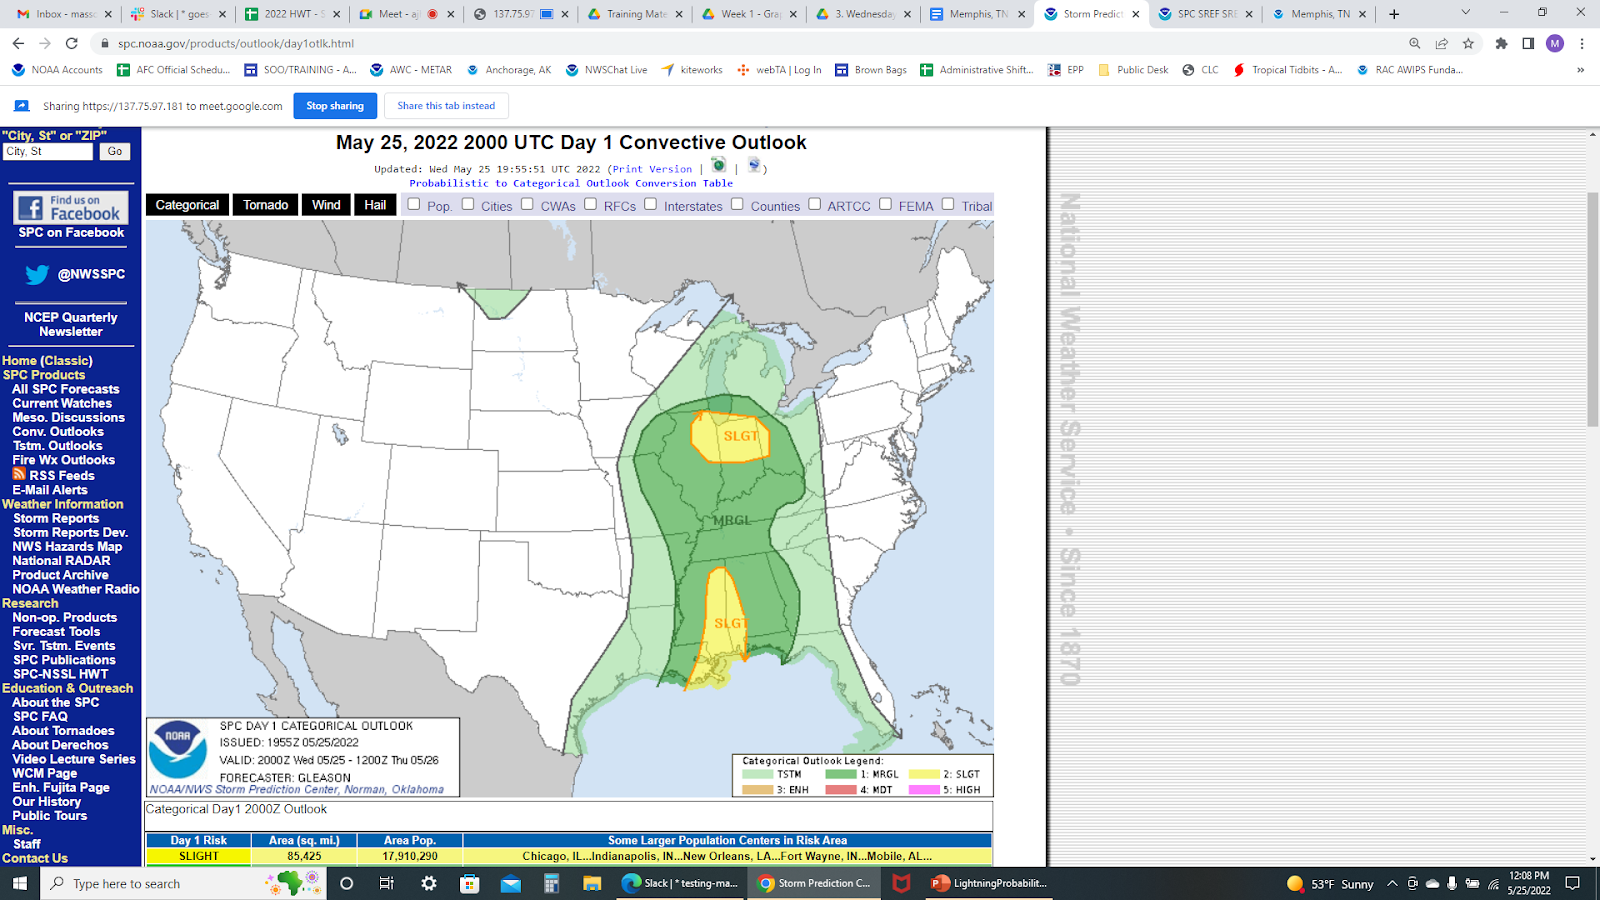
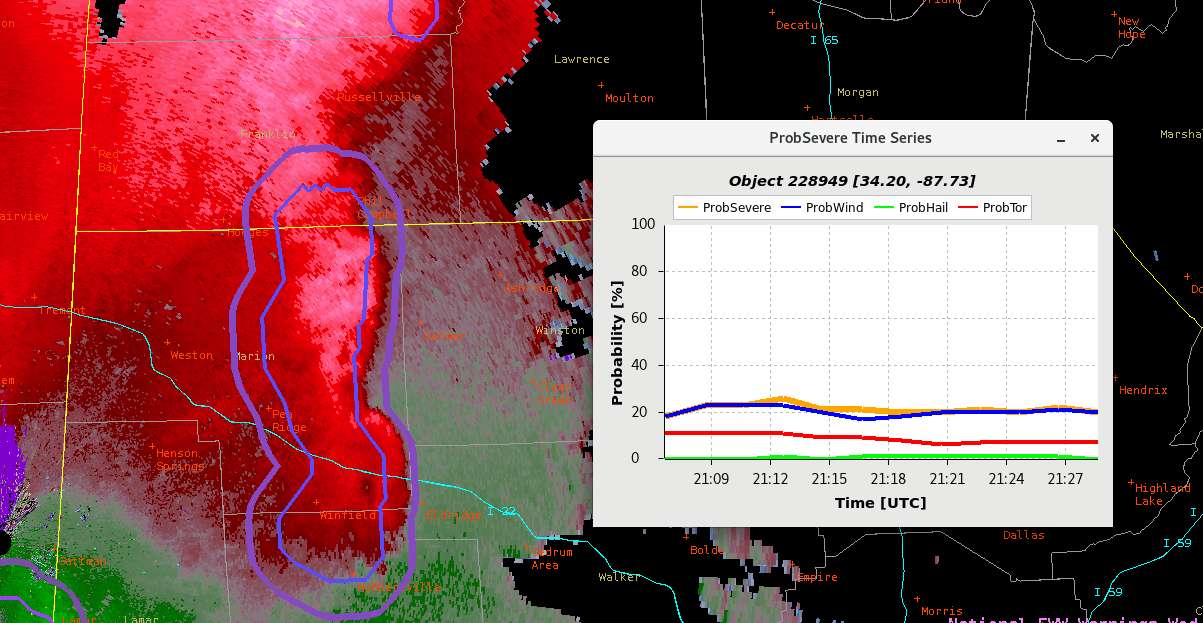
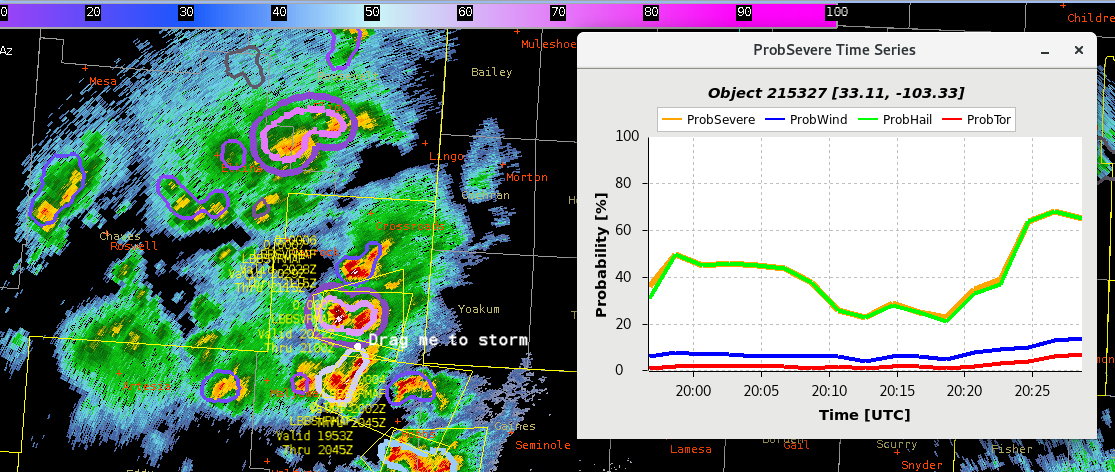
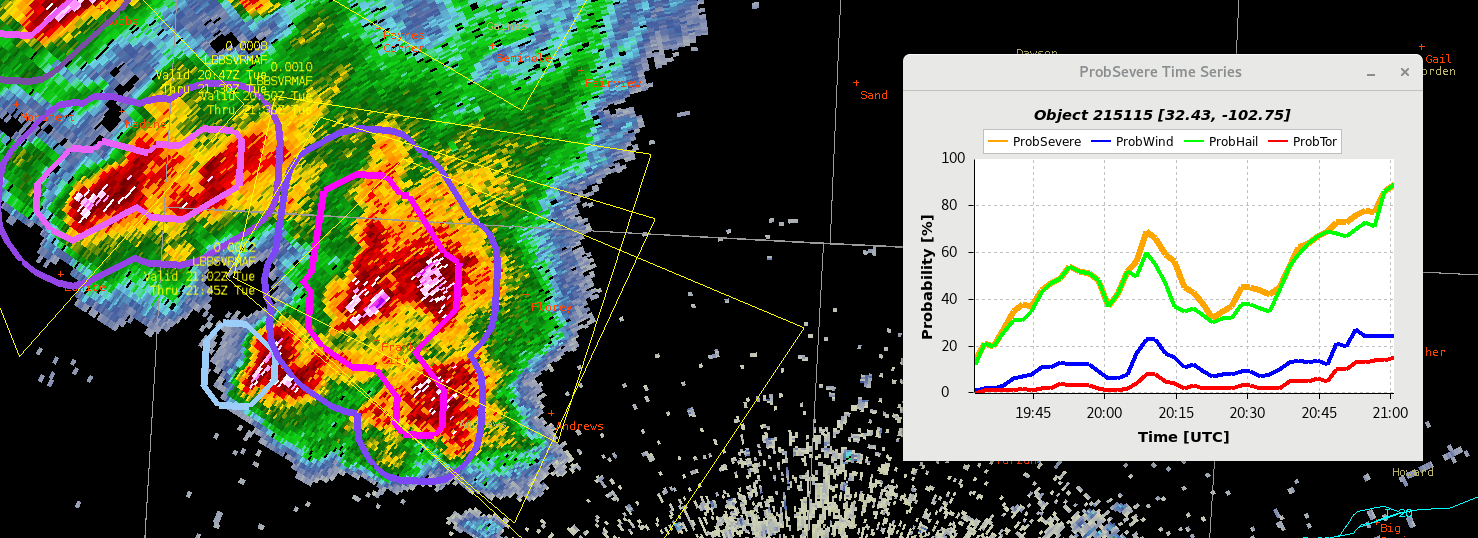
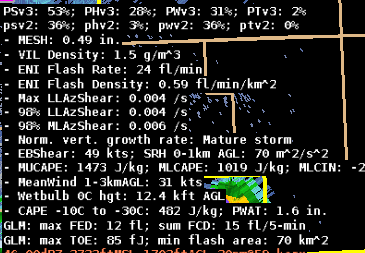
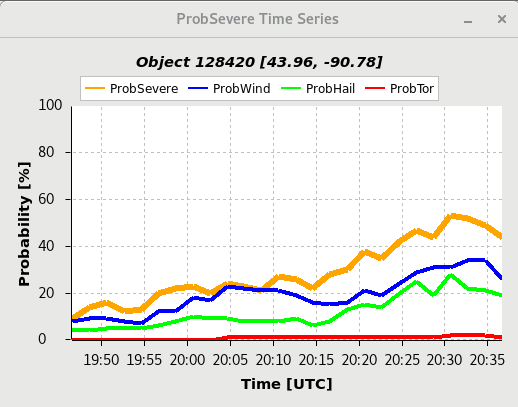
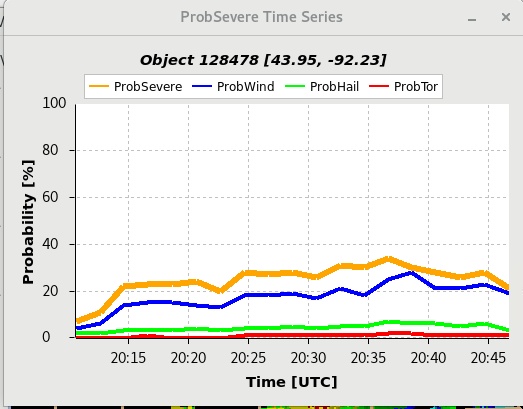
For the initiation of convective storms, I found that the ProbSevere performed the best over the other products available to me today. I have seen over the last couple of days that the best use of ProbSevere is the trend table. The steep increase in these total severe values support radar trends that suggest a warning is necessary. For the initial warning on severe storms, this was the best use.

The only negative to this product was the latency. While the latency was only on the order of 2-5 minutes, this was equivalent to appx. 2 radar scans that indicated to me ahead of time that this storm was strengthening. This can lead to some confusion especially if the storm is quickly pulsing and falling.

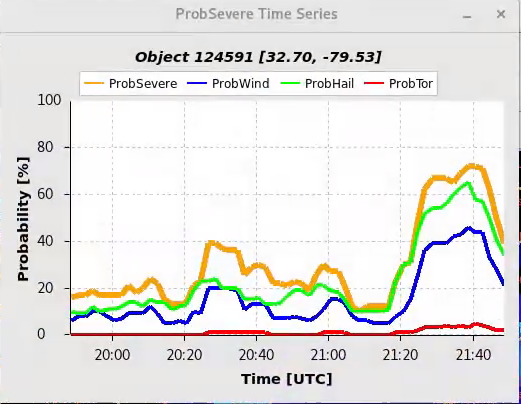
Additional upticks were noticed in subsequent SVR issuances throughout the afternoon that provided a nice heads-up in conjunction with the radar data. These were used in the context of the storm maintaining its strength after the storm was warned and again after the storm re-pulsed several minutes later.

It is also worth mentioning that the perceived threat of ProbSevere was also the shared opinion of the forecast (forecaster perceived threat for hail had the highest ProbS. probability). Once the storms reach the “cap” of their ProbSevere, it becomes of little use.
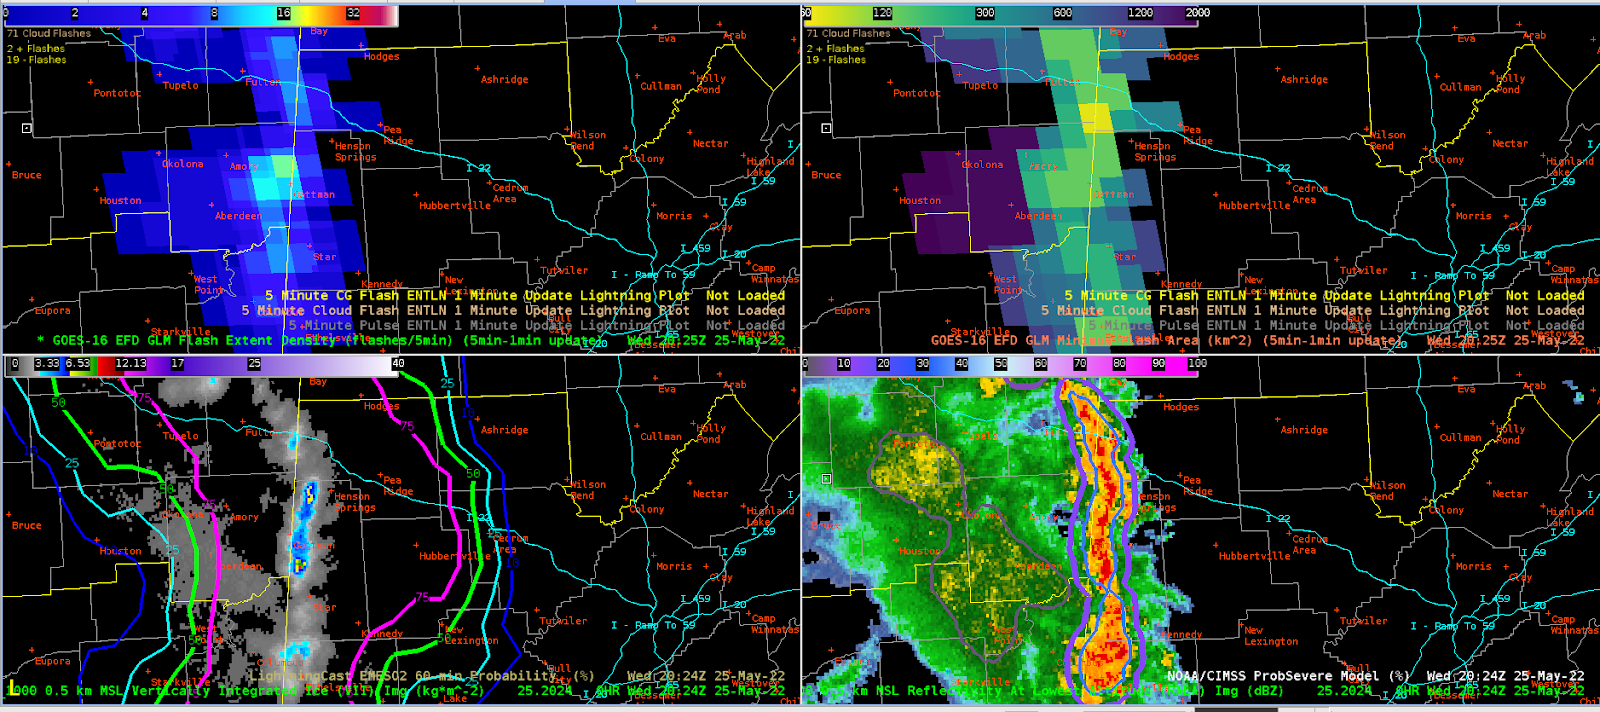
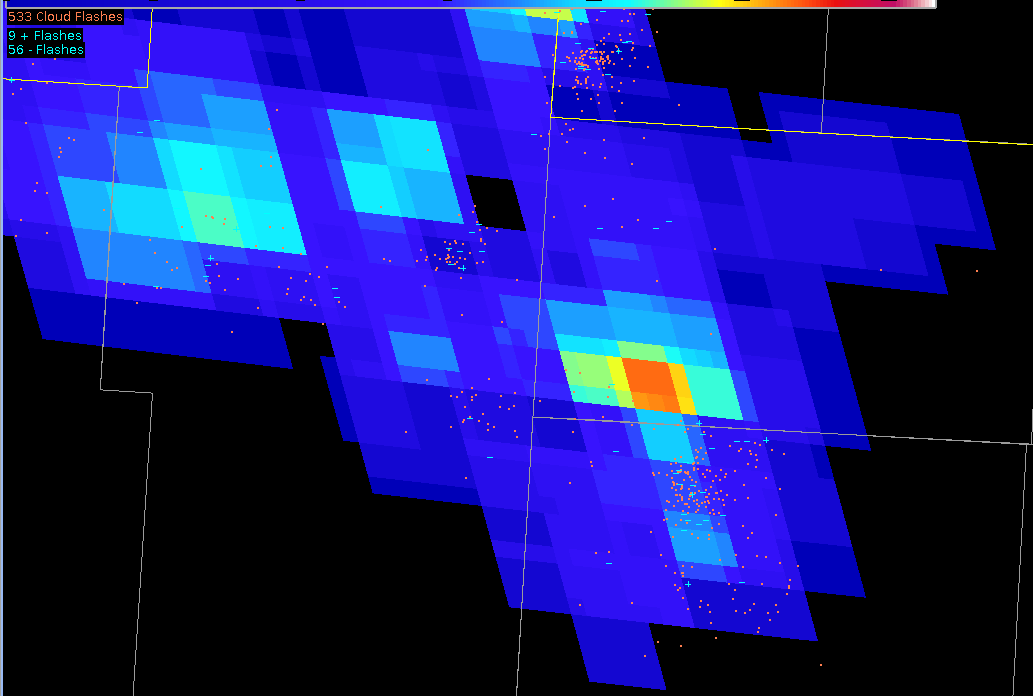
GLM

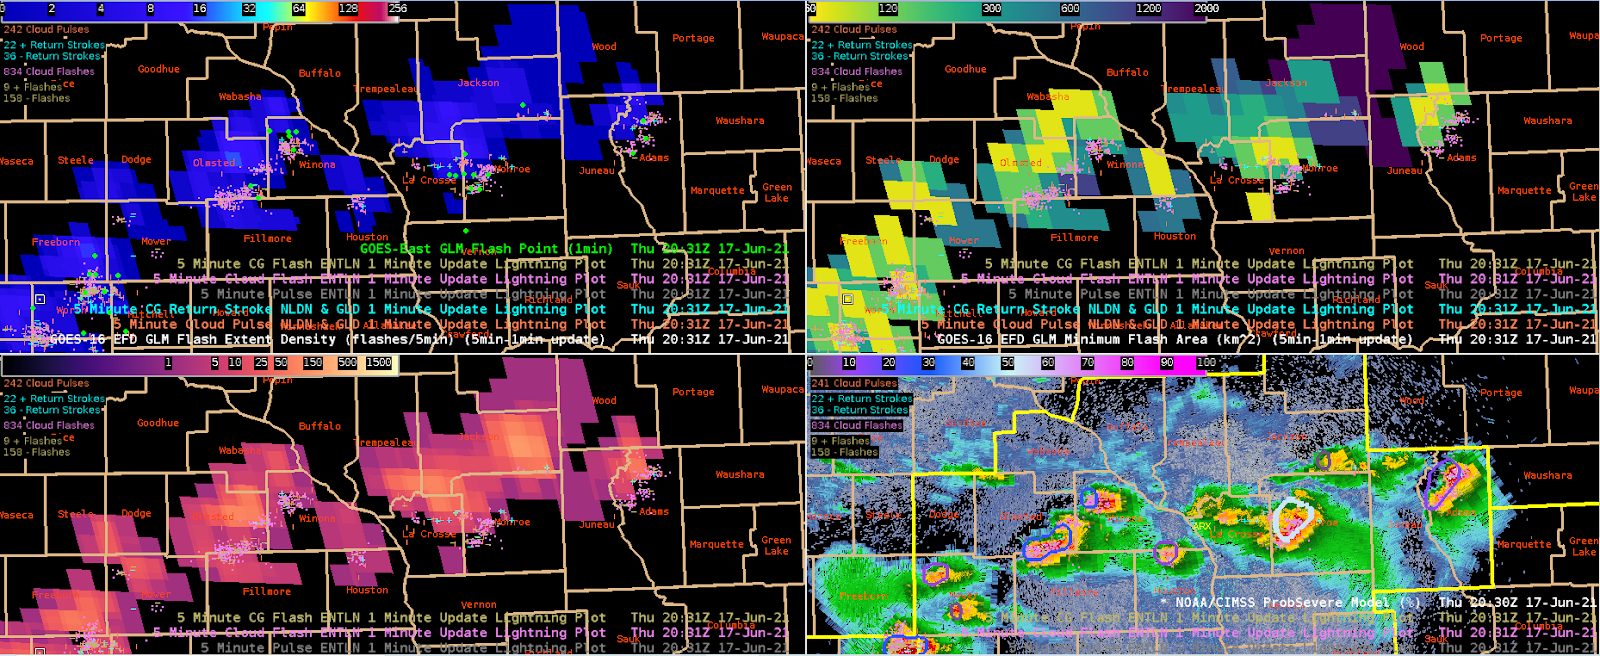
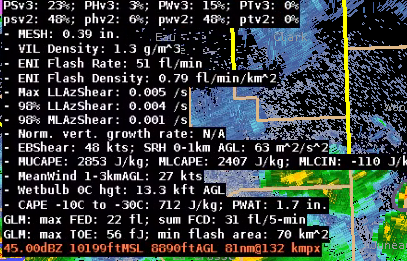
GLM was useful during convective initiation, but did best for storms that were already at the peak of the ProbSevere threshold. GLM showed additional pulses in a mature storm that had a 90% probability of being severe and added confidence to the warning forecaster that the storm had gained additional strength which manifested itself in larger hail for example.
It was however short-lived as the storm gained additional intensity but did not show the corresponding increase in GLM FED that one would expect. This was explained as a limitation due to the structure of a mature (and severe) thunderstorm.
Min Flash Area also reached its lower values on several storms which provided little to no additional data. Maybe this used in conjunction with total optical energy would be useful, but this yielded no significant results when investigating briefly.
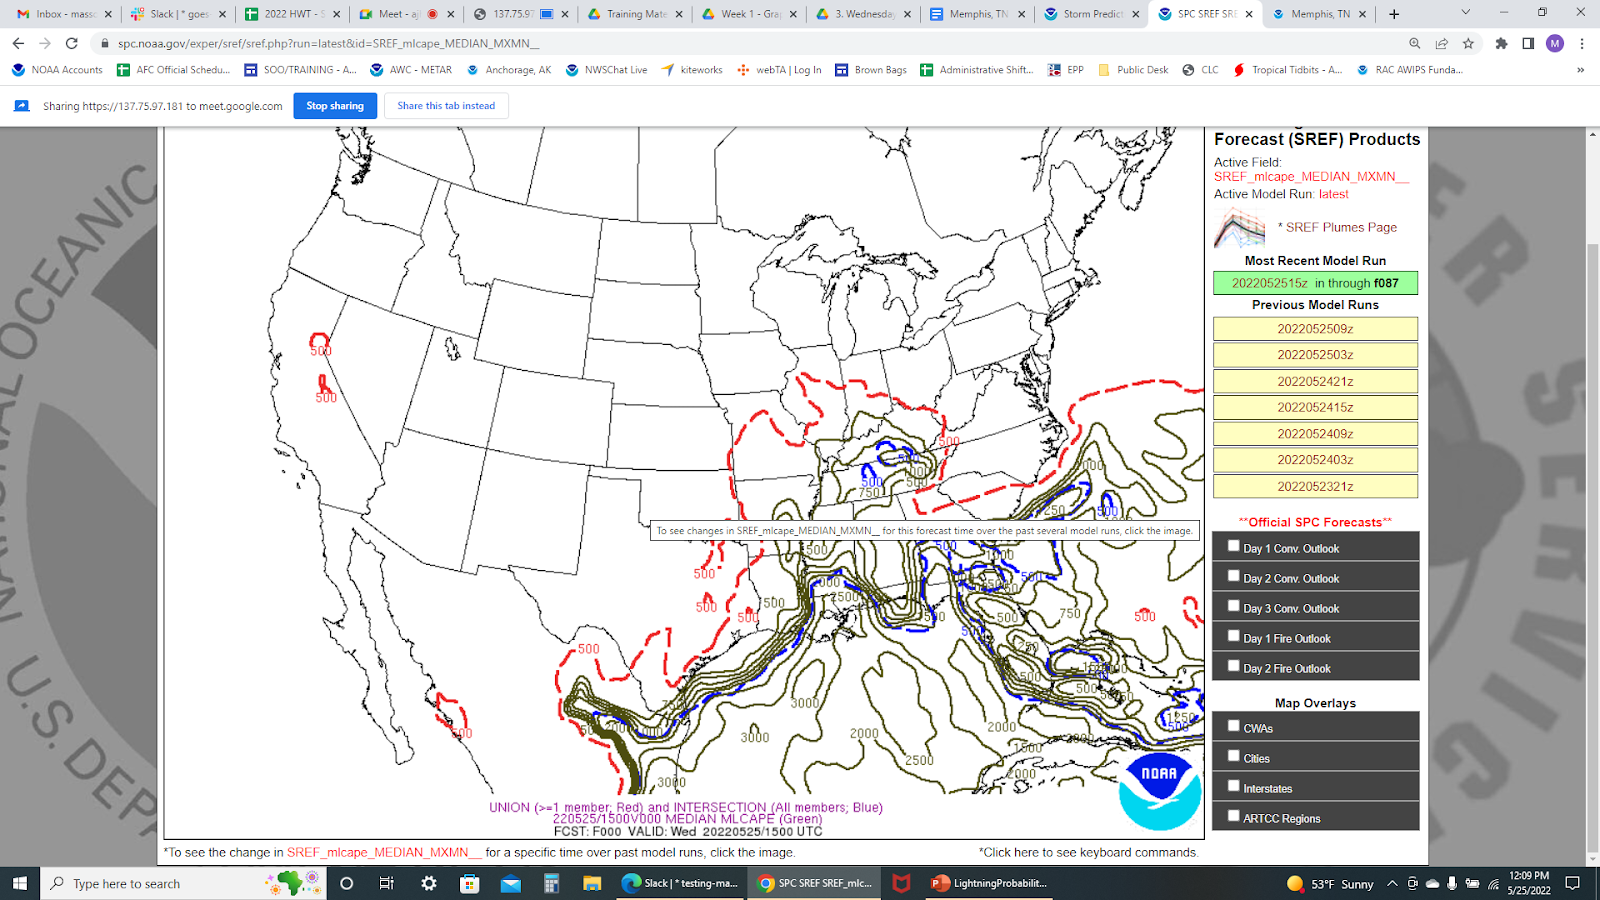
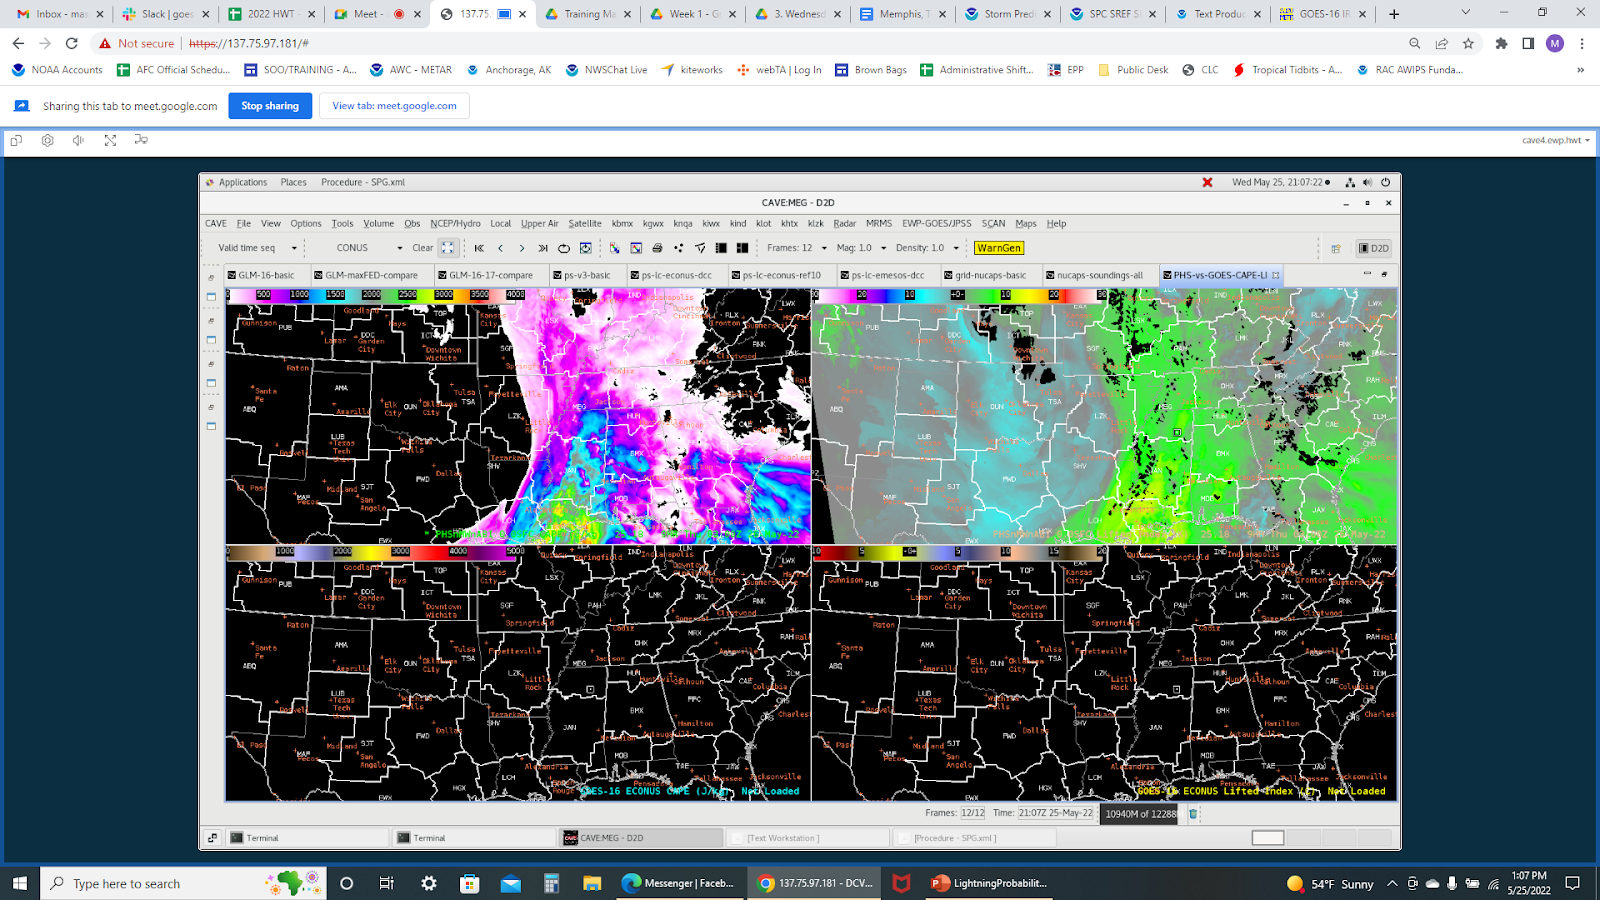
PHS Model

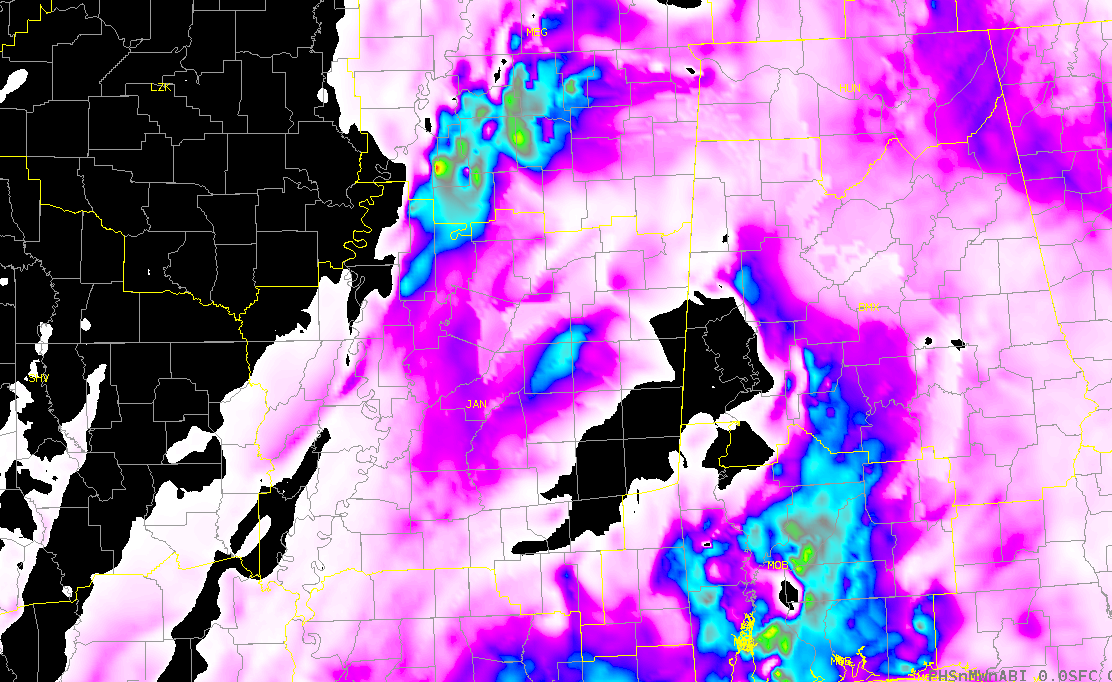
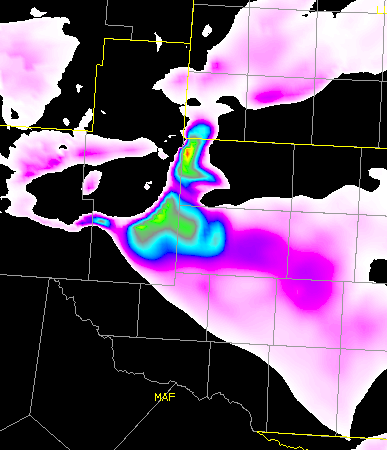
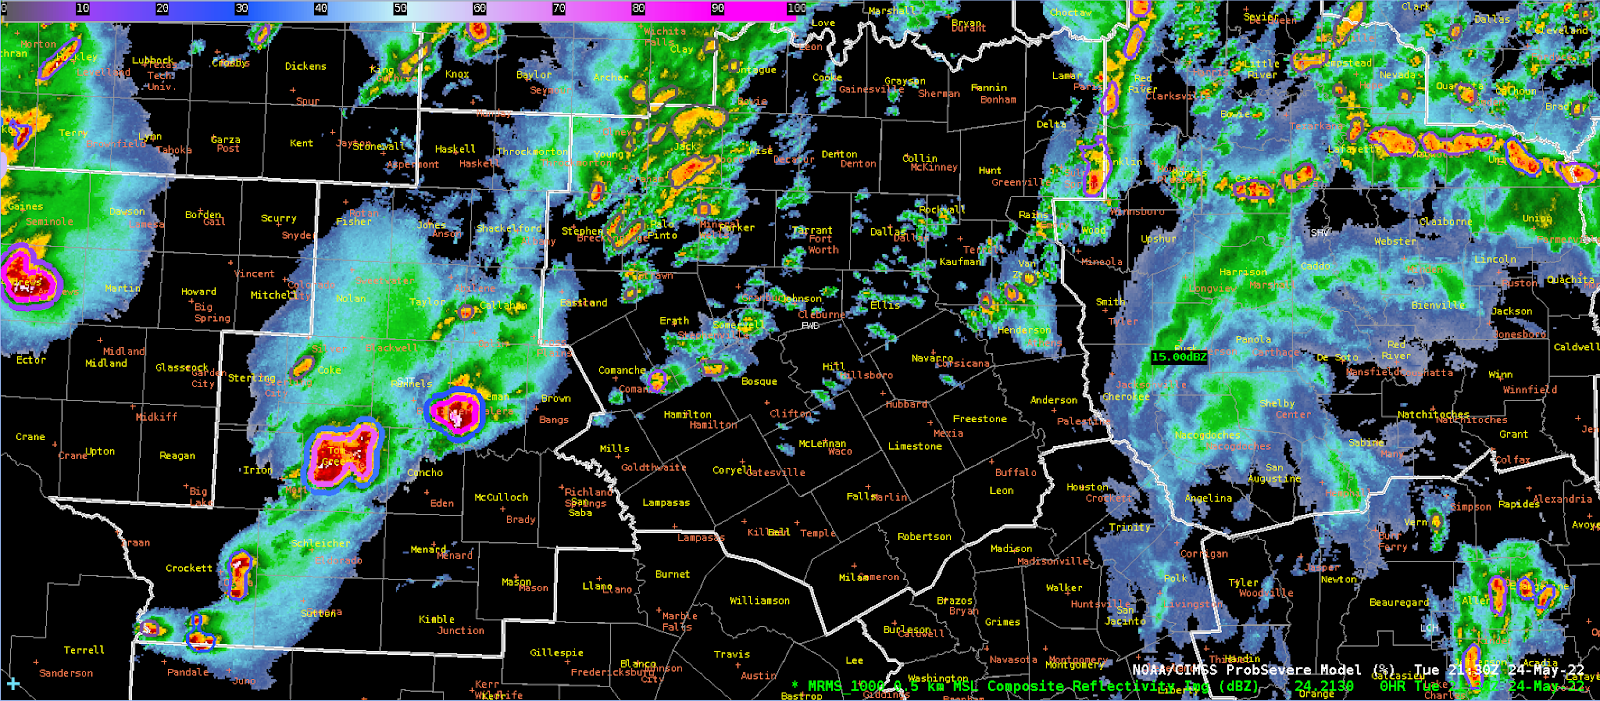
The PHS model was very useful today ahead of convective initiation, but more so in an advective situation.
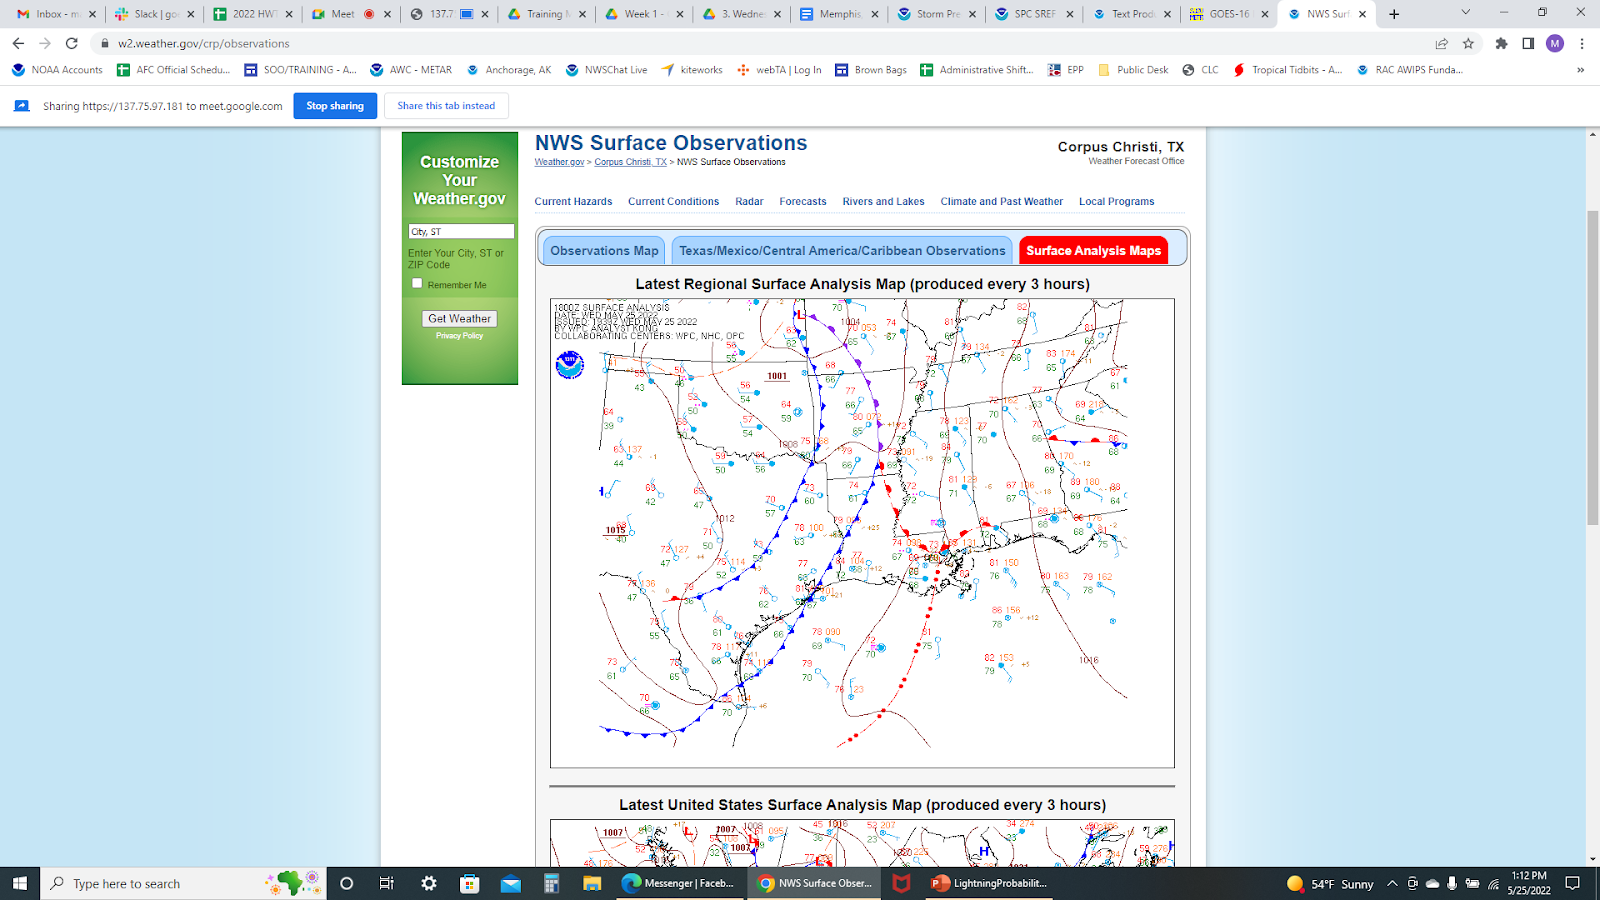
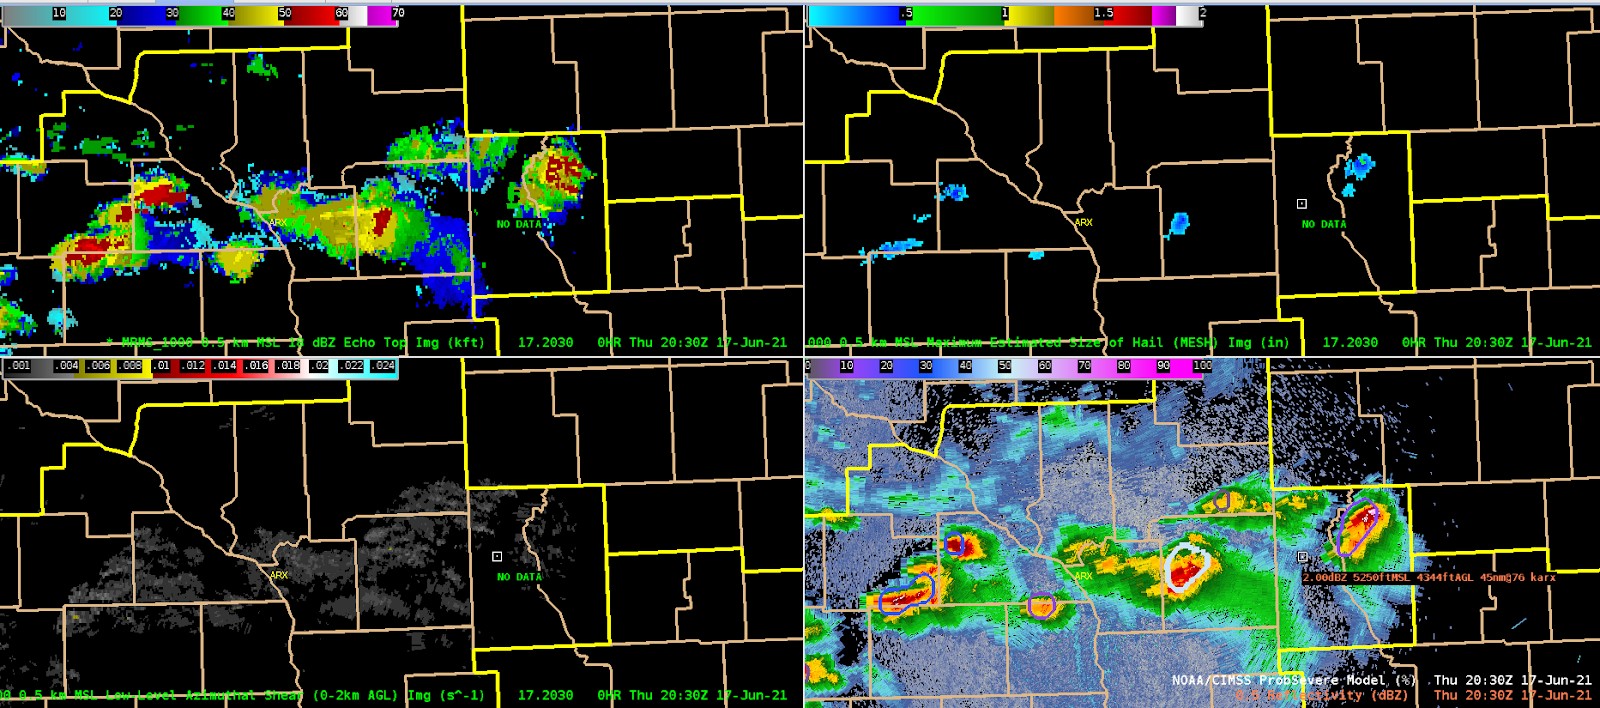
Instability parameters were observed as ongoing severe storms moved SW toward the established instability gradient. ProbSevere outlined areas are moving SW in the image below across an area of relatively high CAPE and low LIs. This provided useful information about the existence of a boundary and the motion of the storms along with the pre-conditioned environment.
The model did have limitations as the storms became ingested into the later runs of the model and the storms showed developed cold pools. The environment depicted in this situation had become dominated by nearby cold pools of incorrectly placed convection which limited the model’s usefulness.
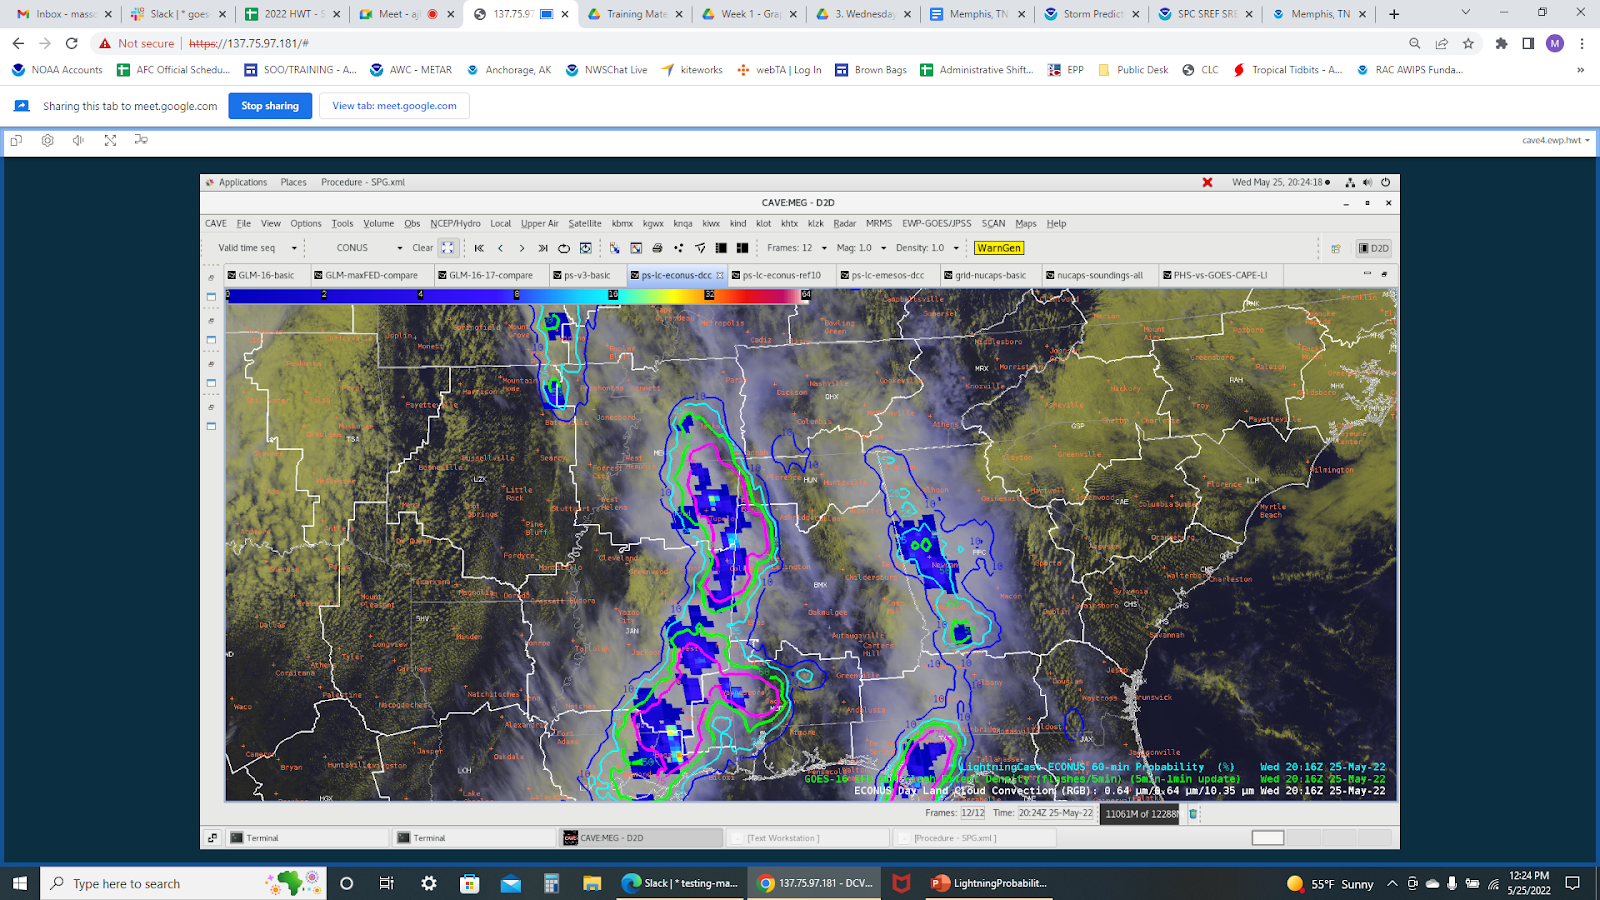
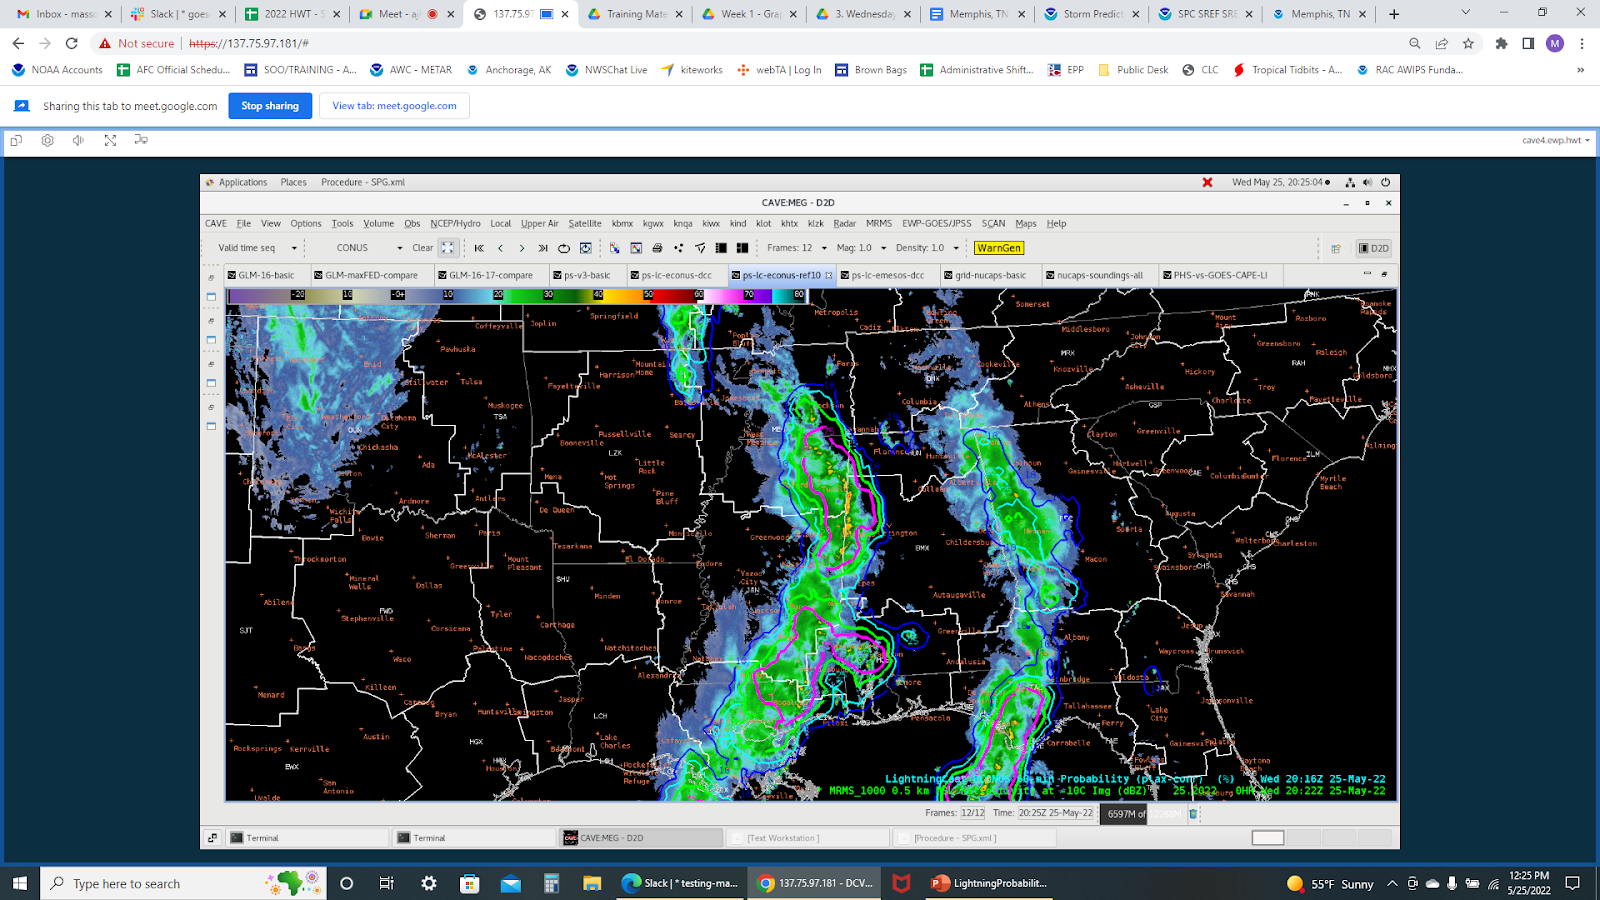
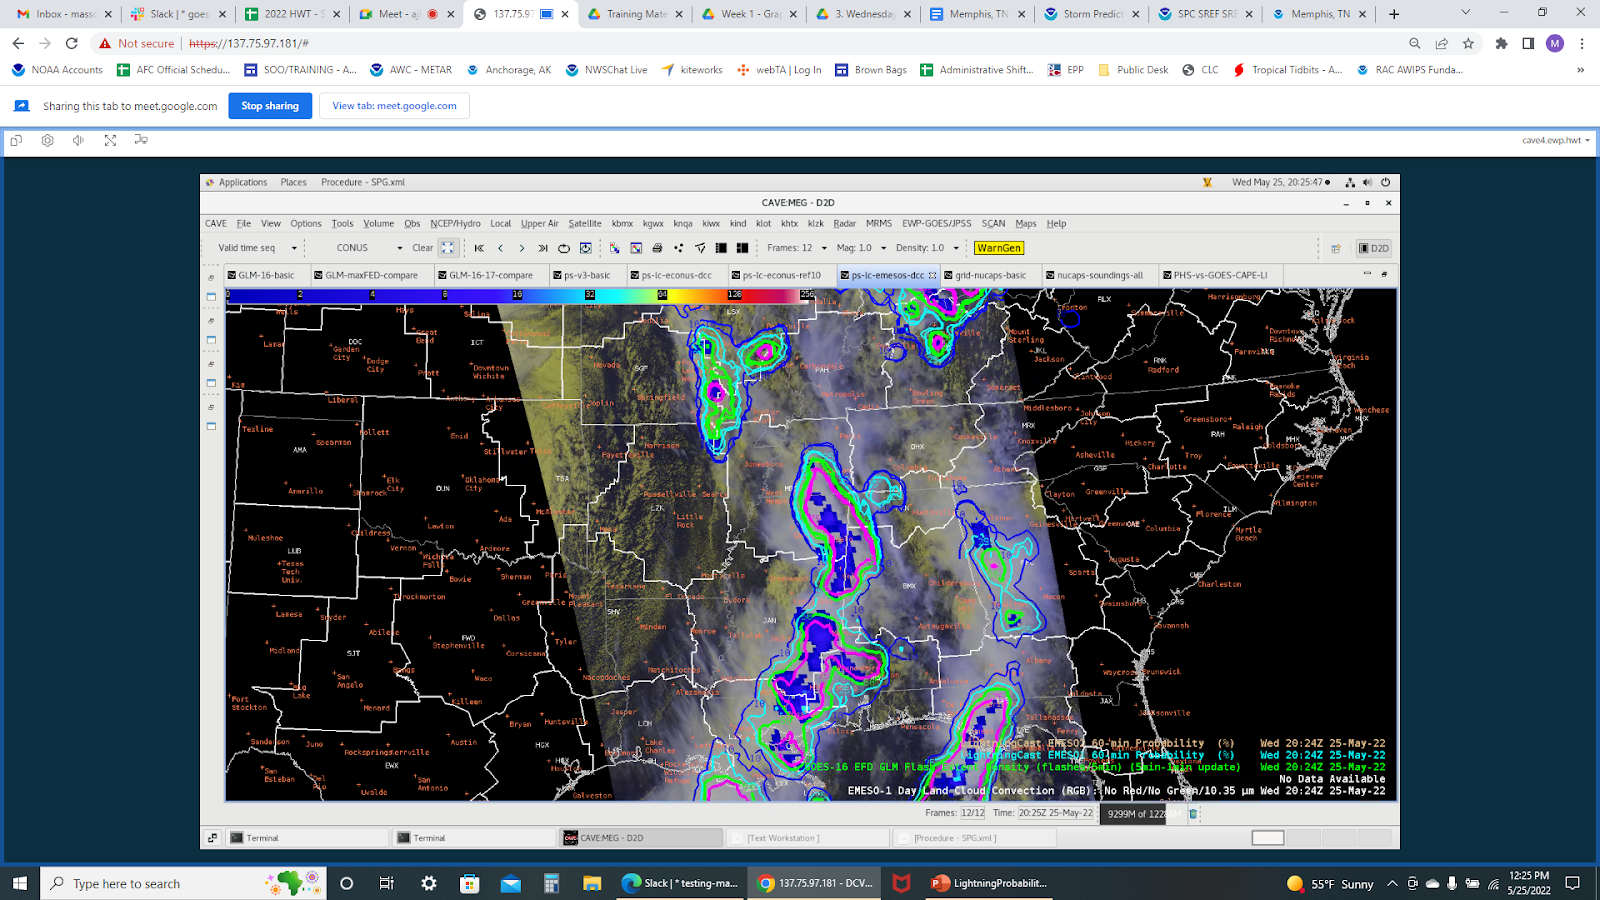
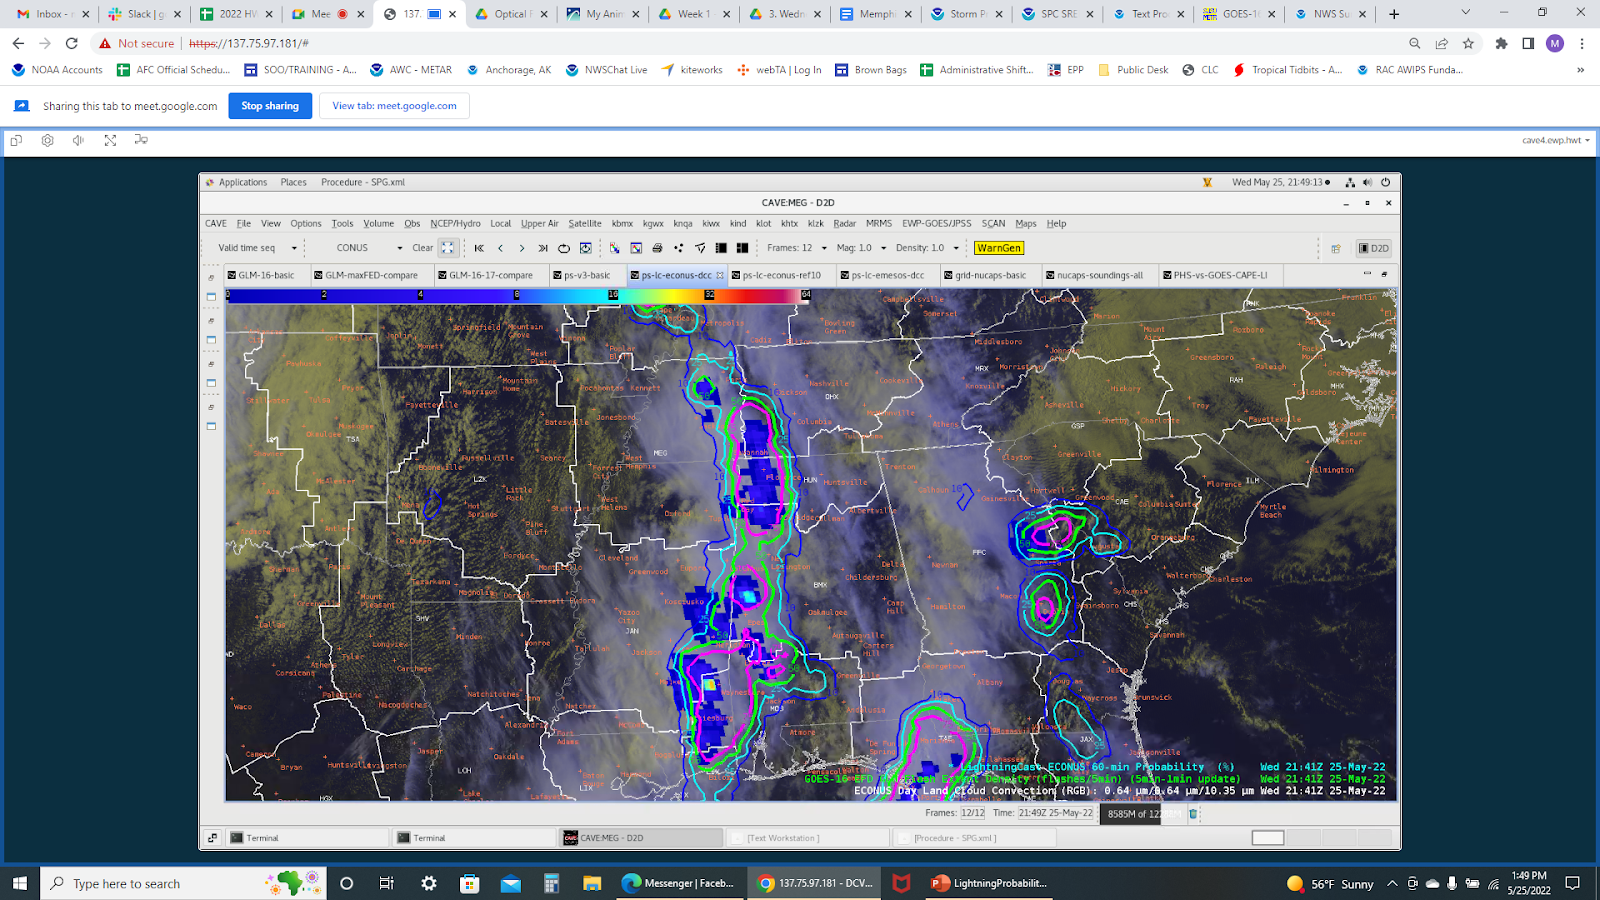
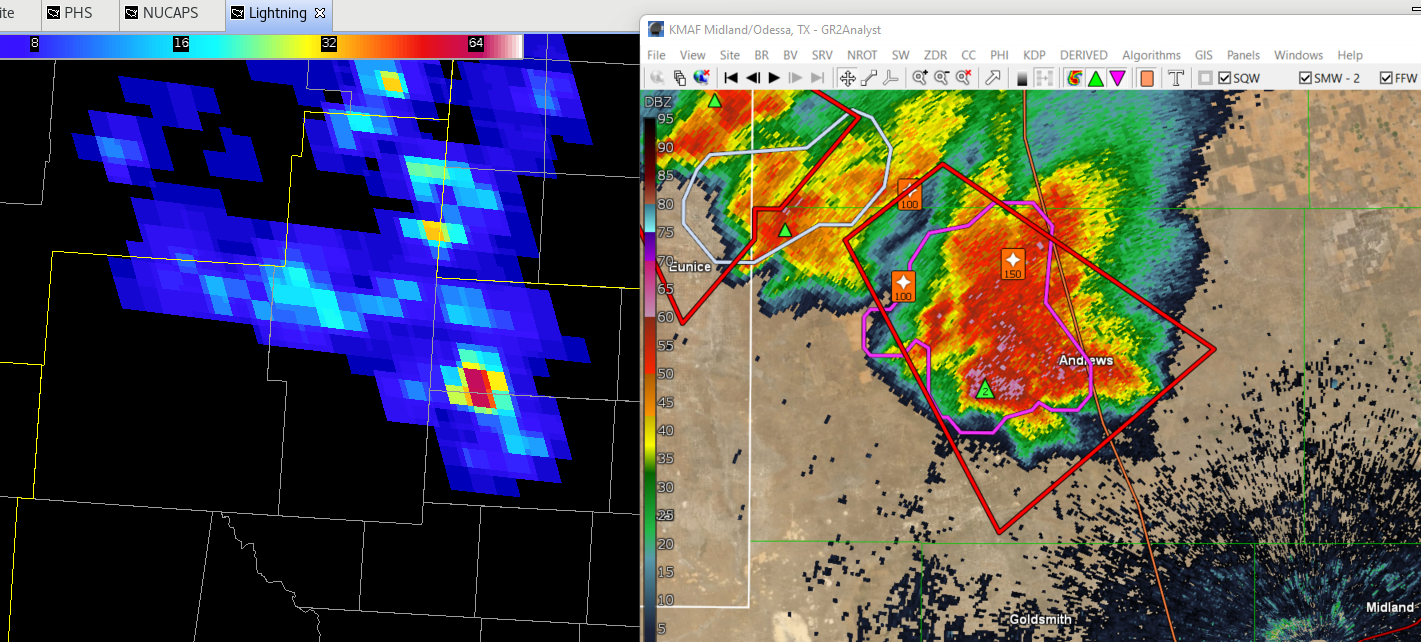
LightningCast

Not much use of the lightning cast today due to the lack of CI within our CWA, but we did get a chance to look at the advection of lightning. In general, this proved to be a little too slow. It seemed the contours were tight to the storm and storm motion was rather slow, but the lead time on lightning detection was around 30-40 minutes. With an advecting storm, I would have expected this to be rather accurate to the 60 minute threshold that it attempts to achieve, but 30-40 minutes is still VERY useful for DSS and now-casting purposes.

NUCAPS

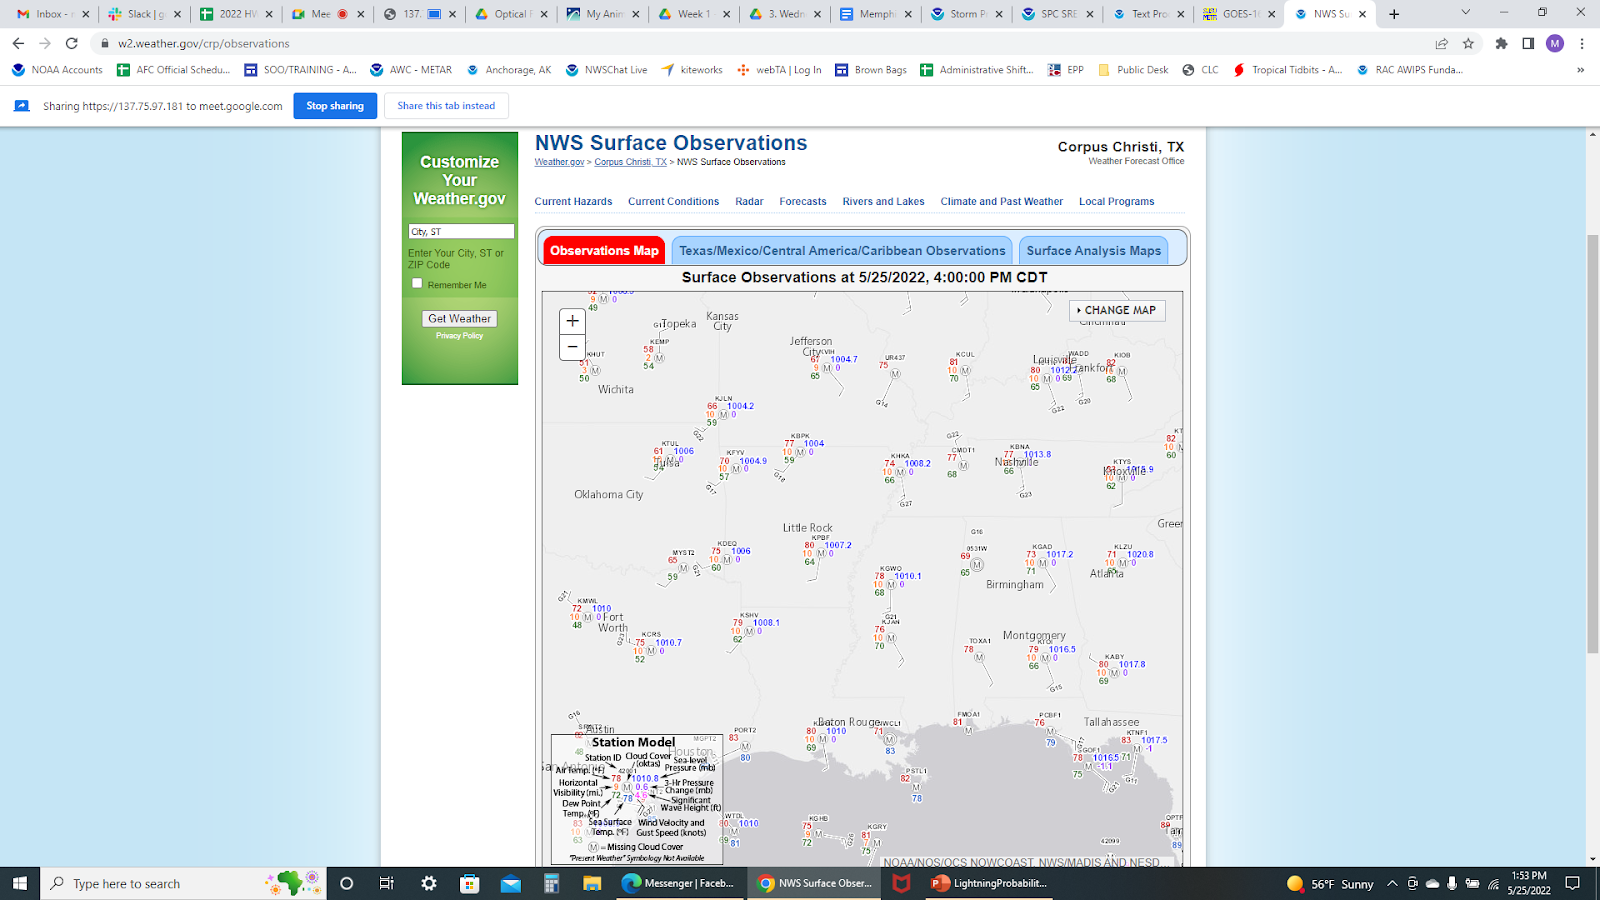
NUCAPS had some interesting results today, primarily in the way it reported green, yellow, and red data points. Some of the gridded data was unavailable for points with green-retrieval and this was puzzling because it would have indicated a dry slot over the DFW region that was evident in the water vapor and visible satellite. However, the data grid boxes were missing or contaminated with bad data over a mostly clear area. Areas with similar cloud coverage performed as expected. The pop-up skew-t continues to be the best tool in this suite of products, provided the data points are green-retrieval.
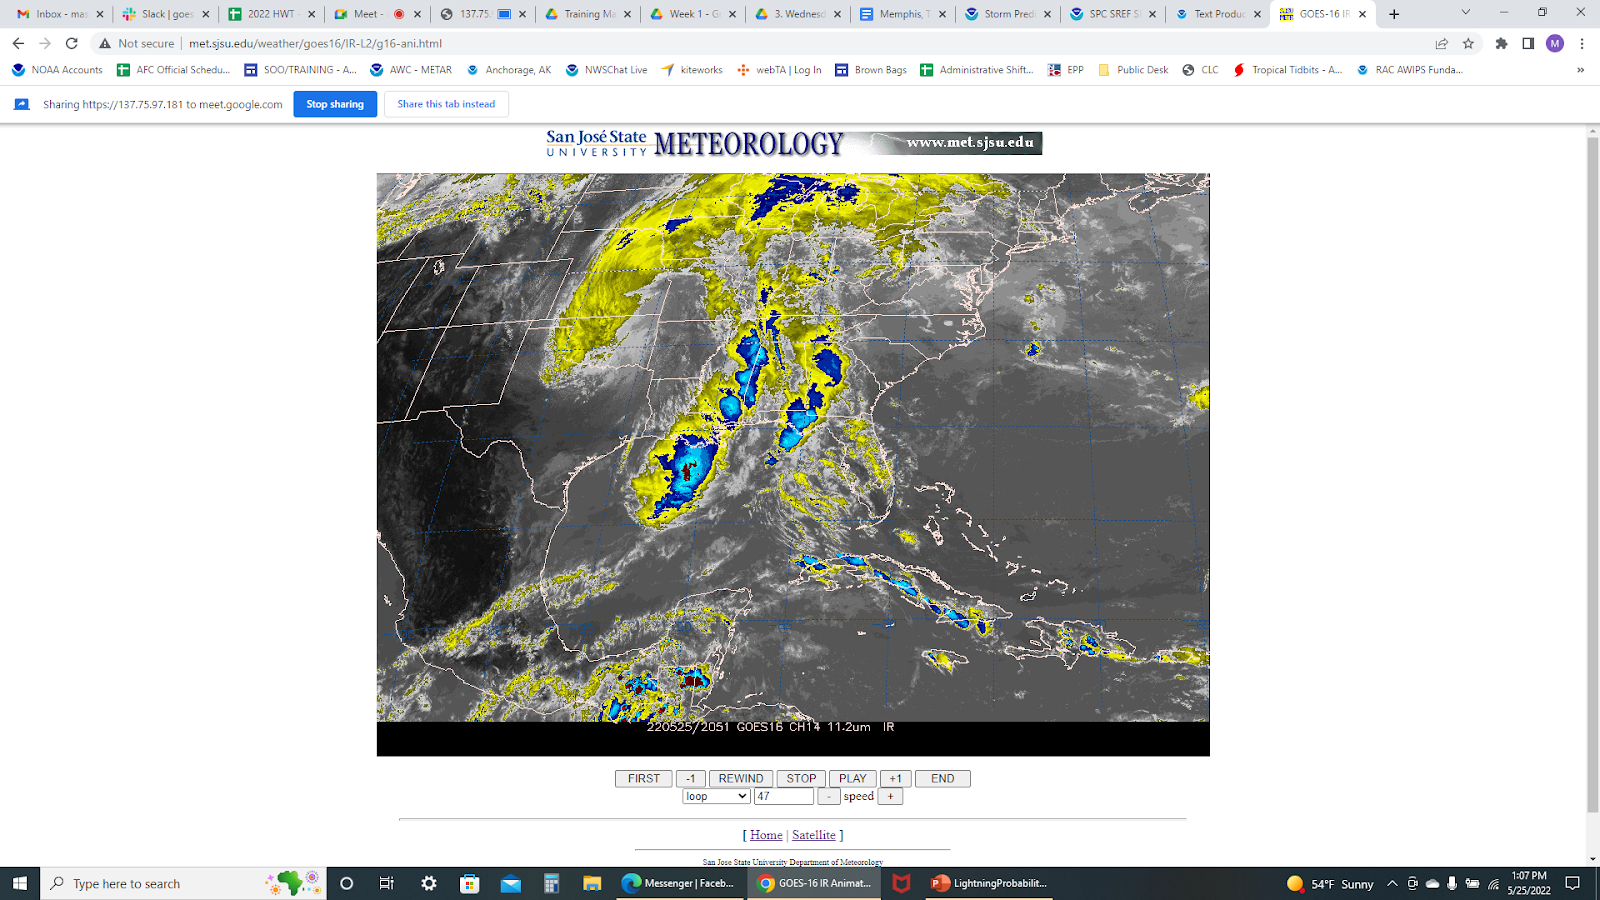
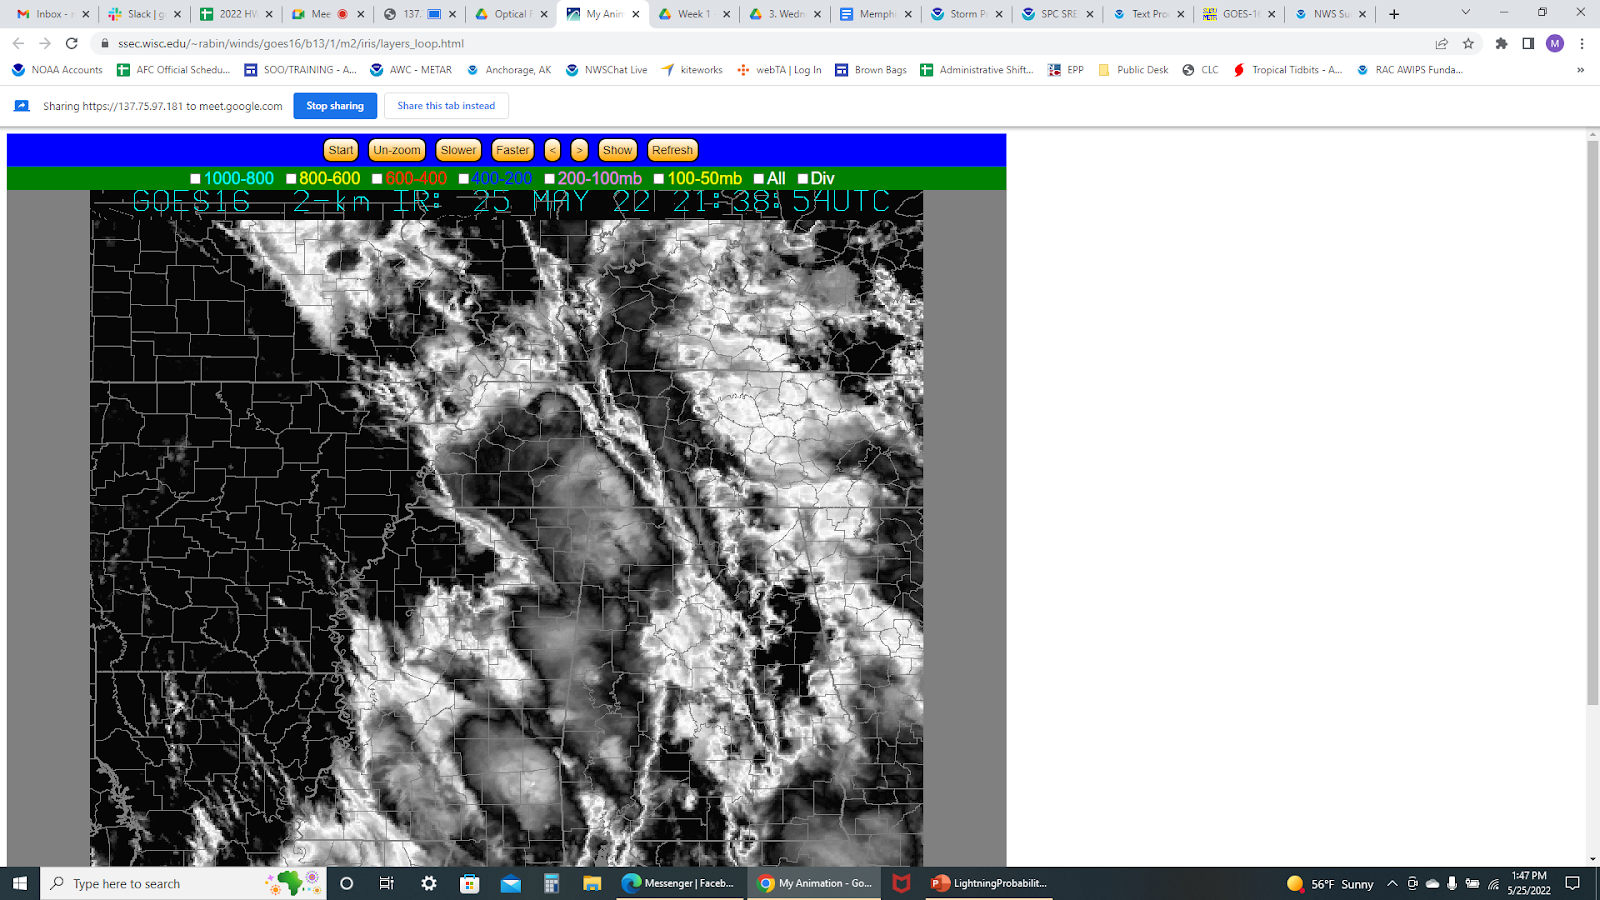
Optical Flow Winds

Not much use on the optical flow winds today due to the fact that ongoing convection muddied the data. Overshooting tops were visible for a brief moment, but quickly engulfed in strong storms and expanding anvils. The divergence field is really hard to gather meaningful intel from and the existing platform outside of AWIPS limits its overall usage. A suggestion in our group today was that divergence could be useful if the noise is limited. Perhaps remove values above and below a certain threshold. Instead of widespread values, draw attention to the important outliers.
– Overcast Ambience

Today’s details of products and warnings: Midland, TX

I found the PHS products useful for seeing the corridors of enhanced severe risk. They correctly showed that hail (or wind) was the highest risk compared to tornadoes.

ProbSevere was very useful with the trend lines. Again and again correctly identified risks as they occurred.

GLM showed strong ramp ups in activity prior to each severe issuance. No complaints here.

NUCAPS data was less useful, but with the skew-t pop up I was able to correctly see areas of mid level dry air. I did not use optical flow. Prob lightning was useful to see the first cells pop up but did not serve as much purpose after that with no known DSS opportunities.

Some Random Guy

Fort Worth ProbSevere

21:47Z: The 21:47 UTC Prob Severe with MRMS overlaid gave us situational awareness on where to focus our attention for severe storms. It highlighted two big cells southwest of our CWA, where the ProbSevere values approached 80 and 93%, respectively. The storm closest to our CWA had a 50 kt inbound velocity on the lowest scan.

Snowfan

ProbSevere on some early storms near ARX

We noticed a relatively high ProbSeverev3 (53%) on a rather innocuous looking storm (MESH around 0.5”) around 2030z. This was higher than the v2 value of 36%. The individual probs were relatively evenly weighted at lower values near 30%.

(clockwise from top left) MRMS 18dbz echo top, MESH, reflectivity and ProbSevere (storm in center), and low-level MRMS azimuthal shear.
(clockwise from top left) GLM FED, GLM MFA, reflectivity and ProbSevere (storm in center-right), and GLM TOE.

GLM FED was unimpressive, though it’s unclear how much of this is related to lower detection efficiencies in this area. ENI total lightning was halfway decent. High DCAPE values and other environmental parameters may have been sending the ProbSevere v3 higher.

Timeseries for the storm of interest.

Another storm further to the west over SE MN had slightly lower MESH (.39”) but in this case PSv2 was higher at 48% vs Psv3 at 23%.

– Barry Allen

Tags: None

ProbSevere Time Series

I found the ProbSevere time series helpful today as we “triaged” storms and tried to identify storms that may become severe. While the capping inversion stayed strong and therefore prevented storms from becoming severe, it was great to see storms follow a similar intensification process identified by the Prob time series time graph. Most storms intensified in a similar fashion but capped out when ProbSevere reached ~40%. After 40% storms would remained steady state and then gradually weaken. Noticing these trends and seeing them plotted visually helped us pick up on the trends. Any storm that deviated from this and grew upscale faster would be easy to identify on the ProbSevere time series graphs. We knew what the “norm” was for storms in this capped environment because of the time series graphs. We surmised that once the cap broke (which would be after the experiment ended), we could quickly ascertain when storm would finally be able to grow upscale by looking at their respective time series.

– Fear the Shear

Tags: None

ProbSevere and GLM with supercell moving offshore the South Carolina coast

A thunderstorm located east of Charleston appeared to have some supercell characteristics as it moved south-southeastward towards the coast, with a kidney bean shape in reflectivity and a weak mid-level mesocyclone, as well as some deviant motion from the northwesterly flow. As it was over land it appeared to be strong but sub-severe, and maintained generally consistent 20 to 35 percent ProbSevere in v3. ProbSevere v3 seemed more consistent overall, with v2 jumping up and down more often, dropping down into the single digits at times. ProbSevere v3 did jump down below 20 percent briefly when GLM FED really dropped down. But the consistent lower-end probabilities at least indicated that this was a storm to be watched relative to the lower v2, and this may have at least allowed lead time on a low-end special marine warning before it moved offshore and strengthened.

The timeseries is somewhat useful if you just have one storm to look at, but with multiple storms I would probably just look at the loop in the ProbSevere plan view instead.

After it moved offshore, GLM FED increased, slightly in advance of a jump in MESH and associated jump in ProbSevere v3. ProbSevere v2 jumped ahead of v3 in probabilities as often occurs, though at that time MESH around 0.9 inches may have warranted the more conservative ~50-60% v3 approach. Later MESH jumped up to around 1.3 inches, and ProbSevere v3 jumped above 70 percent at this time as well.

Clockwise from top left: MRMS 18dbz echo top, MESH, reflectivity/ProbSevere/low-level azimuthal shear at 2130z.
Clockwise from top left: GLM FED, minimum flash area, reflectivity/ProbSevere, total optical energy at 2130z.

– Barry Allen

Tags: None

ProbSevere v3 for Low End Storms

In the training we reviewed for ProbSevere v3, it was frequently mentioned that overall the values we would see in v3 would tend to be a bit lower than in v2, which is what you’d expect in a better calibrated model. (Given what we know about storms and their potential severity, v2 often seemed a little too sure of itself, right?)

However, in looking at the relatively puny convection over Charleston’s CWA today, I’m seeing a lot of the opposite. That is, instances where v3 is noticeably higher than v2. As I think about it, I believe we’re seeing more evidence here of a better calibrated model, as it’s ultimately showing less certainty than v2 about storms not being severe which seems to make sense intuitively. We’ve all had our share of days where a storm one thinks is relatively benign ends up overperforming and though I don’t have any actual evidence to prove this, it appears that ProbSevere is, in its way, taking that into account. Ultimately, this is giving me a bit more confidence in its output.

An example of a somewhat low end thunderstorm where v3’s percentage (29%) is noticeably higher than v2’s (2%). V2 seems a bit too certain that this storm is not severe. As forecasters, we know better.

– Earl Grey Tea

Tags: None

ProbSevere in Jacksonville

The 0.5 degree SRM from JAX shows a concentrated area of wind within the cluster of storms in St. John County, FL with radar estimates of the wind near 50kts. Given the lightning jump illustrated by FED values quickly rising to ~170 flashes per 5 min, the storm is intensifying.

However, ProbSevere values are rather low with version 3 showing only 22% and version 2 showing 33%. ProbWind surprisingly was even lower with only 19%. This is a reflection of the lack of base radar data involved in the ProbSevere and ProbWind algorithms. Especially for ProbWind, base radar velocity data needs to be included in ProbWind for this product to be useful in identifying wind producing severe thunderstorms.

It would be useful to integrate base radar data from multiple single radars and combine these values into one algorithm. It may be useful to identify notable/sharp changes within velocity data between pixels which could help in picking out downdrafts.

– Fear the Shear

Tags: None