Wednesday Satellite HWT Thoughts
PHS Model Comparisons and Thoughts
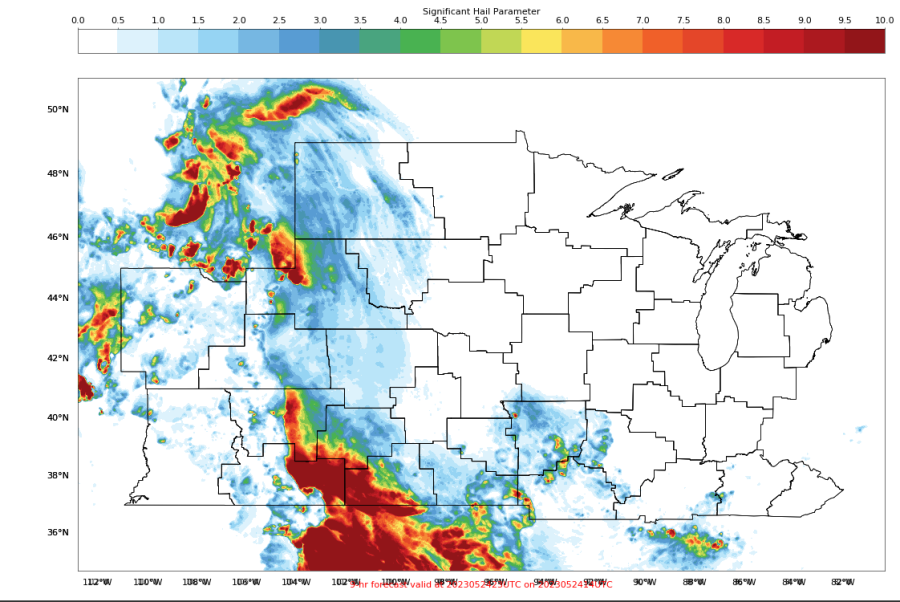
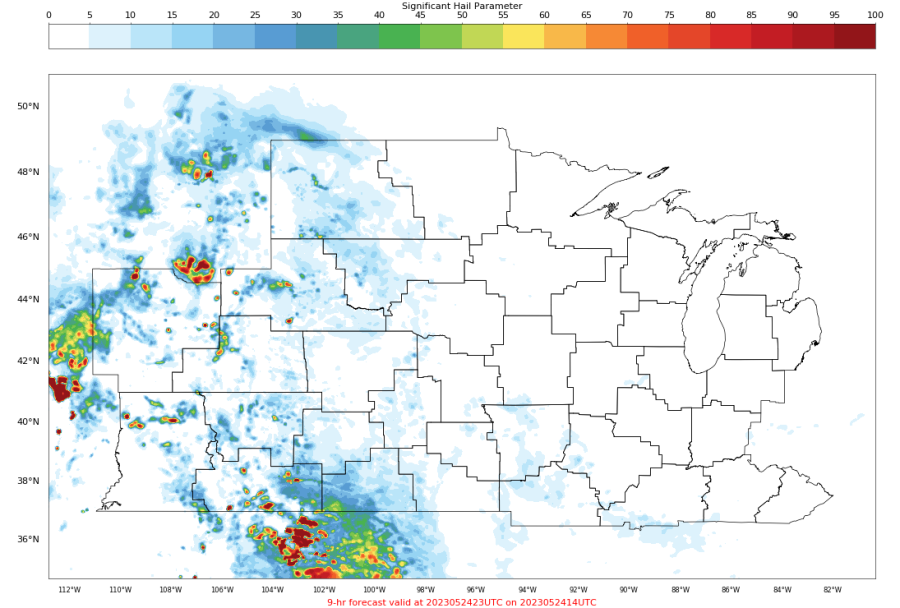
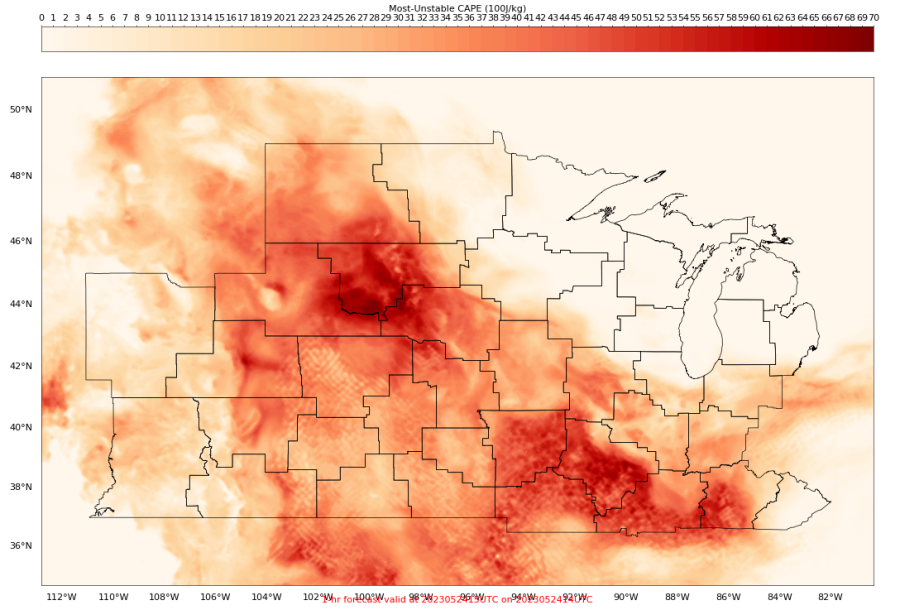
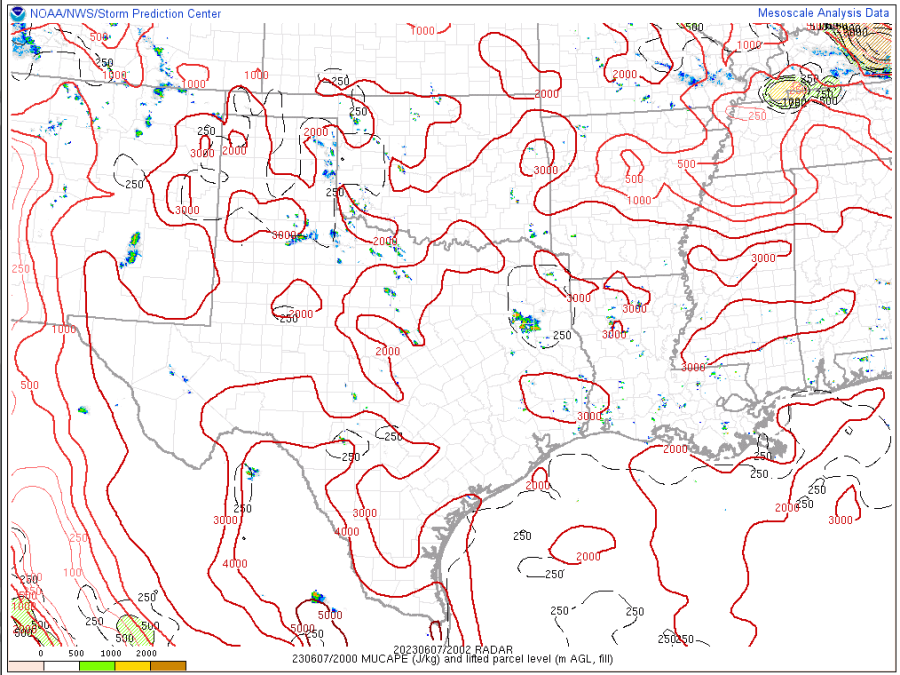
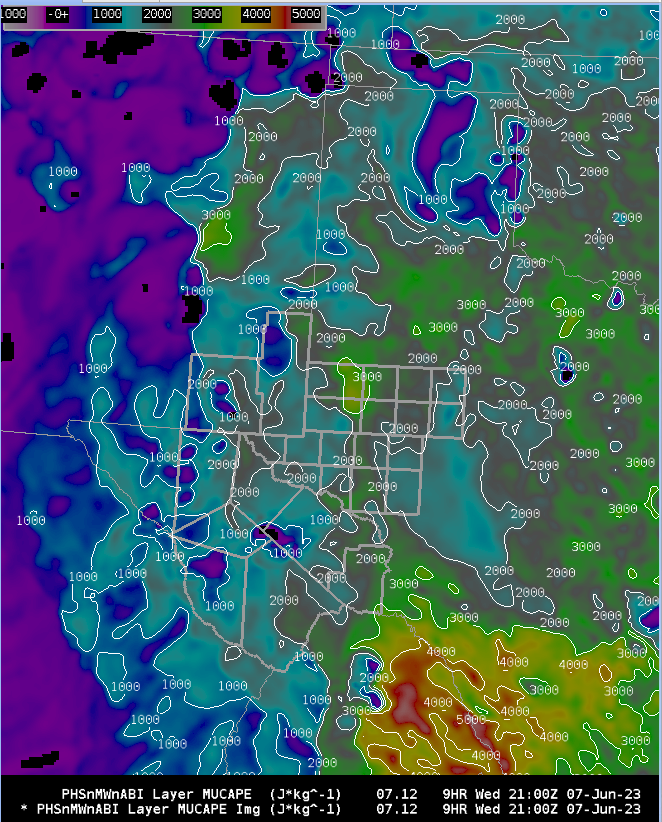
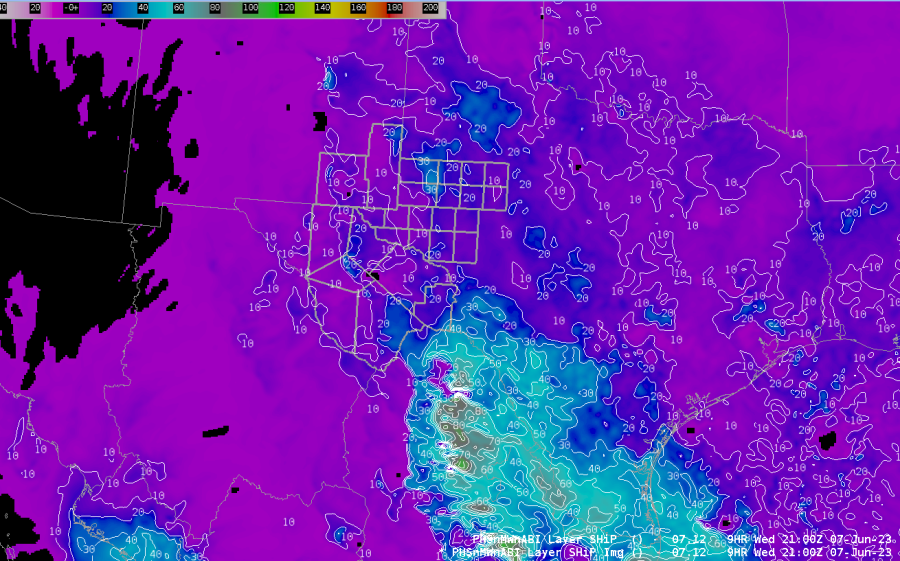
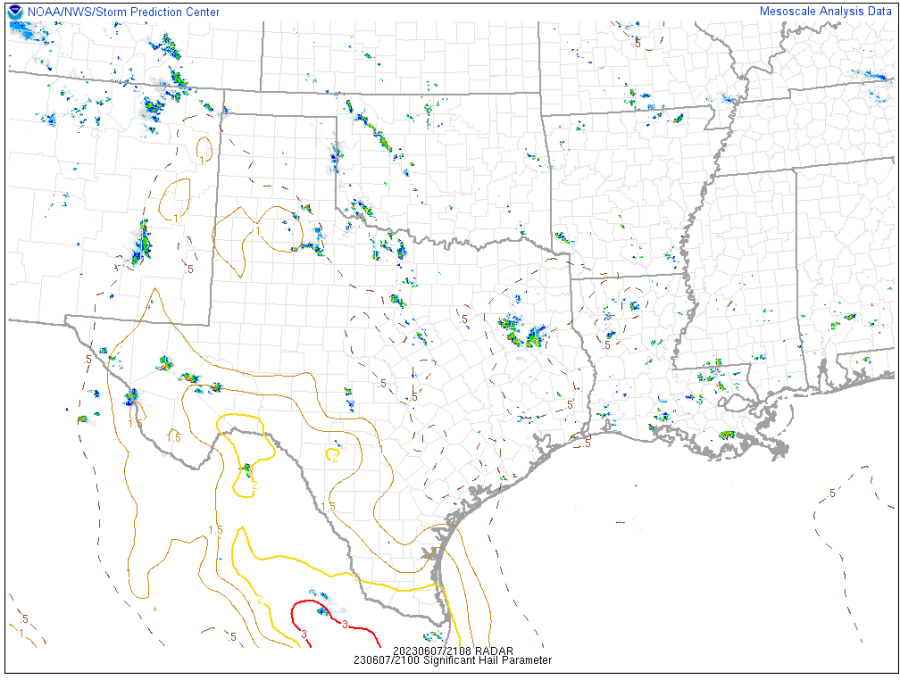
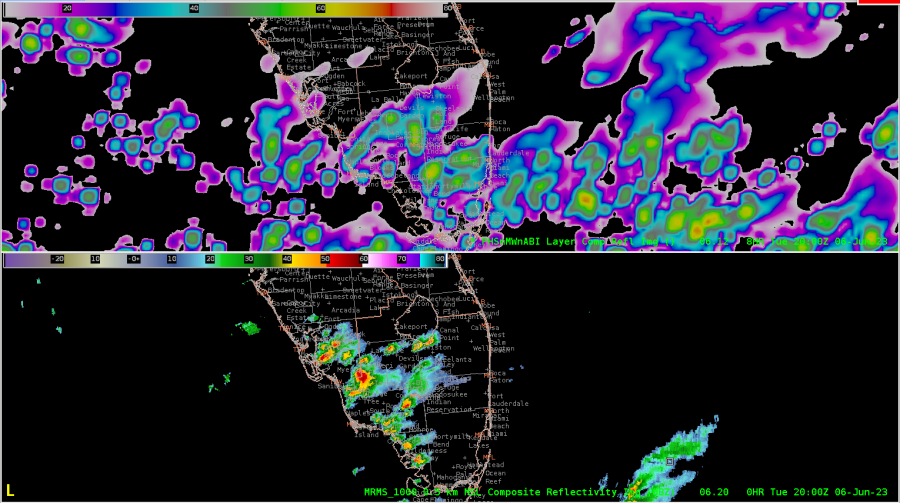
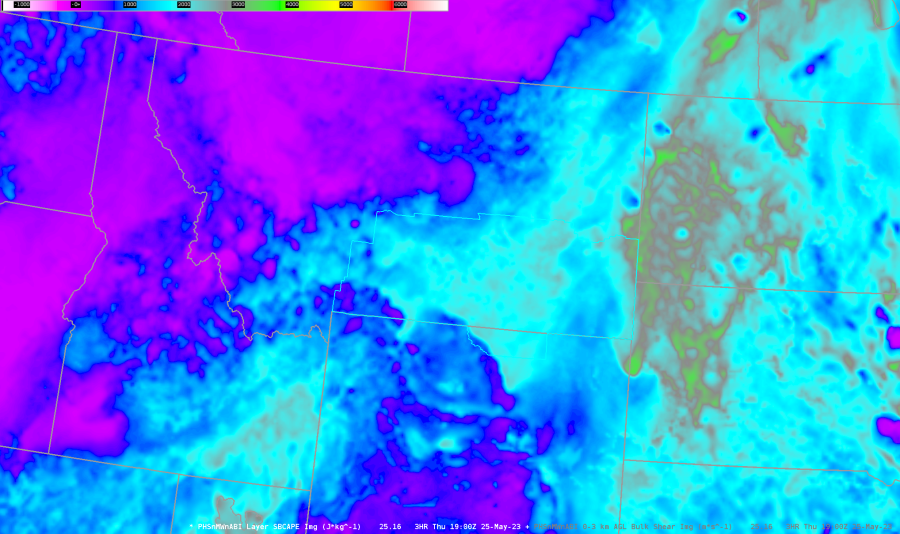
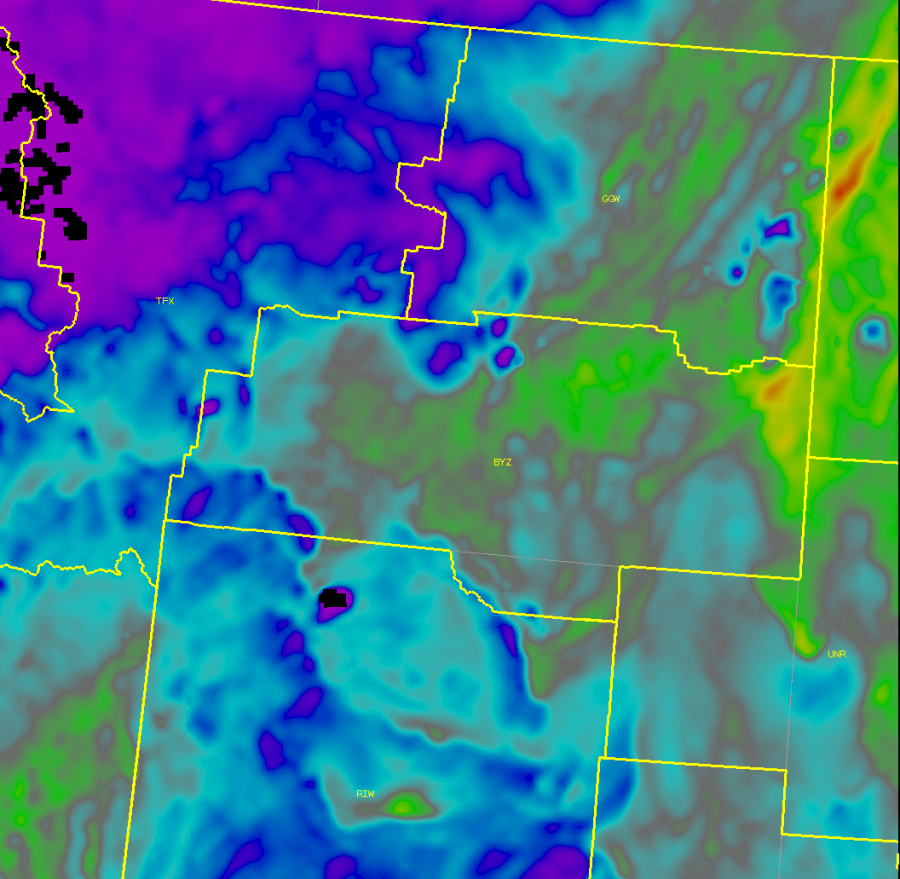
Above: Top is HRRR SHIP parameter, bottom is PHS SHIP parameter.
Looking at some of the convective parameters and indices around the CWA I was working with today (PUB), one thing that really stood out to me was how “splotchy” many of the parameters were when compared with the HRRR model. It’s very hard to believe that the model, especially at a 3 km resolution, is able to obtain that level of accuracy with regards to these parameters, or at the very least having gradients this sharp in many of these parameters doesn’t make much sense. Wondering if some of it is being driven by the extreme CAPE gradients that do show up later on, which are certainly going to be drivers in many of the severe indices.
Another thing I noticed is what looks to be a wave-like numerical instability within the first hour of the model – this could be having some big impacts on the model forecast, as you can see these reflected in the base fields (T, u, v, etc) and then having impacts on many of the other derived parameters that last through the forecast period, as shown in the image below:
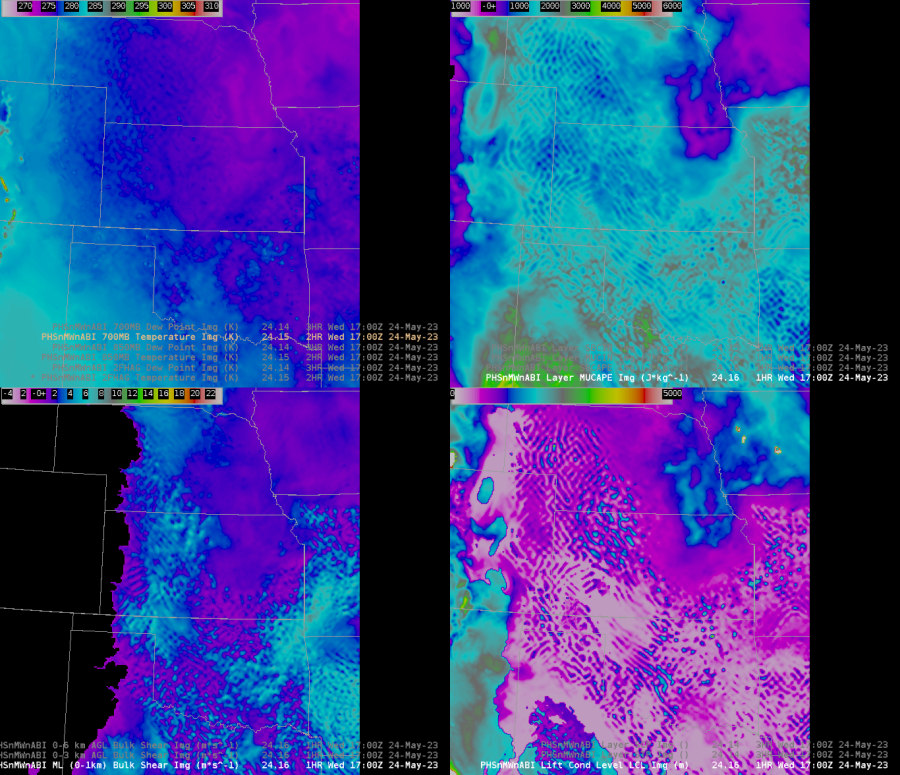
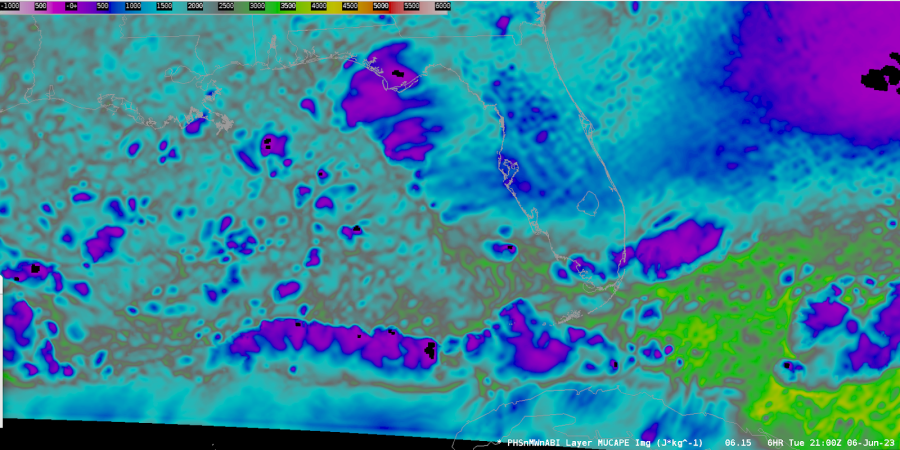
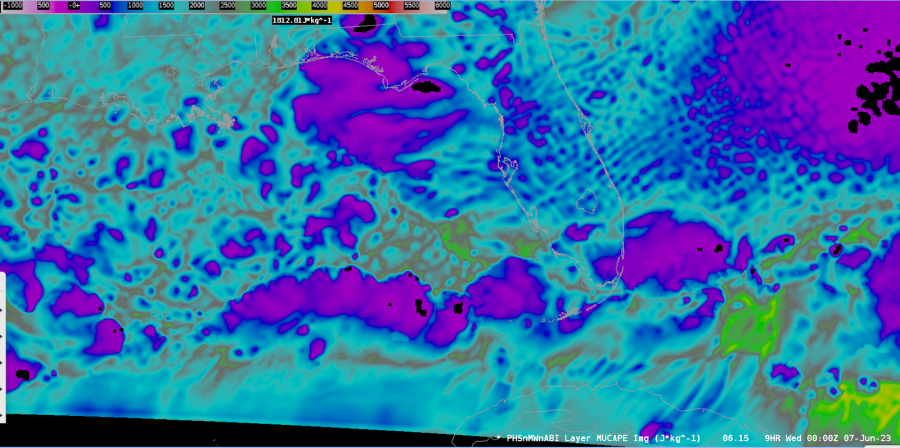
CAPE also seems to initialize really high, then “jump” down to a lower value at the first hour. This is quite a large “adjustment” from the initial conditions that the model seems to start with. Shown below are hour 0 of the 14Z run and hour 1 of the 14Z run from Wednesday 5/24.
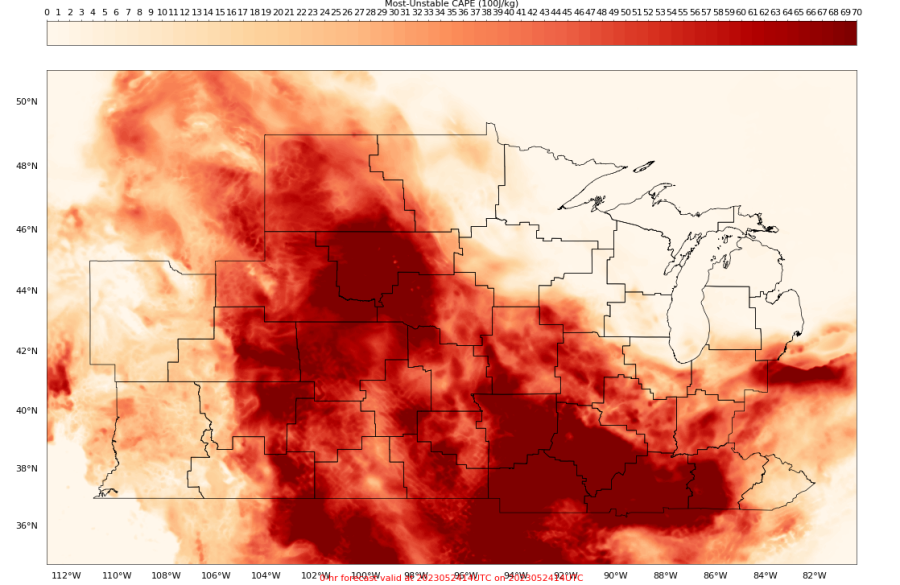
You can also see the numerical instability within this field that is in place across a large portion of the domain.
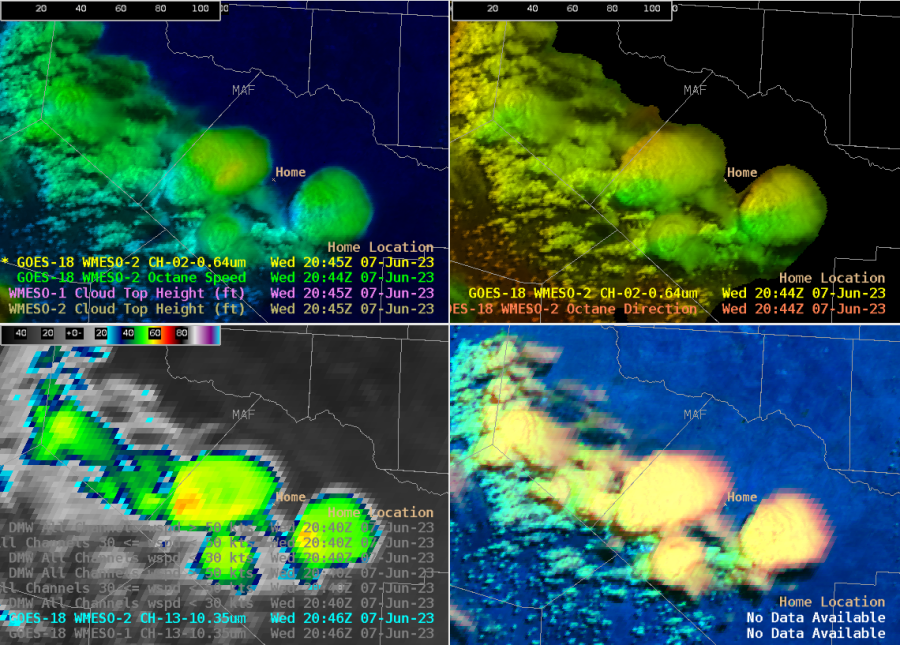
OCTANE
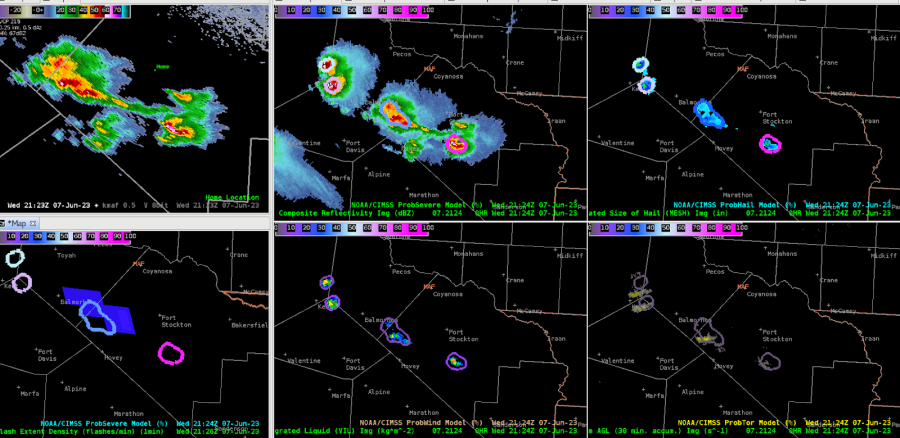
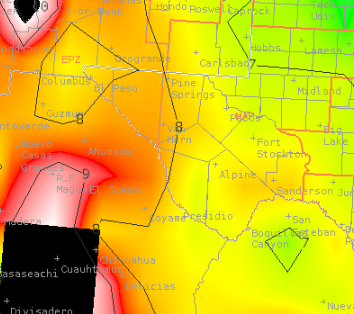
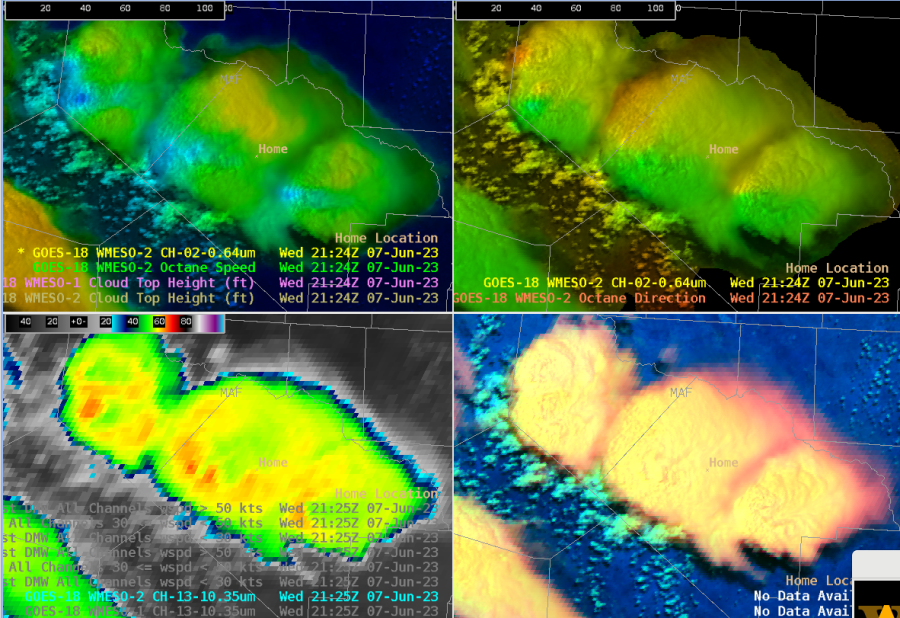
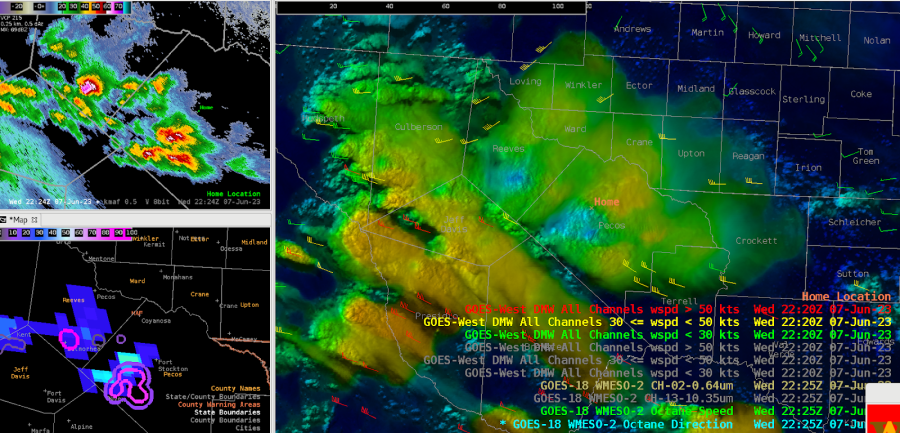
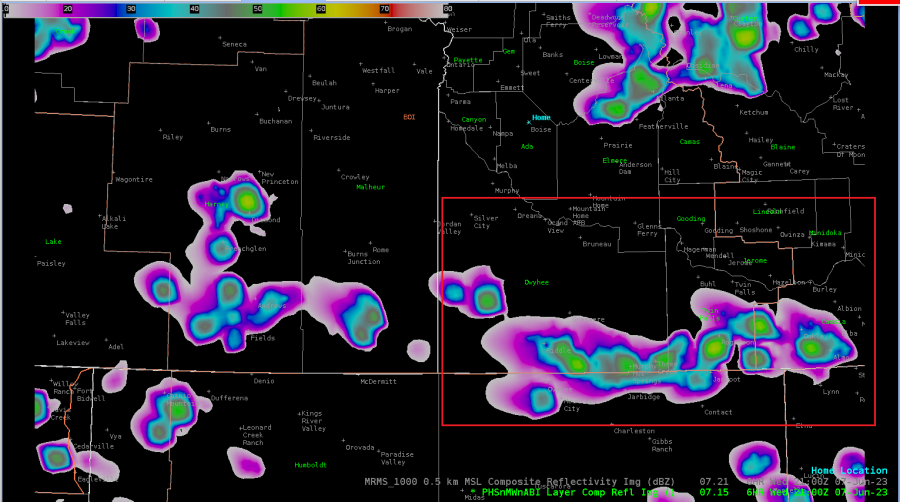
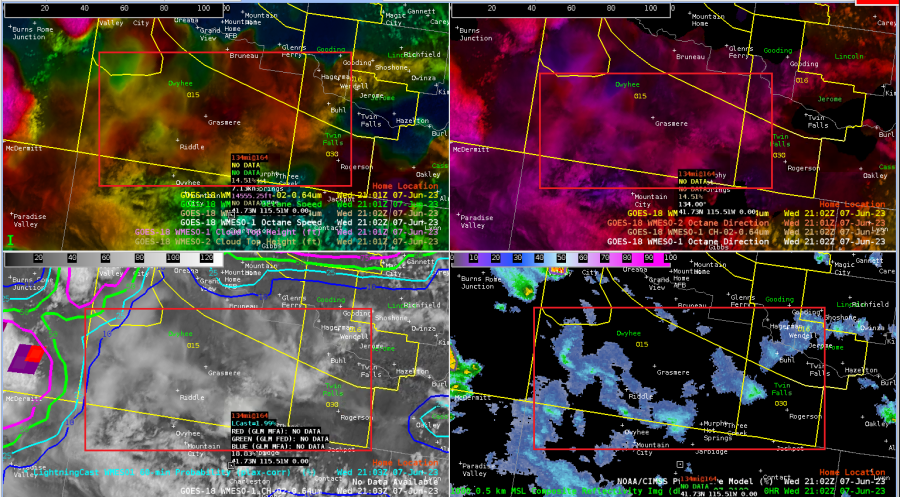
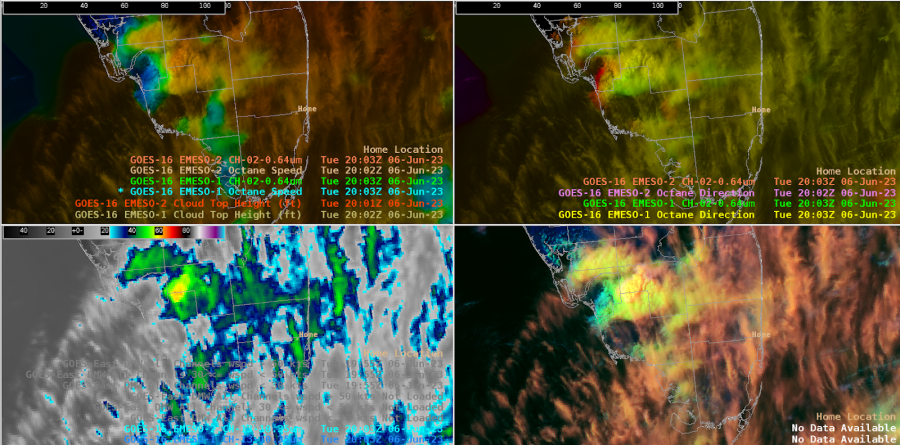
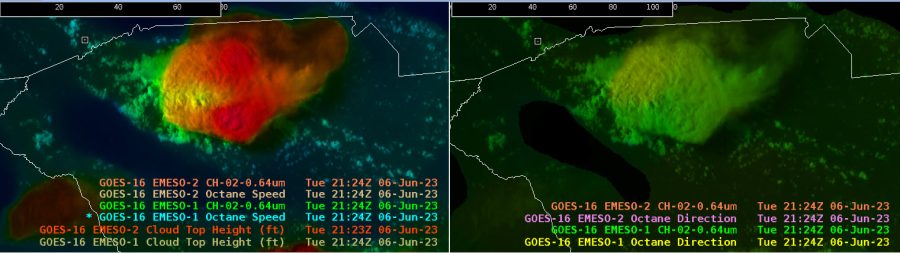
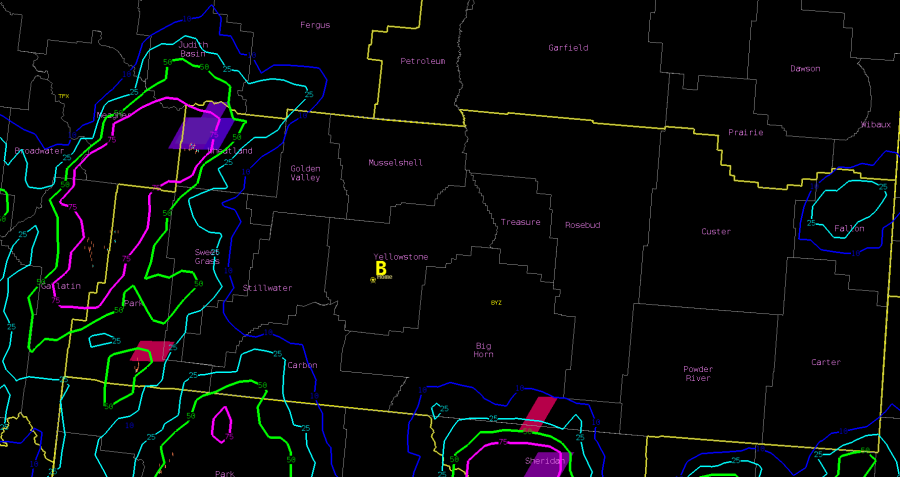
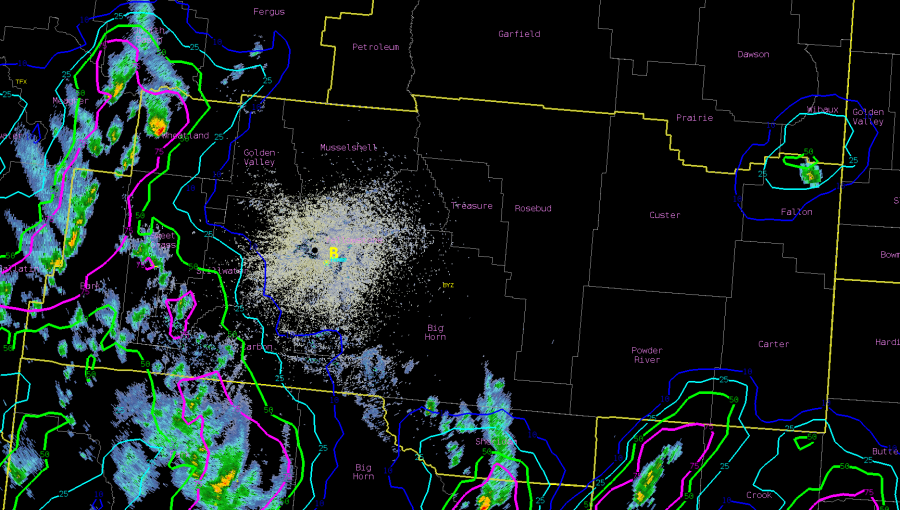
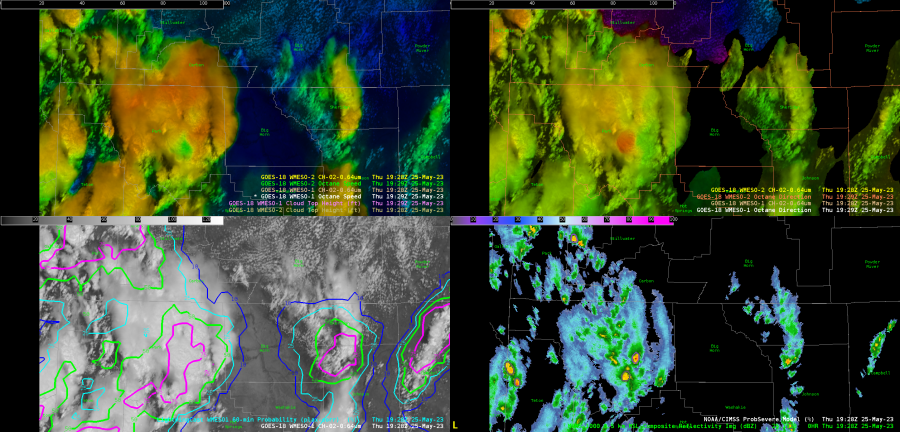
Octane was able to capture an interesting view of the Above Anvil Cirrus Plume on a very powerful storm along the New Mexico/Colorado border during the afternoon hours. The cirrus is a bit slower than the surrounding clouds within the sheared environment, providing that “V” type shape that we’ve come to associate with some of the strongest updrafts:
Another good example of using Octane for surveillance of storms – the direction product really highlighted another storm that quickly grew on the flank of another severe warned storm. Big value especially in areas where radar coverage might be limited by mountains, such as in the CWA I was working in today (PUB):
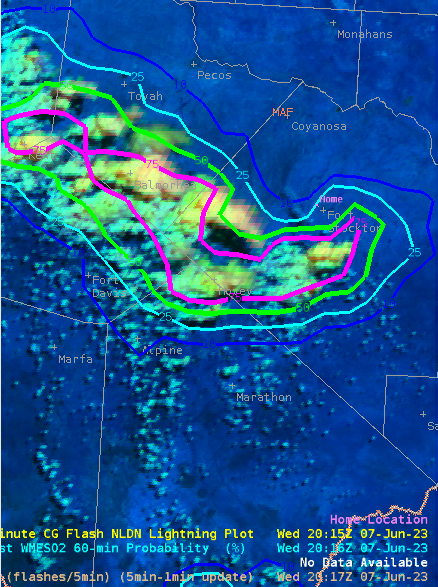
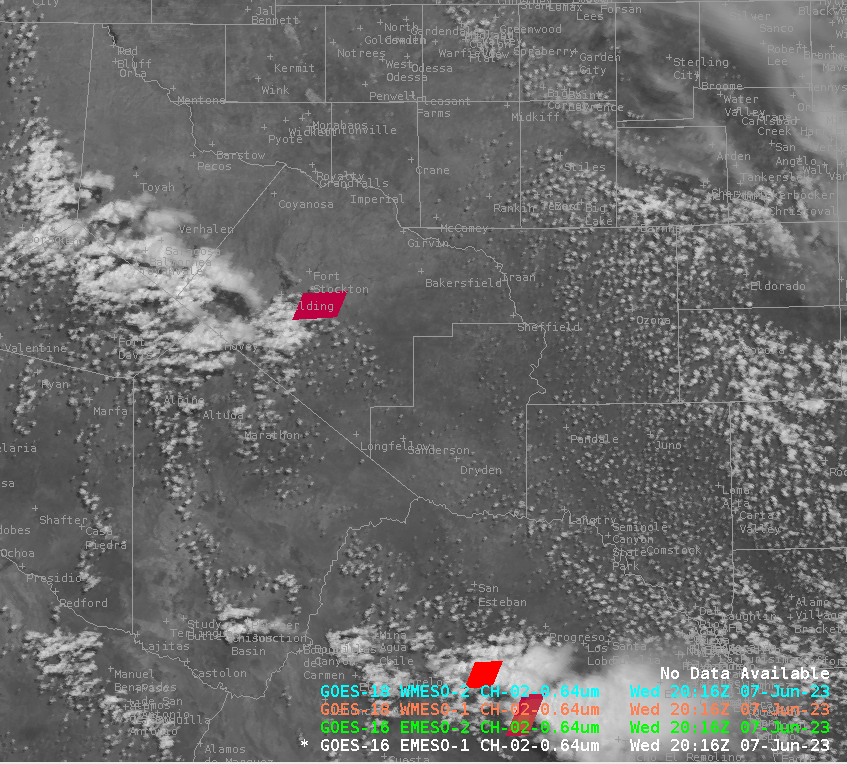
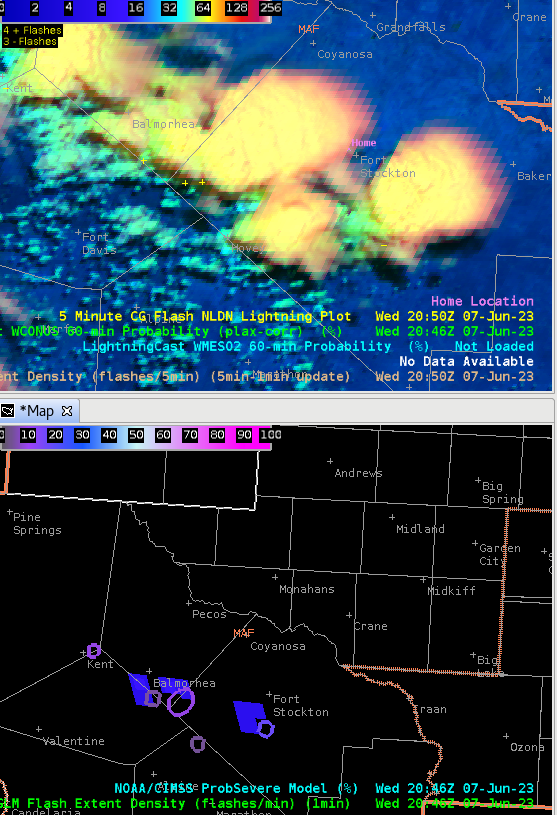
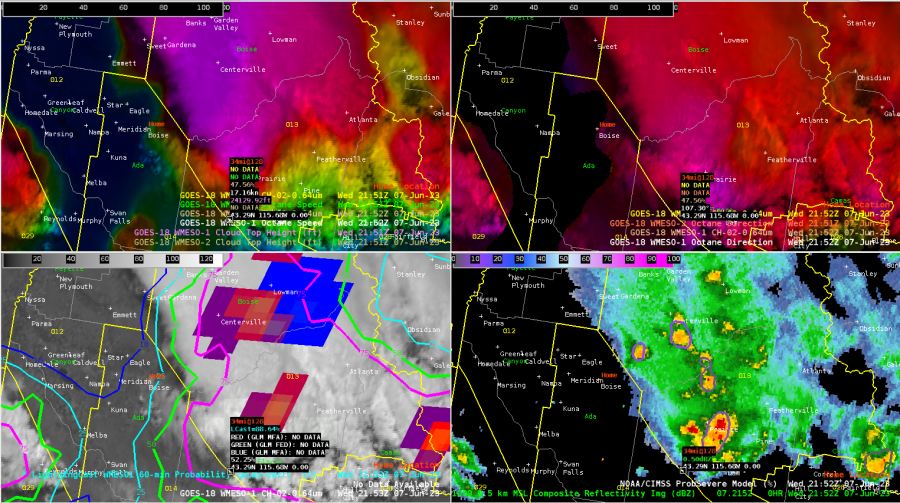
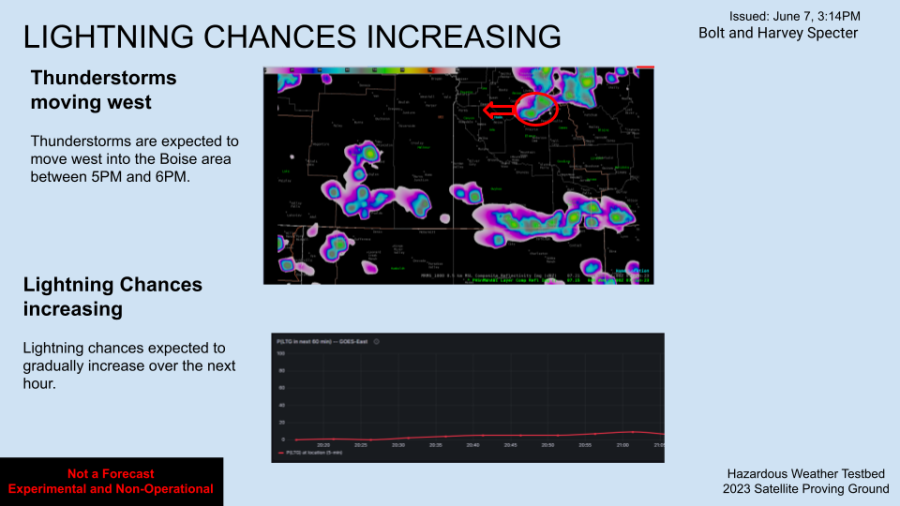
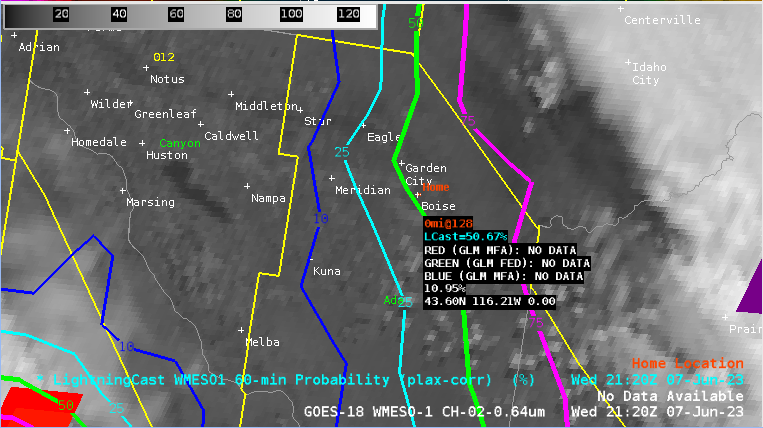
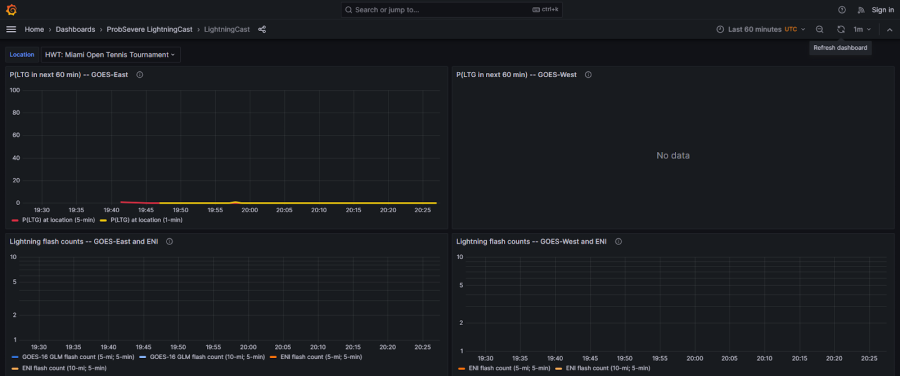
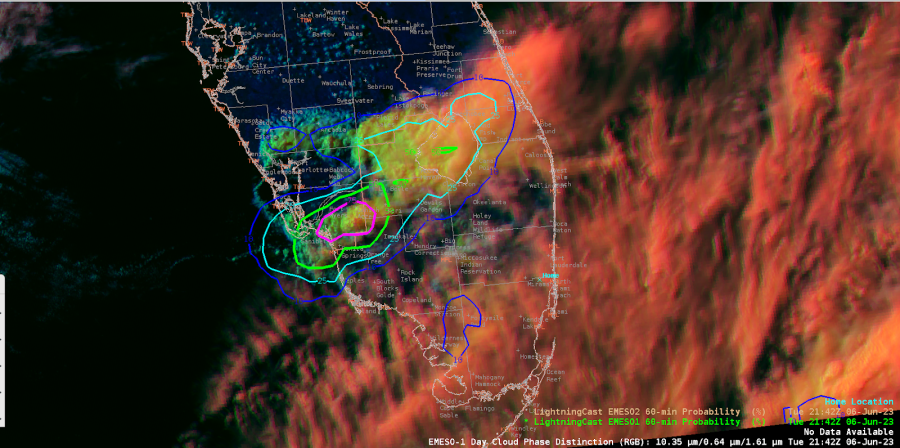
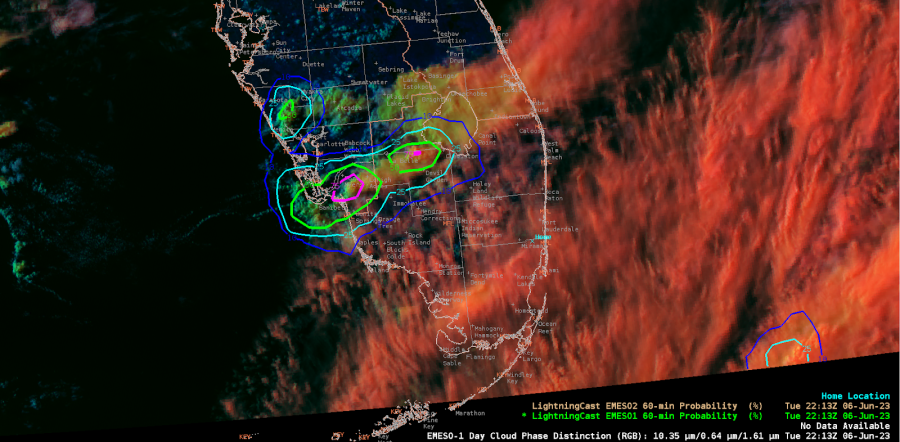
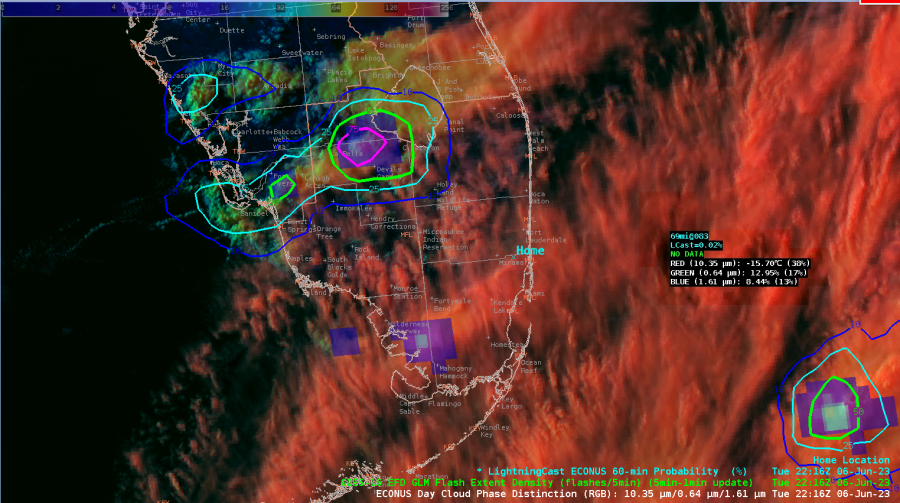
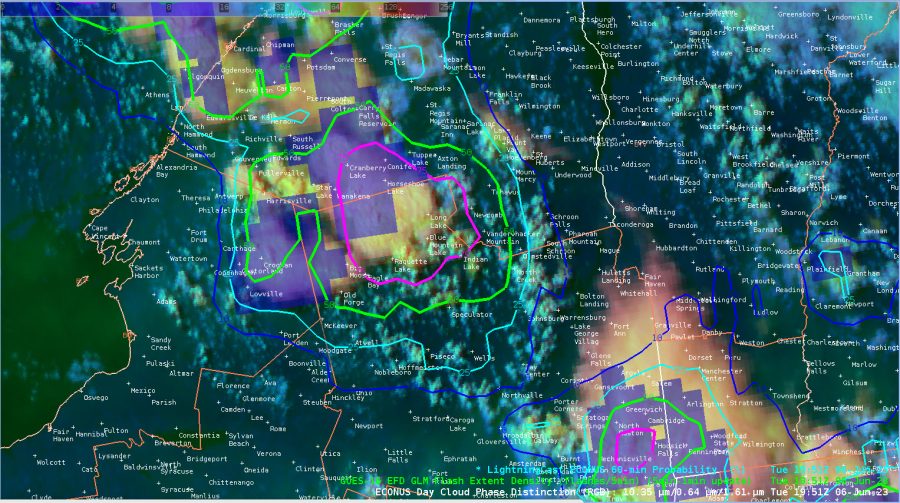
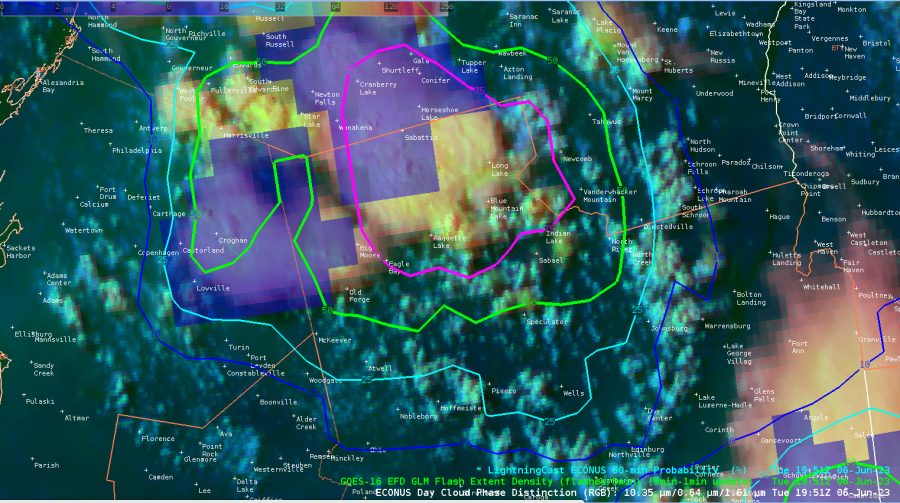
LightningCast
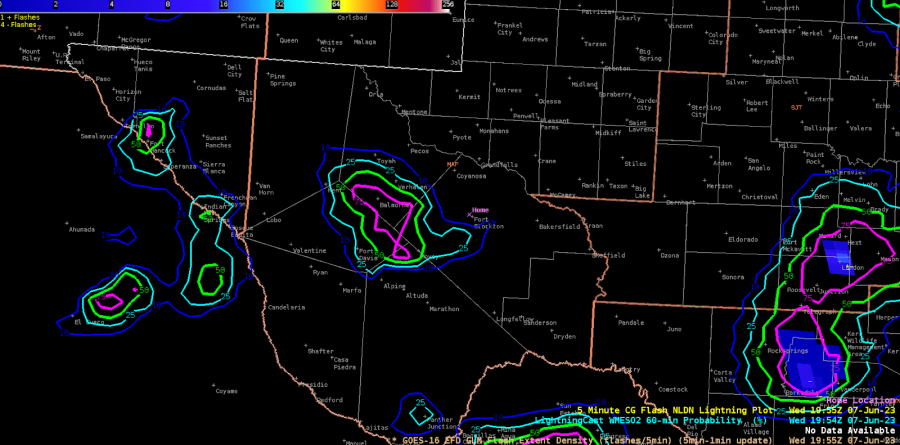
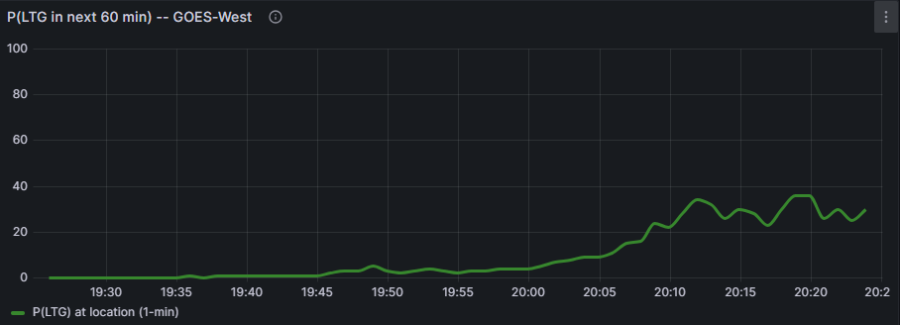
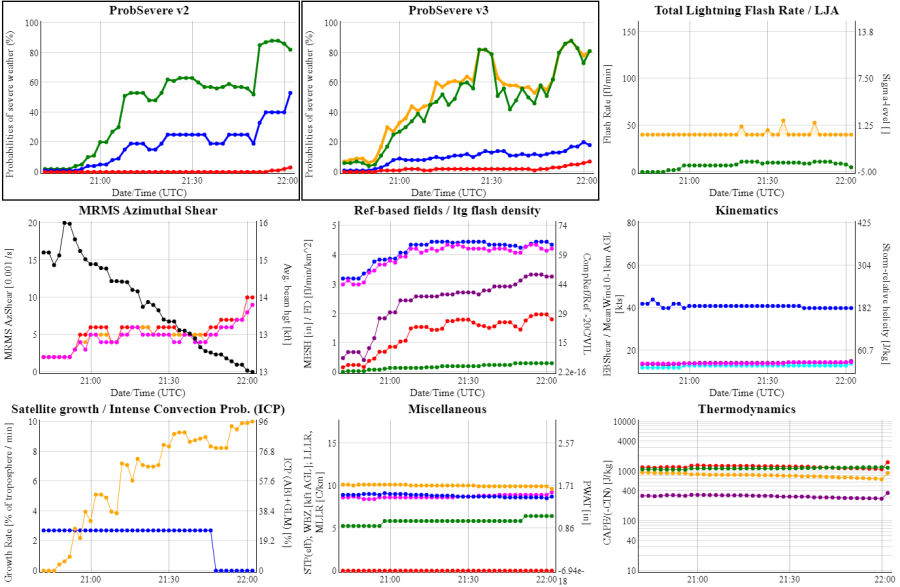
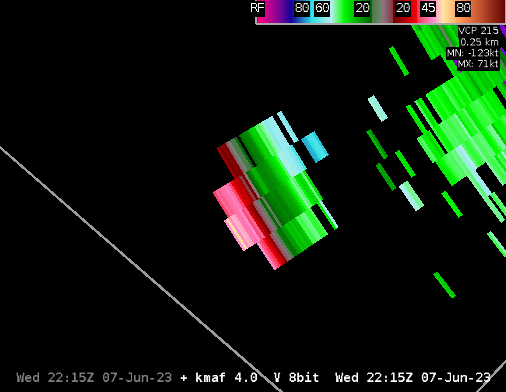
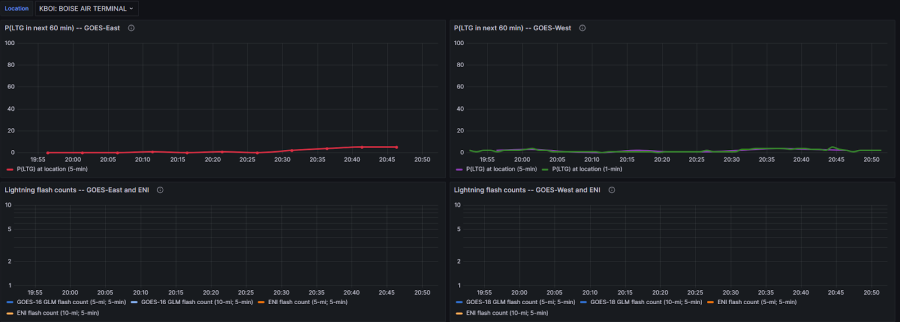
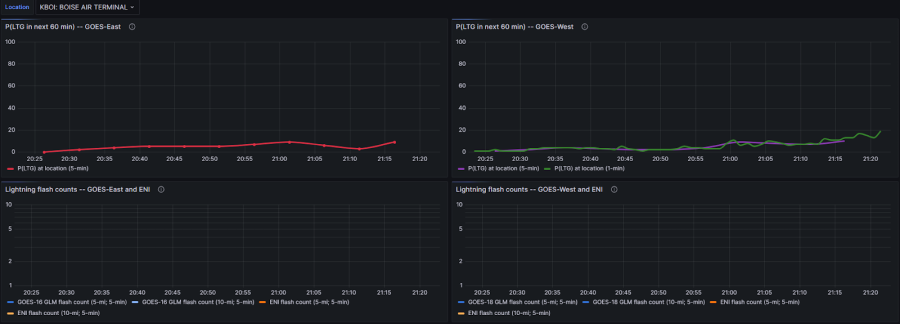
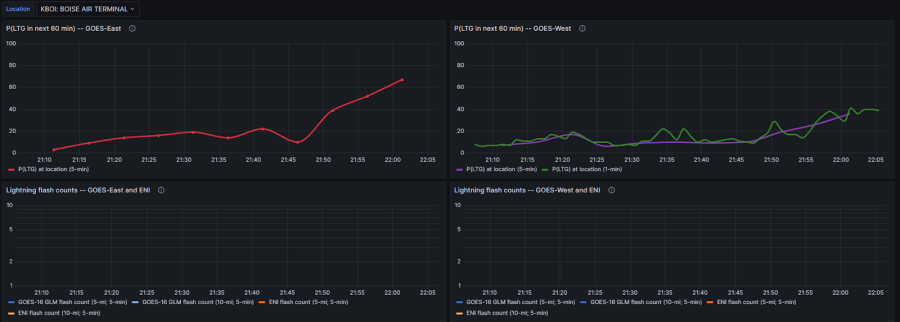
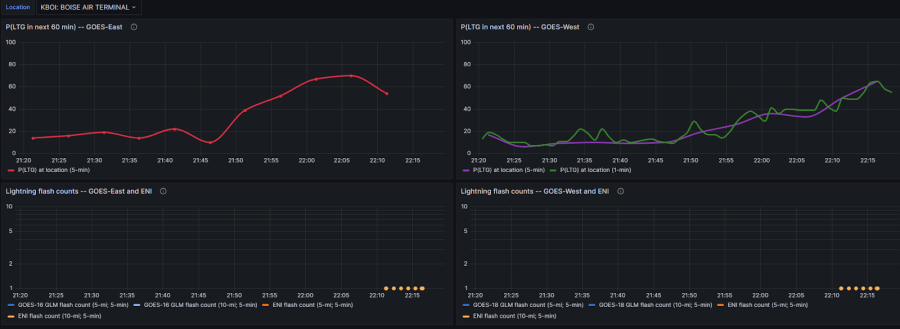
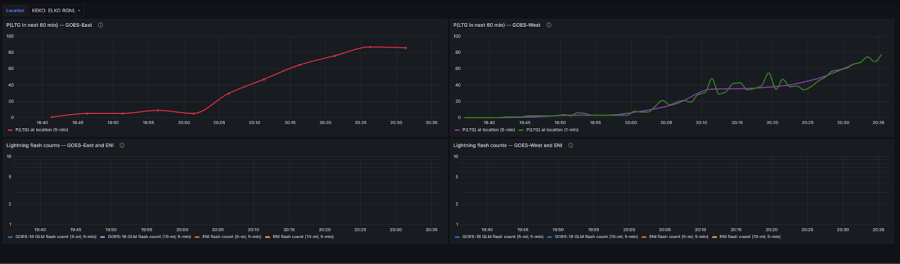
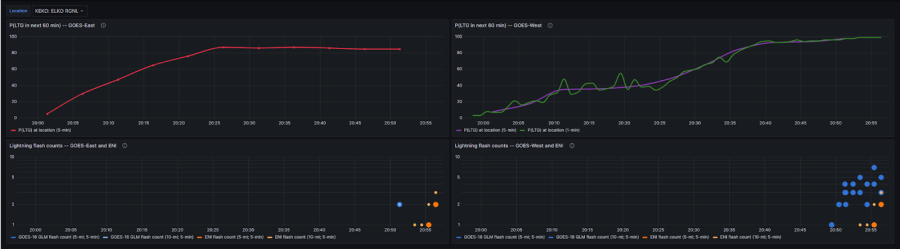
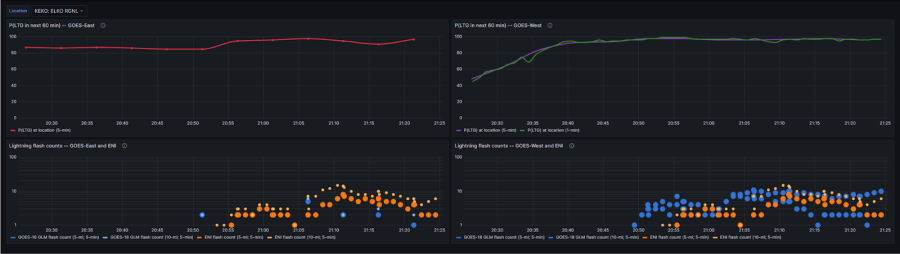
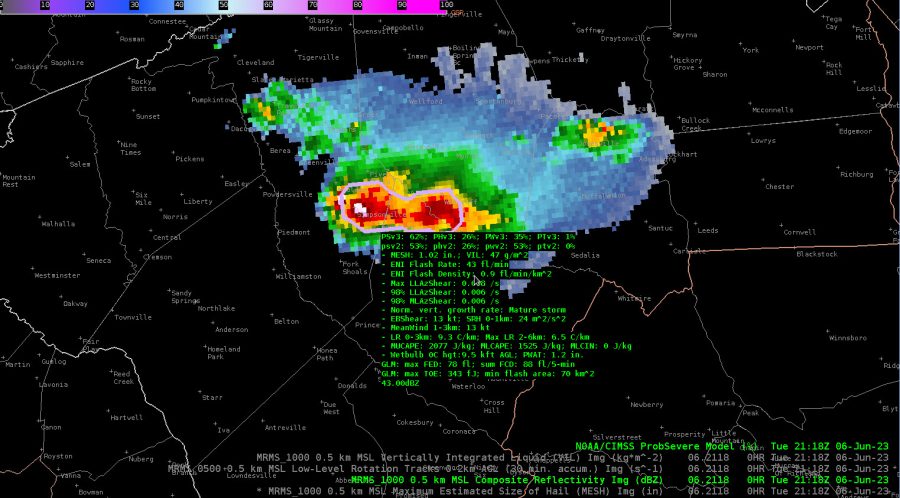
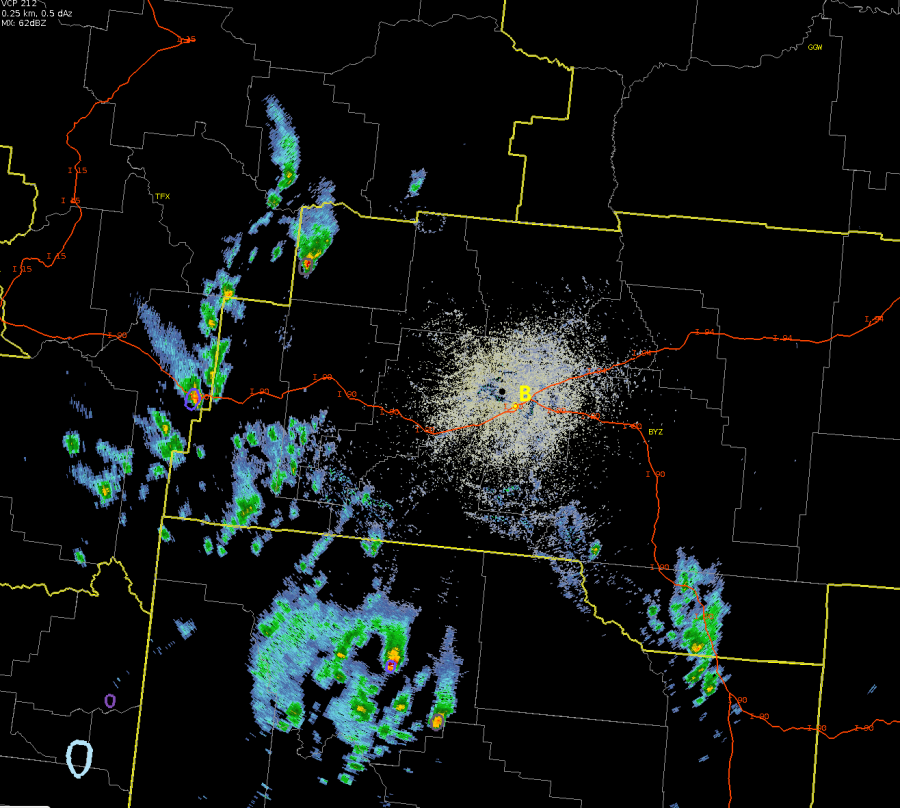
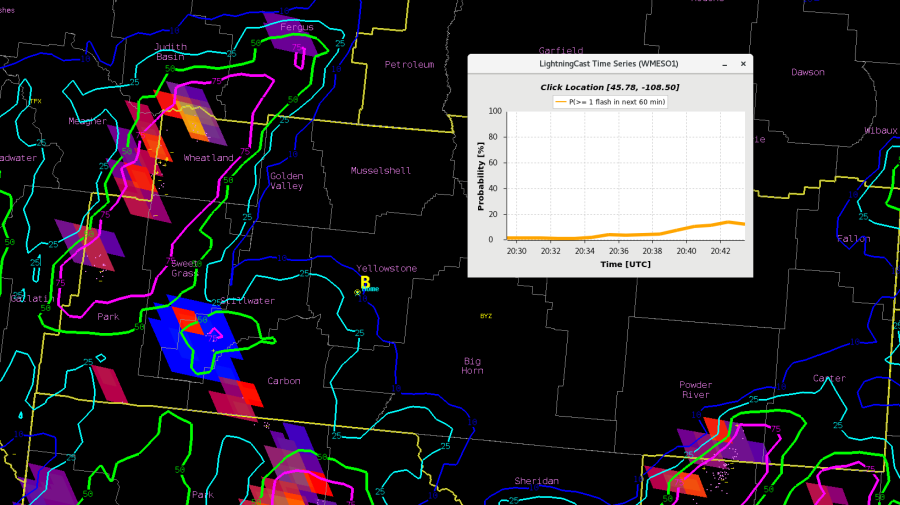
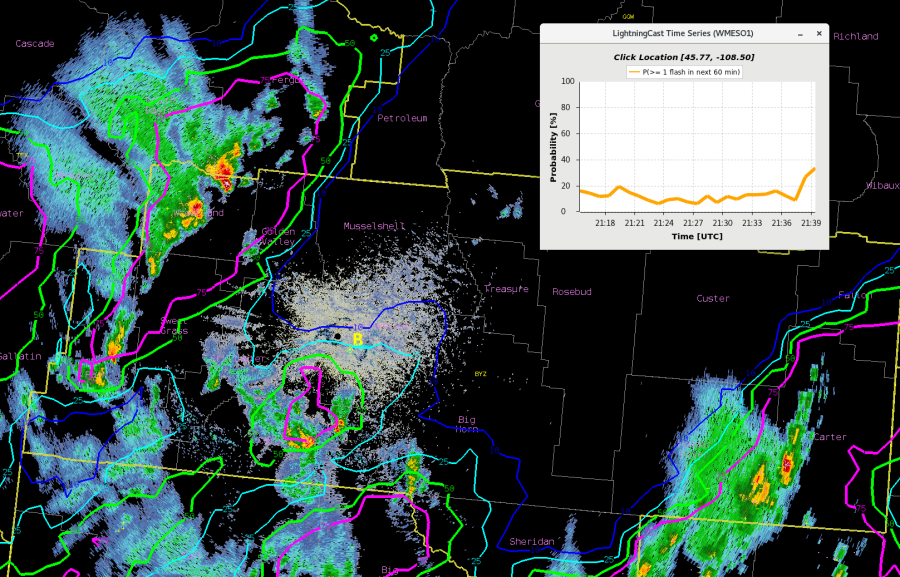
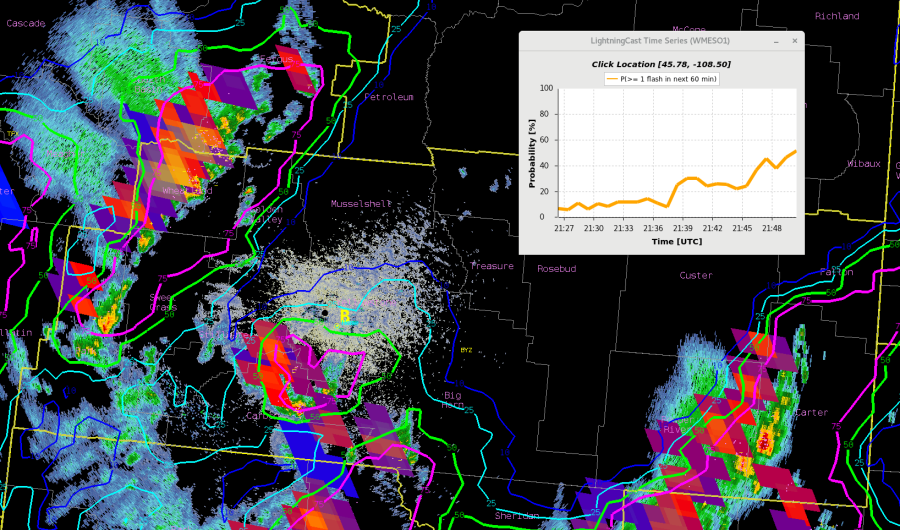
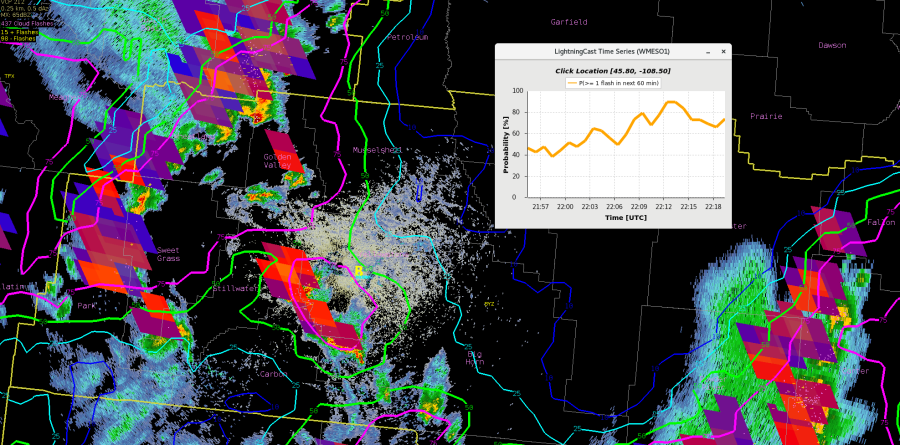
Used the LightningCast product extensively for DSS purposes today. We had a pretend outdoor event located in Pueblo, Colorado. A very strong thunderstorm (MESH estimated nearly 3″ or larger hail at one point) which passed within a few miles to the south and east of the city. I used the LightningCast probabilities in AWIPS overlaid with satellite data to provide multiple updates to Emergency Management, using it to confidently state that probabilities of lightning were increasing as storms approached from the south. Lead time for action would have been within the 45 min to 1 hour range. Was able to confidently say they would see lightning within the 10 mile range a good 15-30 minutes before the first strike occurred within the range per the ENTLN network data. Below is the LightningCast time series as output on the webpage for the KPUB airport, which is very close to where the DSS event was taking place:
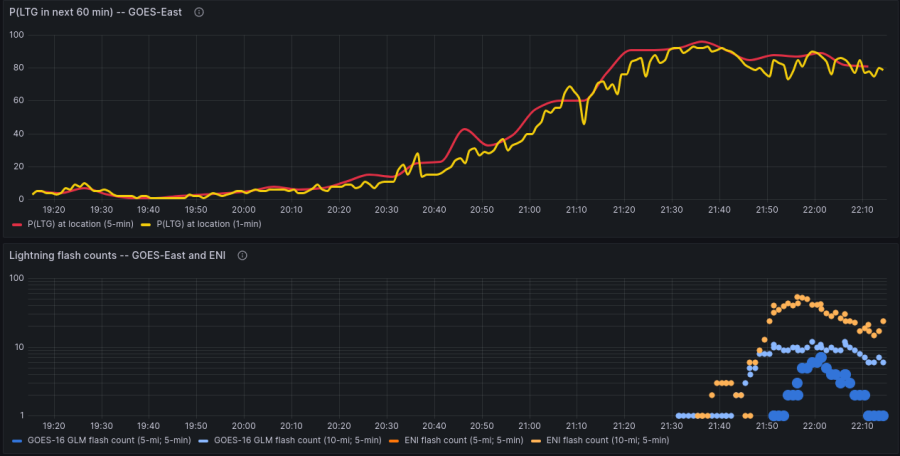
There is definitely some very actionable lead time here. As a forecaster, having this type of data available to me outside of AWIPS is a game changer. I know it may be challenging, but being able to click on a point like this and get this type of information would be huge for briefings and emails with decision makers. Right now we are limited to airports. Even a relatively coarse mesh that would allow me to pick a close point would be extremely useful if these images can’t be generated on the fly. Other possible ideas include only generating points within a certain LightningCast threshold (say 10%), or generating them on the fly based on a click query. That all said, even in its current form I will be using it going forward, and making a point to share it with my office and WCM for DSS.
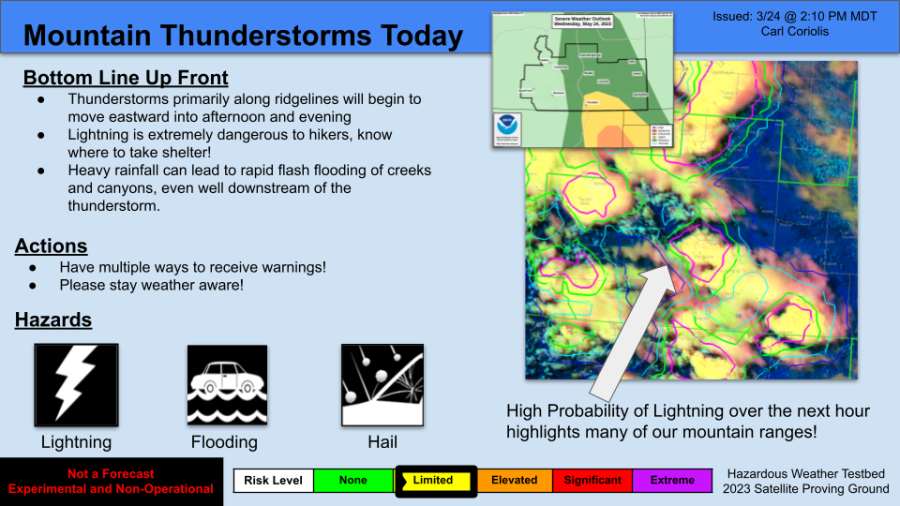
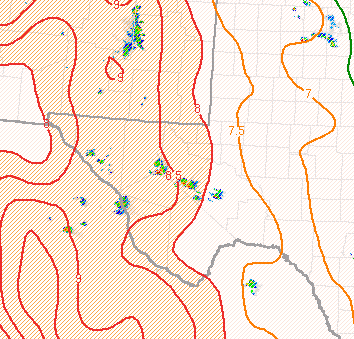
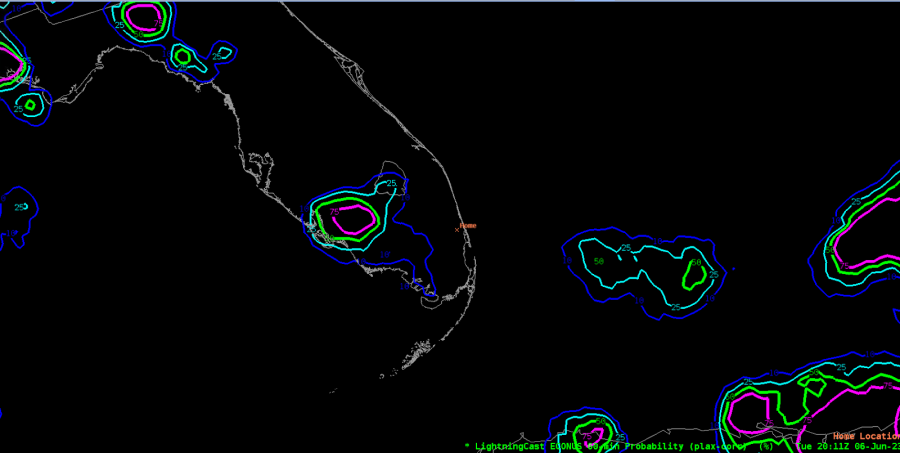
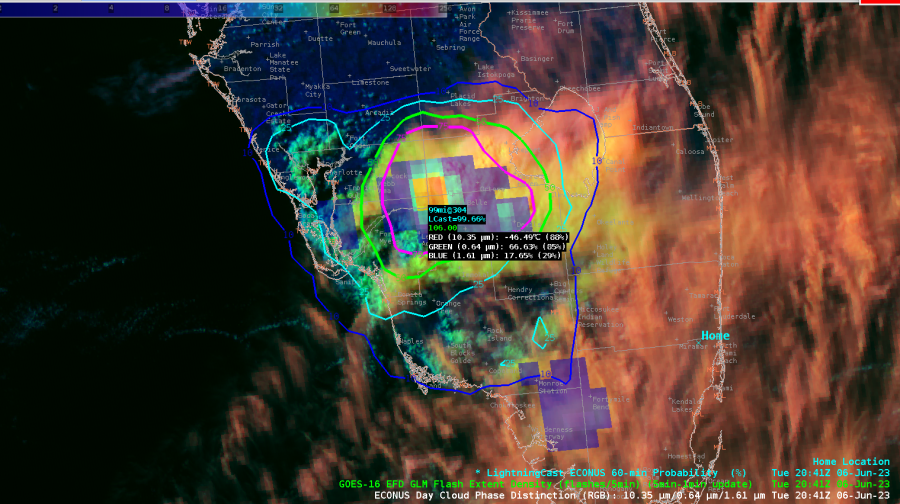
I also made a social media type graphic using the LightningCast product for hikers, given the large number of mountains within the CWA. Perhaps would have been a bit more meaningful to have sent this as storms were beginning to form, but they were already cooking once we got spun up and started. Highest probabilities were hugging the mountains where storms were forming. If I were formally posting to social media, I may have added some lightning safety graphics or something to that effect as part of the post (twitter thread, multiple images in Facebook post).
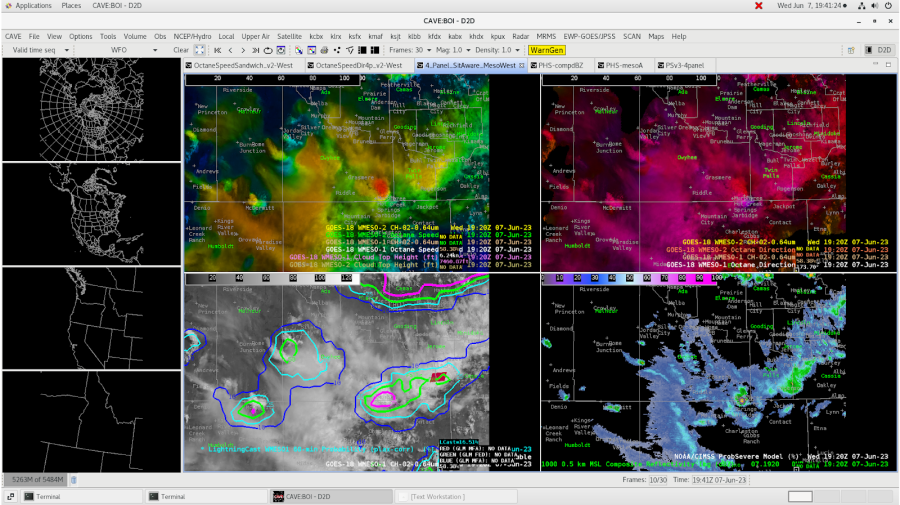
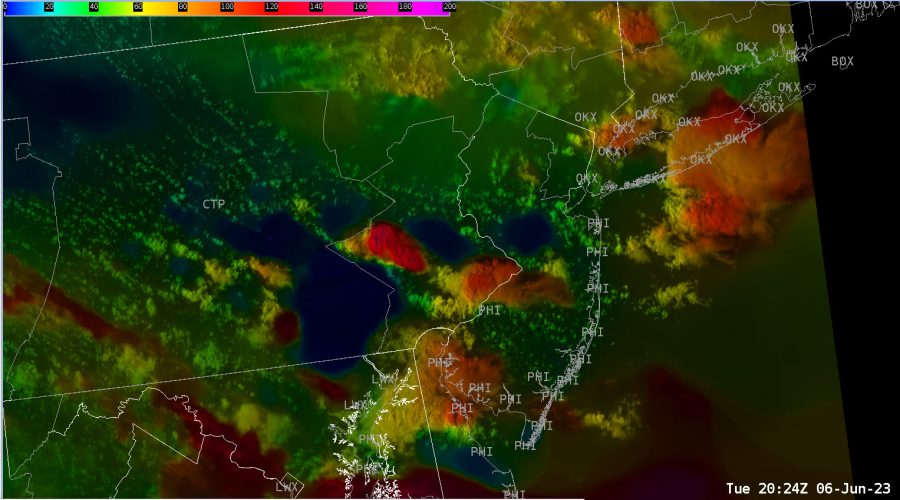
GLM RGB
This product does a great job in my opinion combining information from the FED and MFA. I found it useful for detecting lightning jumps within storms while still maintaining information about the overall coverage of lighting. Would happily use this as my primary GLM viewing option in AWIPS.
-Carl Coriolis


 -Thunderstruck