
Thunderstorms have been gradually increasing this afternoon along the west coast of Florida, and wanted to take a look at the evolution of the LightningCast product vs when flashes were first reported. Want to note upfront, there was an issue with GLM data, so used the 5-min (1-min update) CG/Cloud/Pulse ENTLN1 lightning plots to see when activity developed.
Below are images showing when the 25, 50, and 75% probability contours of lightning occurring in the next 60 minutes appeared, focused on Sarasota and Lee counties. For both counties, the 25% probability contour first appeared at 1838Z, 50% contour at 1851Z and the 75% contour at 1854Z. The first lightning strikes appeared in Lee County at 1858Z (a 20-min lead time from the 25% contour). The first strikes appeared in Sarasota County at 1906Z (a 28-min lead time from the 25% contour).
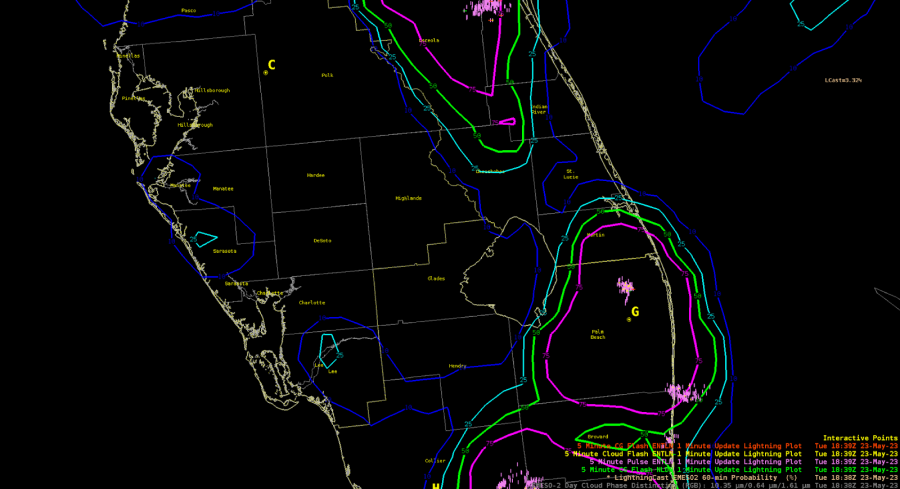
The image below shows the 25% probability contours showing up in the Sarasota and Lee Counties at 1838Z.


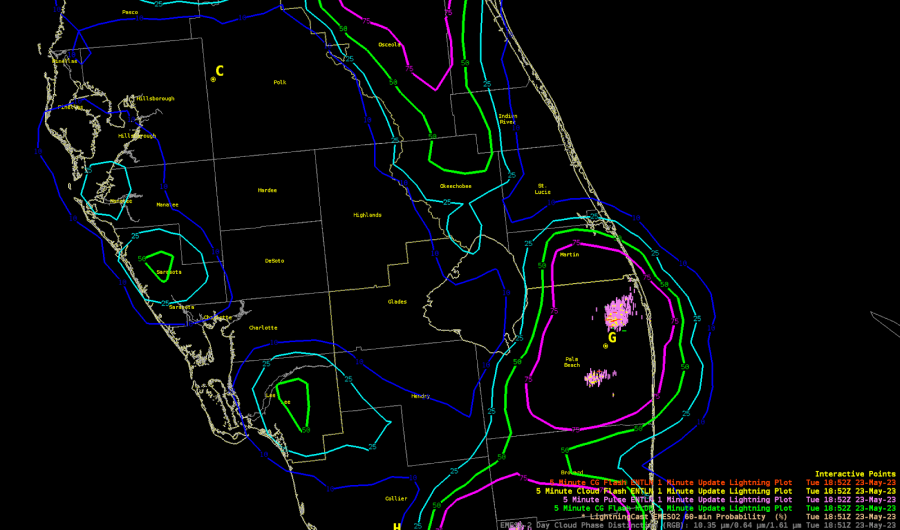
The image below shows the 50% probability contours showing up in the Sarasota and Lee Counties at 1851Z.


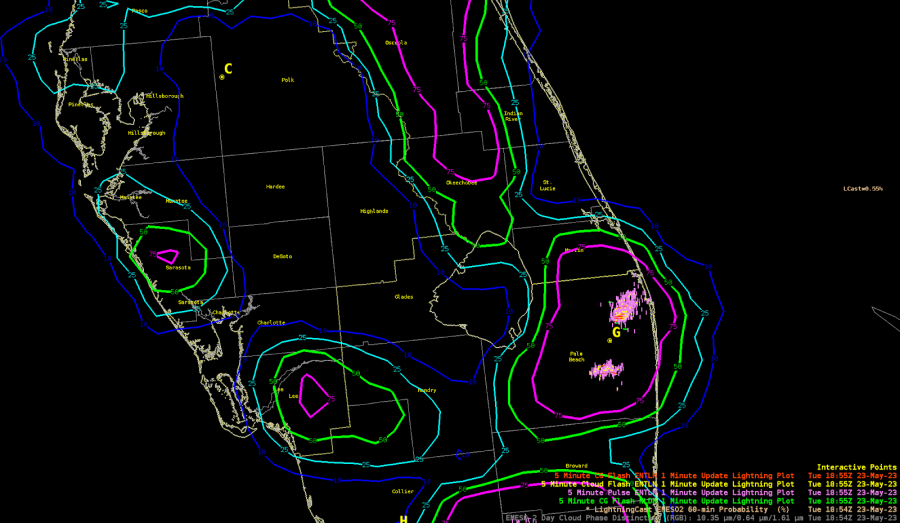
The image below shows the 75% probability contours showing up in the Sarasota and Lee Counties at 1854Z.


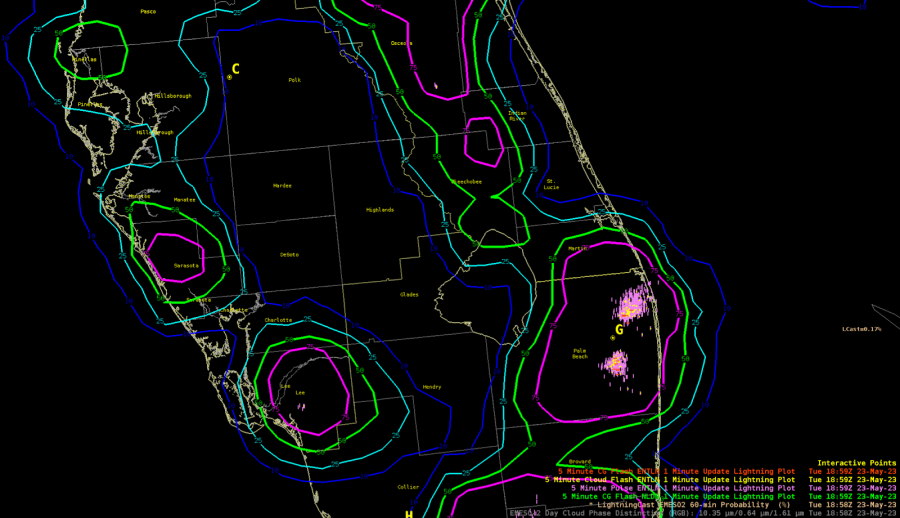
The image below shows the first lightning strikes showing up in Lee County at 1858Z.


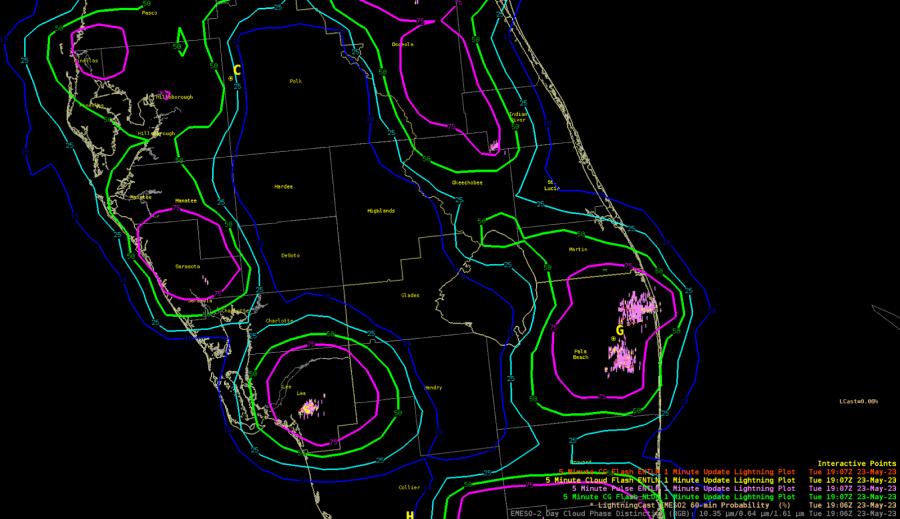
The image below shows the first lightning strikes then showing up in Sarasota County at 1906Z.


– Bubbles