Mid-level lapse rates are important in judging instability when combined with boundary layer moisture content in the lower levels. With boundary layer moisture being poor for much of the MAF CWA today, the low to mid level temperature profile may be even more important, as it will define both convective inhibition and CAPE potential with a greater potential for inhibition with such a dry moisture profile. The convective forecast in MAF for the day featured generally weak forcing mechanisms, focused on orographic lift and a moisture gradient on the eastern side of the CWA. With any sort of convective inhibition, it would be difficult to forecast convective initiation away from the strongest forcing points until later in the day when convection is forecast to move in from outside the CWA.
Shown below is the SPC mesoanalysis page depicting this afternoon’s 700-500mb lapse rates. The RAP guidance driving this page is showing very steep mid-level lapse rates of 8 to near 9.5 degrees/km over the MAF CWA. While steep mid-level lapse rates (indicative of cooler temperatures atop a warmer lower level air mass) are important for instability, very steep mid-level lapse rates could be due to a very warm low level air mass potentially creating a convective “cap” which may inhibit convection. With the very low surface dew points (into the 30s in some spots), a mid-level lapse rate exceeding 8.5 should mean convection struggles to initiate outside of areas of strong forcing.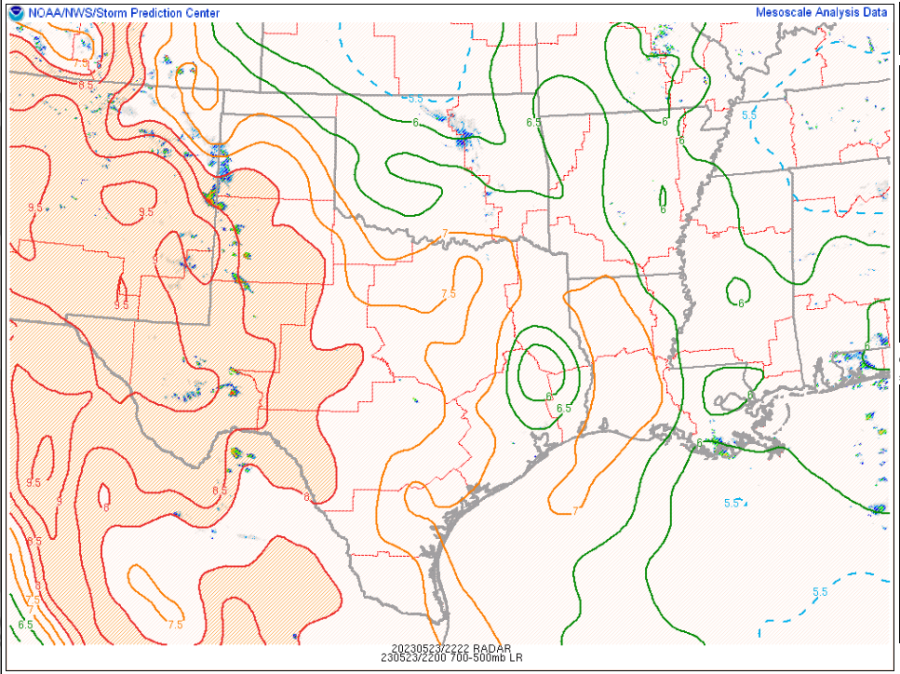
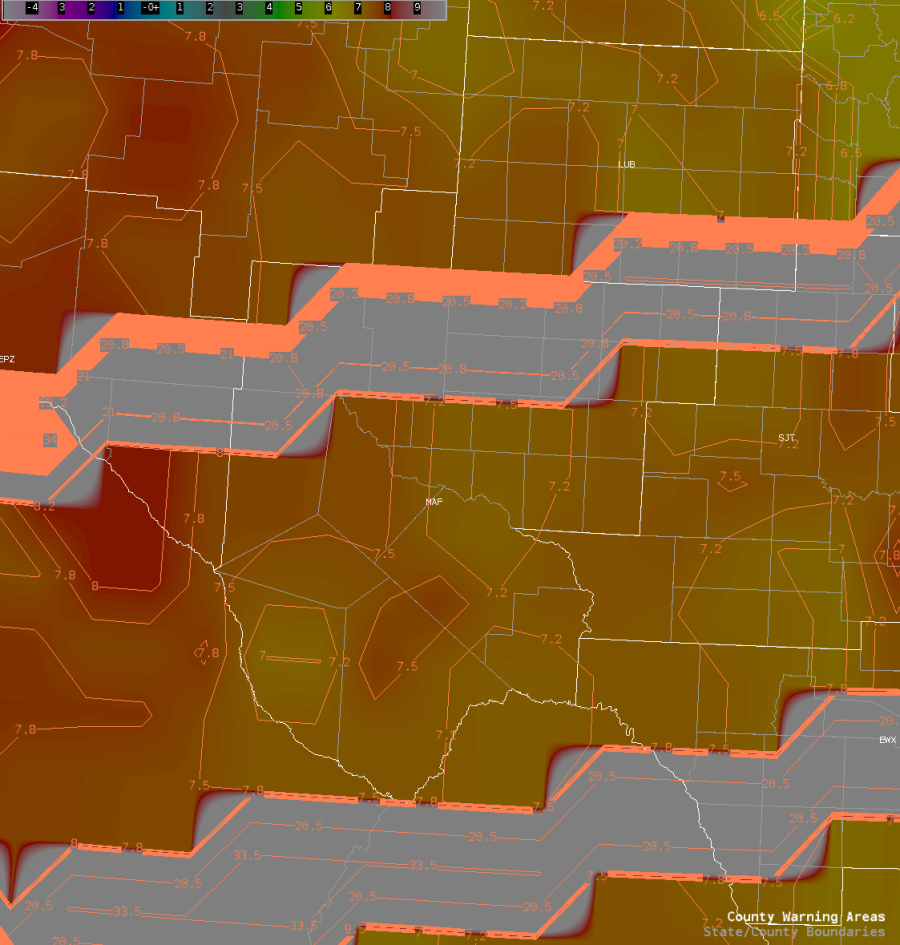
Looking at the afternoon NUCAPS satellite pass, it shows a fairly different picture for mid-level lapse rates over the MAF CWA. The observed lapse rates of 7 to near 8 degrees here are more normal for a convectively active environment compared to the 8.5 to near 9.5 degrees given by the RAP guidance. It’s worth looking into how NUCAPS and guidance is handling temperatures at different levels to understand the differences between the lapse rates.
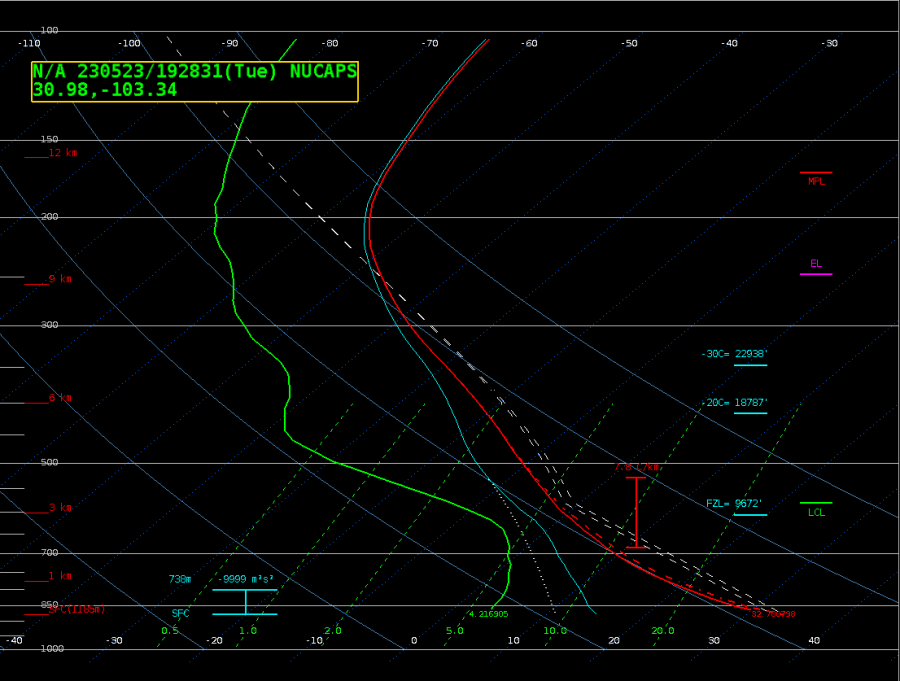
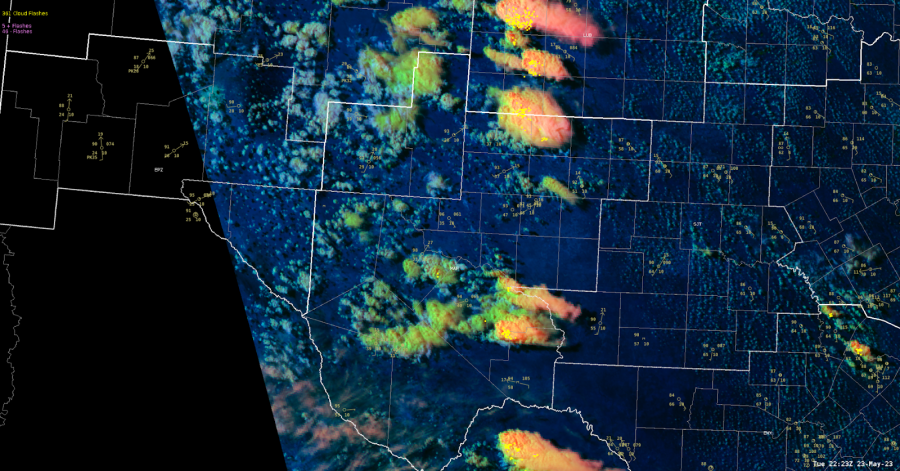
Shown below are both the NUCAPS sounding (first) and then the RAP sounding for a similar spot near the center of the MAF CWA. It’s interesting to note that it isn’t actually the 700mb temperature that is the main difference between the two soundings, but the 500mb temperature, with a 2-3 degree difference at 500mb. This could explain why there is still convection away from the previously discussed initiation points (such as out in the Fort Stockton area), however the warmer than forecast 500mb temperatures could be indicative of an environment that isn’t quite as unstable as forecast, and why the central MAF convection is notably weaker than convection well to the north in the Lubbock CWA. There are other contributing factors of course (weak surface convergence, very dry low to mid levels), but this is a major factor in judging updraft strength potential, and today lines up with where updrafts have develop but struggled to truly develop into strong or severe thunderstorms. The late afternoon Day Cloud Phase Satellite product shown below includes the non-severe convection in the south-central portions of the MAF CWA with the severe convection to the north (and their noticeably better defined anvil clouds).
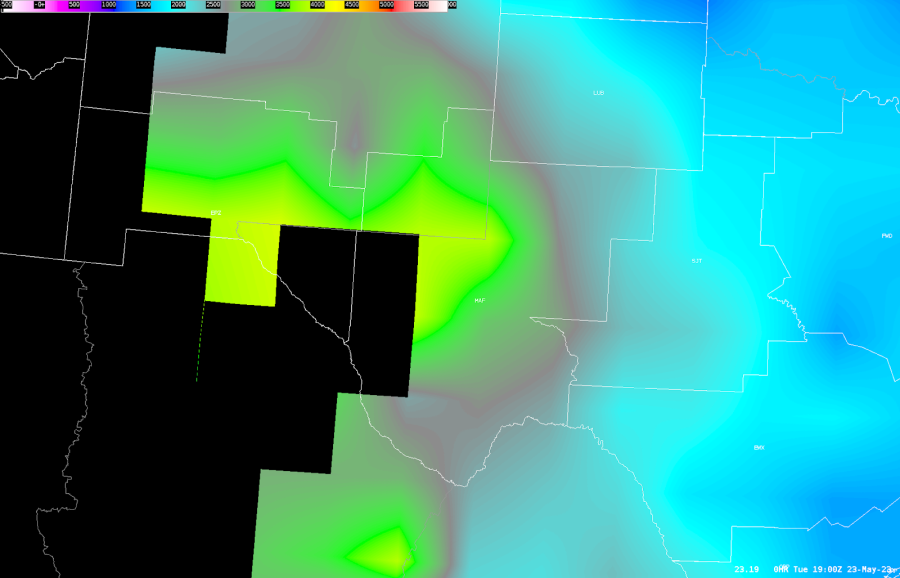
One quick screenshot to show is the NUCAPS LCL product, highlighting the better moisture on the eastern and northeastern edge of the CWA, lining up with the higher SPC risk.

-Joaq
