
PHS Model Analysis
PHS model struggled to properly capture convective initiation within the Texas Panhandle on the day. While it did see a few cells possibly starting, overall coverage was significantly underdone with many of these storms reaching severe thresholds including numerous reports of hail over 1″. The overall output shared many of the same struggles as the HRRR model on the day. Unclear what the exact problem was, but dry line convergence may have been better than in models on this day.
Above: 15Z PHS model output forecast for 17Z to 22Z from 5/22 with MRMS Reflectivity overlaid.
Below: 15Z PHS model output for 17Z to 22Z from 5/22.
NUCAPS Forecast
As I was beginning to test out these products, this caught my eye as a forecaster on the east coast that regularly deals with Cold Air Damming along the Appalachians. Models regularly struggle with multiple aspects of the dam, including extent, depth, and actual temperature and strength. Additionally, one of the most common pathways for large winter storms in the southeast is when low pressure passes across the Gulf Coast and into the Atlantic while an Arctic high in the northeast helps drive cold air damming into the area. Models again struggle with the dam, but also with strength of the warm nose aloft. I would love to see how this system performs in these scenarios – I know it isn’t “convective”, but it still is an incredibly impactful event, where the strength of the warm nose can be the difference between a few inches of snow or half an inch or more of ice. We regularly attempt to send up special soundings to get the best sample we can, but since GSP does not do a sounding, we rarely get a meaningful sample of the cold air damming in the SE states.
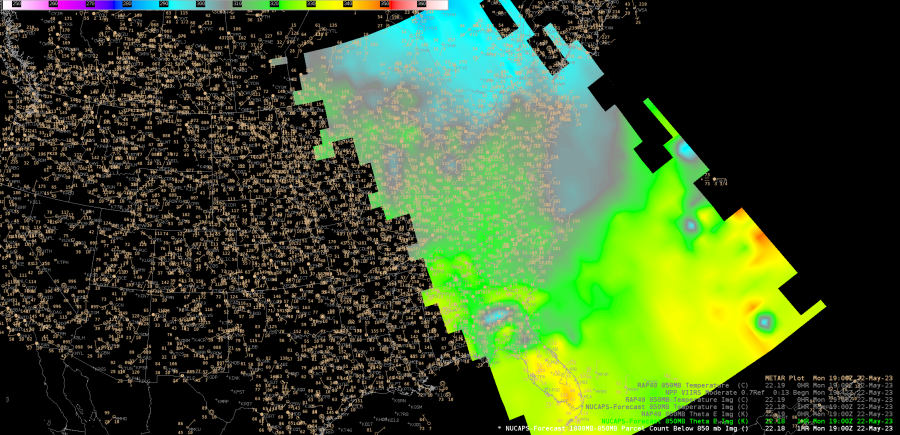
Above: NUCAPS Forecast from morning pass over east coast showing CAD feature over the east coast.
Octane Speed and Direction
Above: Octane image around 22Z for storm just south of AMA.
The Octane product was extremely useful in seeing when updrafts were really “taking off” and hitting the tropopause, immediately highlighting storms which require quick attention. Another extremely useful feature is sampling the actual speed, which gave a potential proxy for storm top divergence. Noticed that the Octane product gave a value around half of what the radar was measuring on this storm – ~50 kts on the Octane product vs ~100-110 kts on the radar. I’m assuming the resolution combined with some of the smoothing within the algorithm may be playing a role here, but it would be interesting to see if there is a consistent way to match the two up, even if there is just a “rule of thumb” or something. This would be huge in areas of sparse radar coverage (portions of the west or the ocean, for example).
Below: Radar image of storm top divergence near 22Z from KAMA.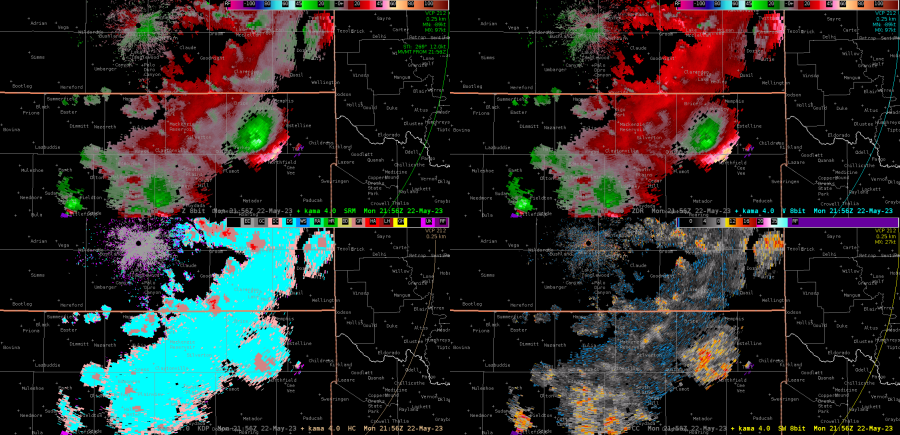
ProbSevere v3
Noticed an interesting time period where two close updrafts – one fading, one picking up, resulted in some jumping of the ProbSevere product as it would sometimes combine the objects and then sometimes track them separately. I think this shows the importance of pairing the algorithm with analysis – just looking at the time series of the product could lead to misinterpretation of what was happening.
-Carl Coriolis