All Sky CAPE dropout between time steps

I would like to be able to load ALL-Sky LAP Data Type and CAPE on top of radar data. An unfortunate annoyance is that if the time stamp is too far from the radar product time stamp, the All-Sky products completely disappear,  and in fact, if too far away, it won’t load at all. I would like the ability for the latest All-Sky products to display, despite the time lags between the the two. In other words, I would rather have the latest “old” data from All-Sky rather than display nothing.

ZDR_Arcophile


Minimum Flash Area Shows all the Features

As we move towards sunset, the MCS continues to munch across the southeast Tejas, Louisiana, and portions of Arkansas.  There is alos a strong storm developing ahead of the MCS in SE Louisiana.  Add in some storms across Northwest OK and there is whole spectrum of flash sizes is showing up now:

What is neat about this image is that the small flashes (purple) are concentrated near the overshooting tops of the storms.  The  large area flashes (red to white) are in the trailing stratiform area.

One other cool tidbit I just saw in this loop; watch the southwestern part of the line where a storm weakens and dissipates; flash area basically shows that all electrical activity ceases along with the storm.  Looking closer:

-Dusty

The Life and Death of a Gulf Storm Through the Eyes of Experimental Products

In this case of a rapidly developing storm, GLM data was leaned on to issue a SVR Warning on what otherwise may have been a marginal storm. AllSkyLAP showed the storm was developing in an area of MLCAPE values over 2000 J/kg, and ProbWind model had rapidly increased to ~50%. GOES-16 1-minute imagery showed rapidly cooling cloud tops, with a sharp increase in lightning activity. Given GLM values comparable to other severe storms on the day a SVR warning was placed on the storm. The warning was sent out relatively early to try to capitalize on lead time.


Radar w/ ProbSevere:

IR-Sandwich:

Flash Event Density:

Minimum Flash Area:

Event Density:

Total Optical Energy (too fast, whoops!):

AllSkyLAP CAPE:

ProbWind Model Increase:


UPDATE: Shortly after warning on the storm, it completely fell apart after failing to become rooted in the boundary layer and all indicators (i.e., ProbSevere, GLM imagry) dropped to null. Initial warning was shamefully cancelled.

Really living up up to my name!


Radar w/ProbSevere:

Flash Event Density:

ProbWind Model Increase:


#ProtectAndDissipate


ProbSevere & Satellite Imagery

Although ProbSevere products are typically used coincident with radar data, but can also be applied to satellite imagery. Using ProbSevere with satellite imagery can provide a visualization as to where the strongest parts of a thunderstorm may be located .

This loop shows developing & strengthening convection across the Texas Panhandle and far western Oklahoma, via Day Cloud Phase imagery with ProbSevere overlaid.

Situation Awareness using AllSkyLAP CAPE gradient

As a good tool for a mesoanalyst, the enhanced gradient for CAPE within AllSkyLAP would indicate an area of focus for discrete convection forming along the southwest flank of the line of convection that fizzled earlier. This area would be a place to focus for future possible convection.

ZDR_Arcophile


Scale (and color table choice) is Everything

Big flashes taking place in the stratiform region of the departing MCS across the eastern third of Texas.  A LOT of big flashes:

But that doesn’t tell the full story; there are a LOT of big flashes but they are being masked by the scaling of Flash Area.  Right now the scale runs from 64 km2 to 2000 km2.  What happens if we bump that max side up to 4000 km2?

There we go, a bit better discrimination on the big-side of the scale!  It may be hard to see but there is one “white” flash in there; a slightly larger 4600 km2 flash southeast of DFW.

That. is. Yuuuuuuuuuuge.

So, lesson of the day; check the values of flash size (or any flash component).  See if there are values past the end of the current color scale.  Right click on the appropriate product, select Change Colormap , and bump that up some.  May be able to pull out a bit more information than what comes as the default.  Once again however…YMMV.

-Dusty

Modified NUCAPS Sounding

At 19Z, the modified sounding southwest of KARM compared to RTMA was about 2 degrees cool for temperature and 5 degrees cool for dewpoint, presumably due to temporal interpolation issues. Still is a useful tool.


ZDR_Arcophile


GLM Viewing Angles – what it means

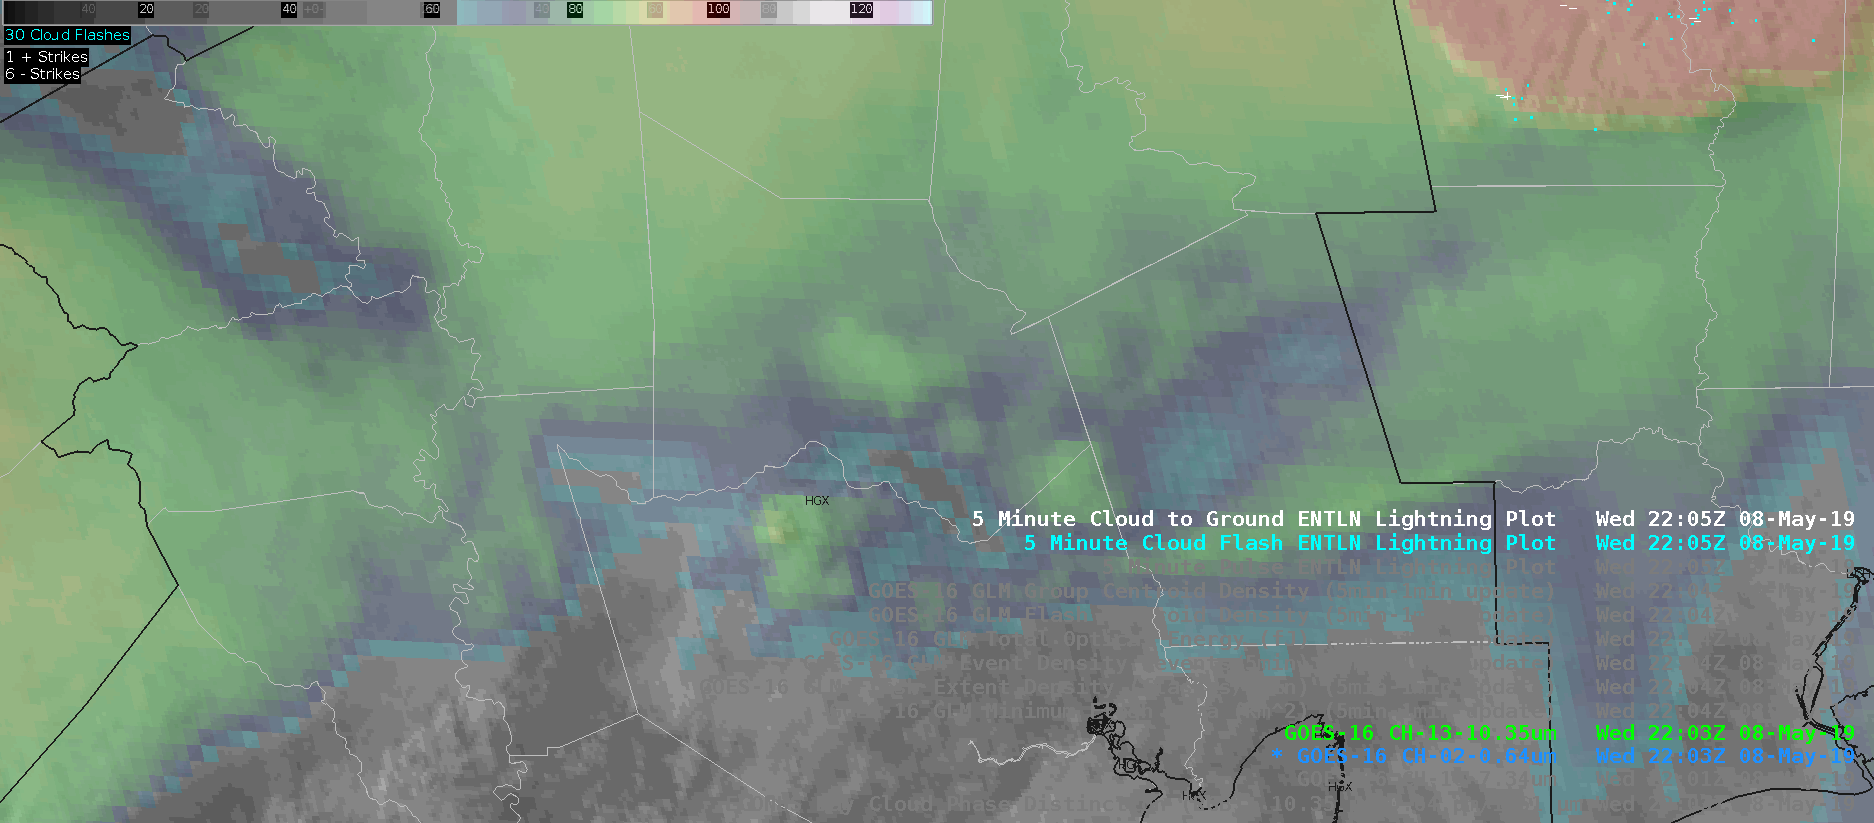
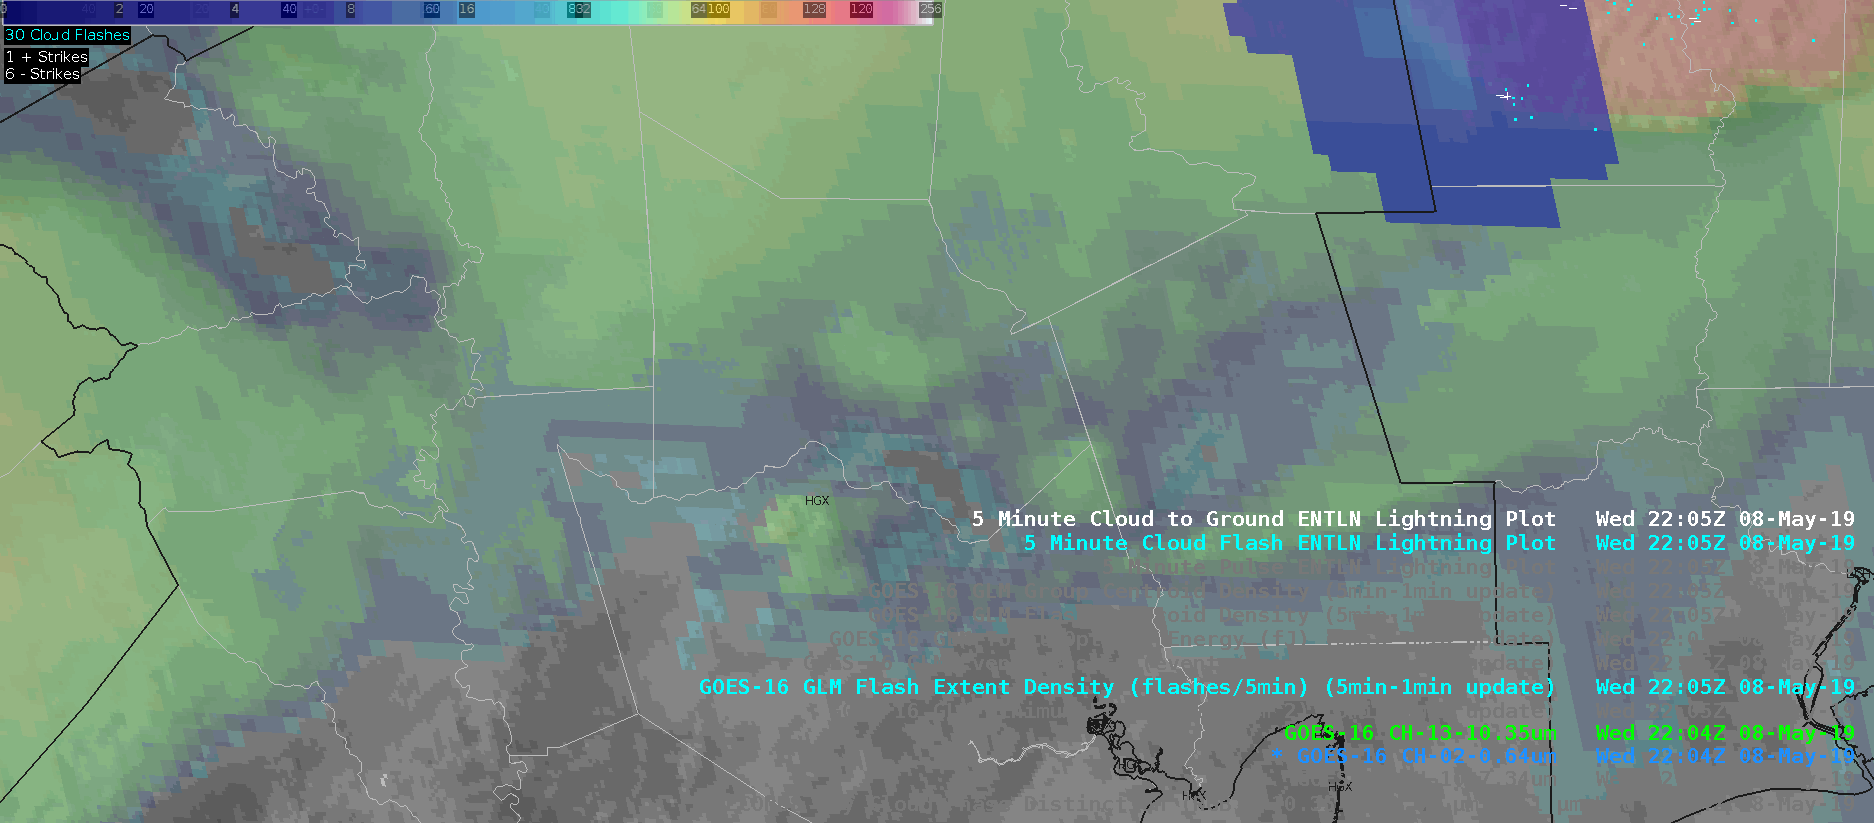
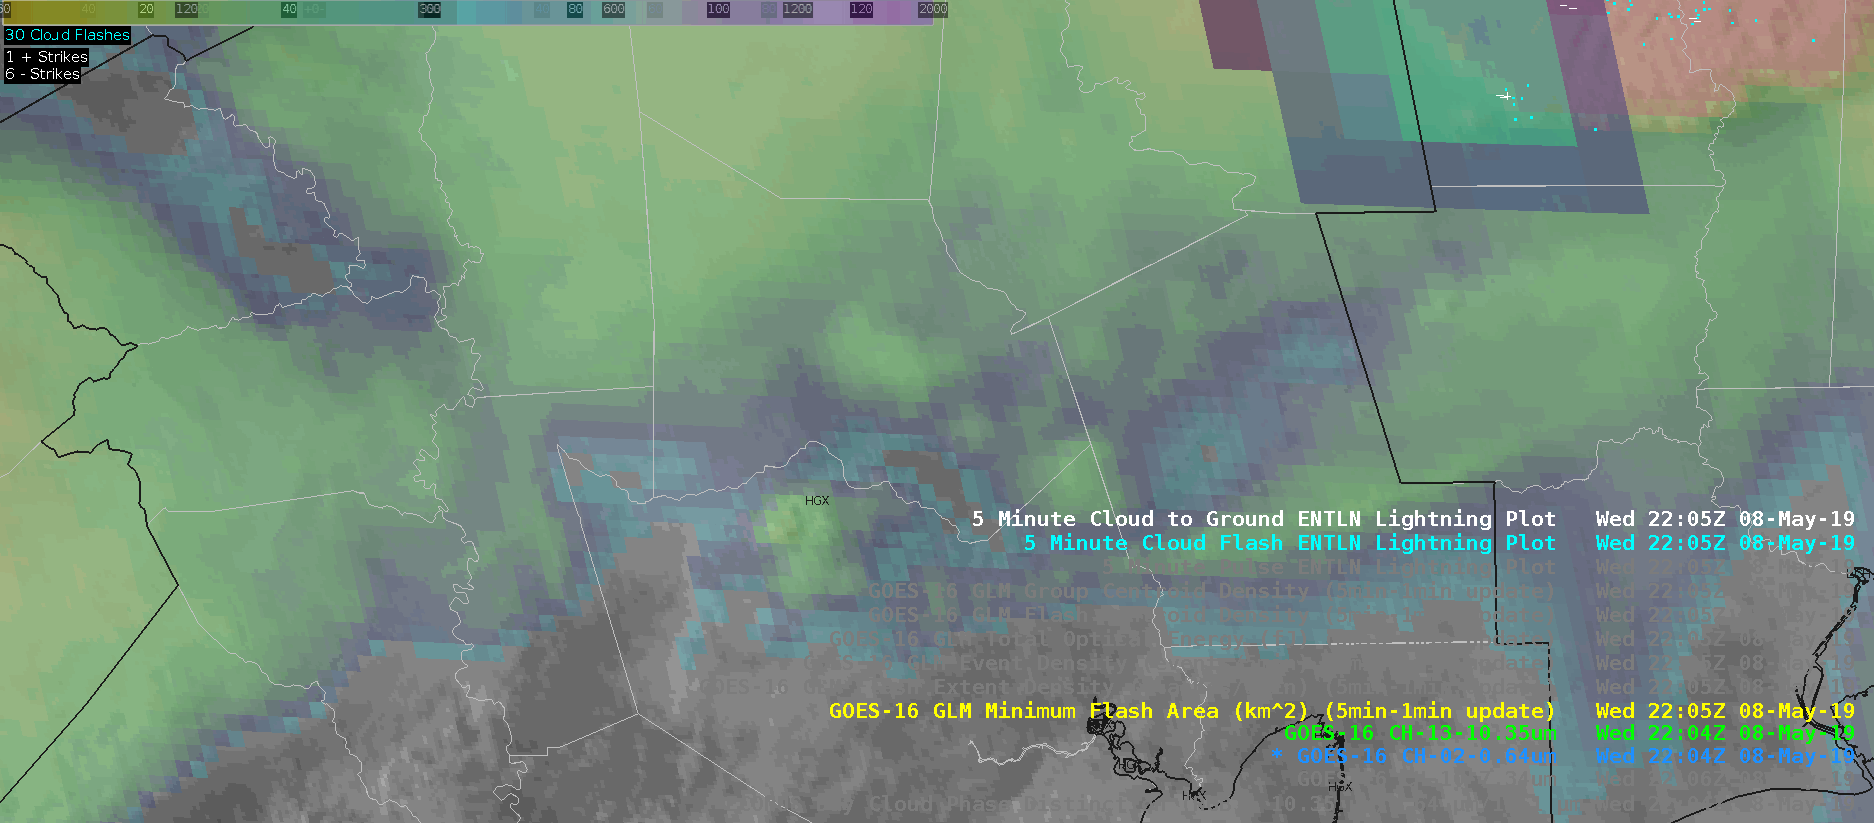
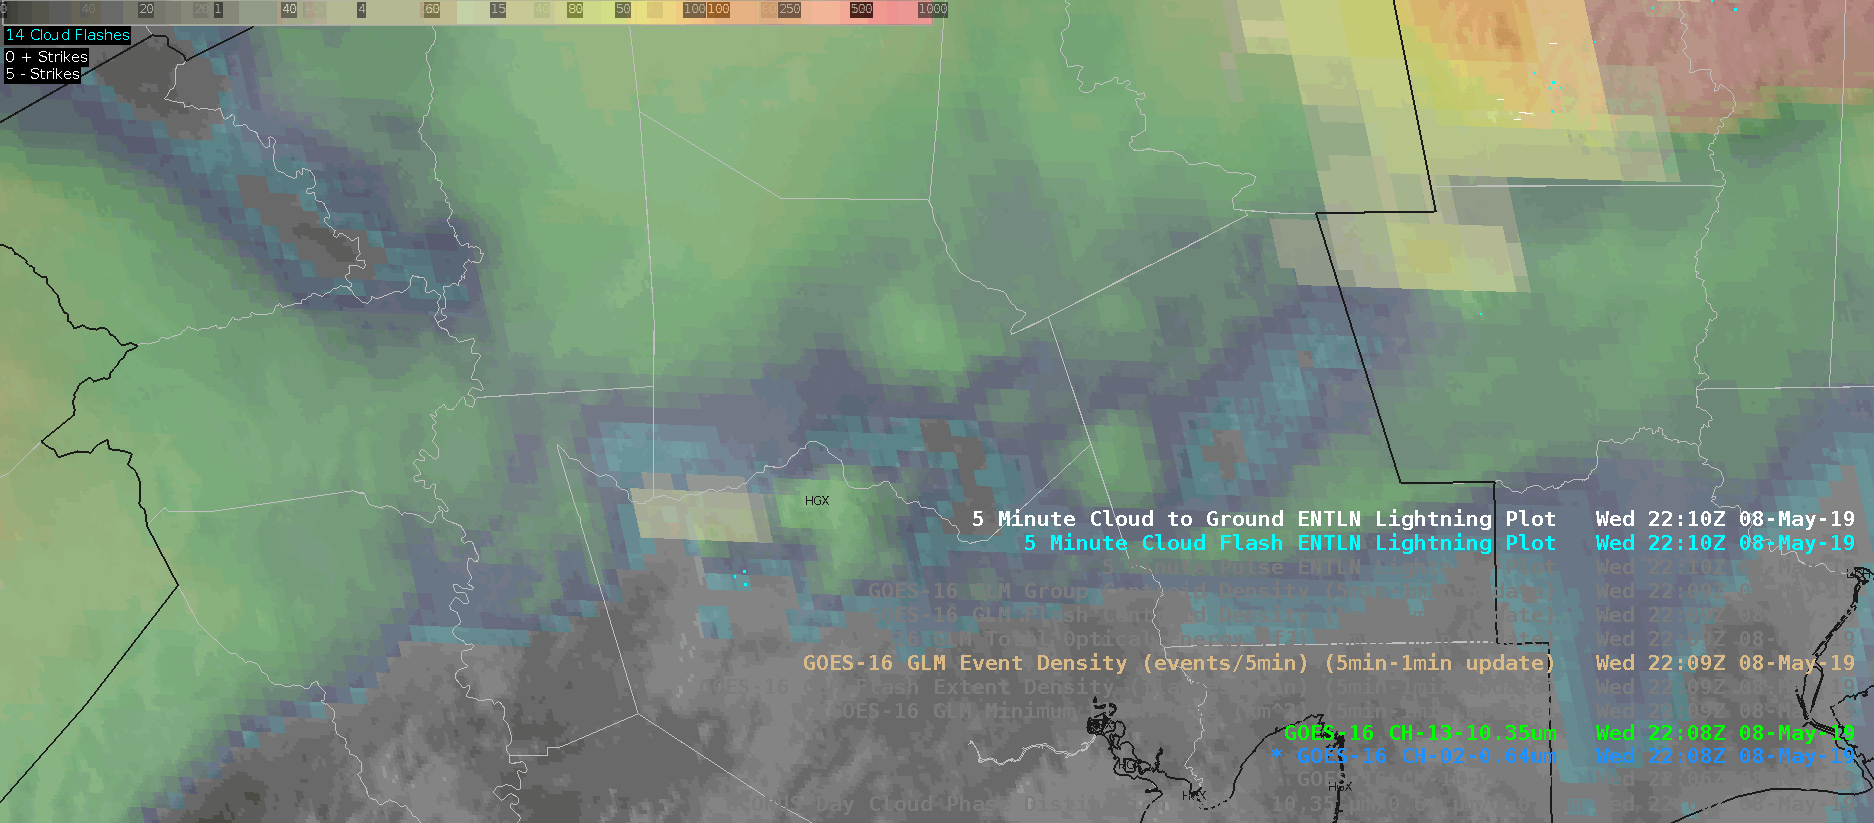
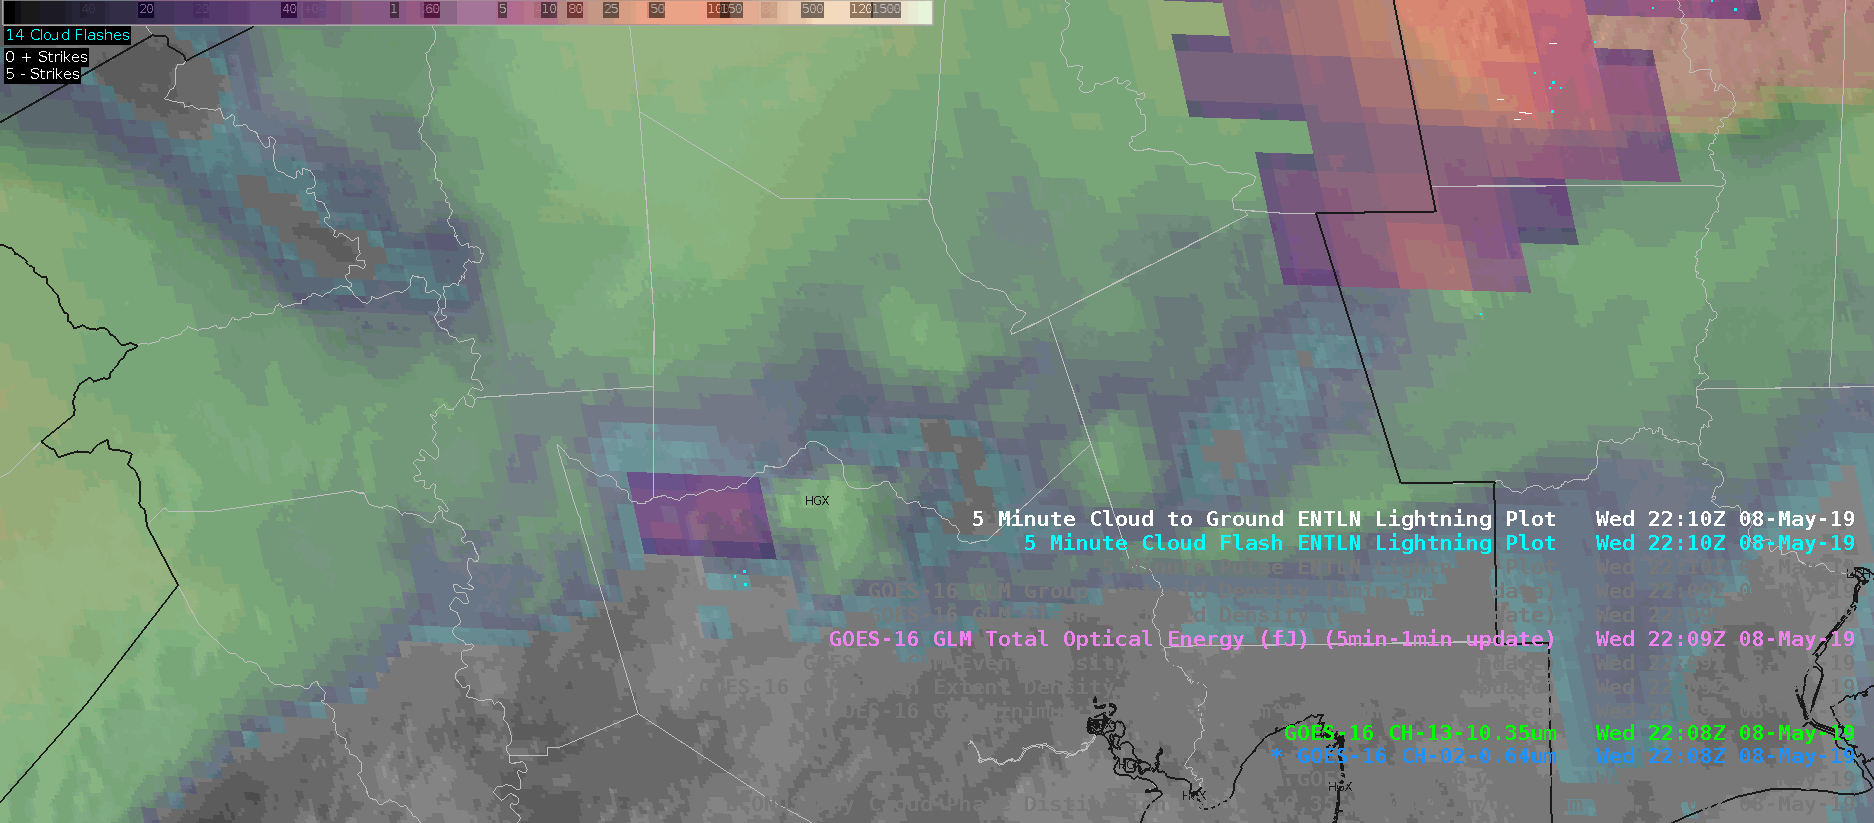
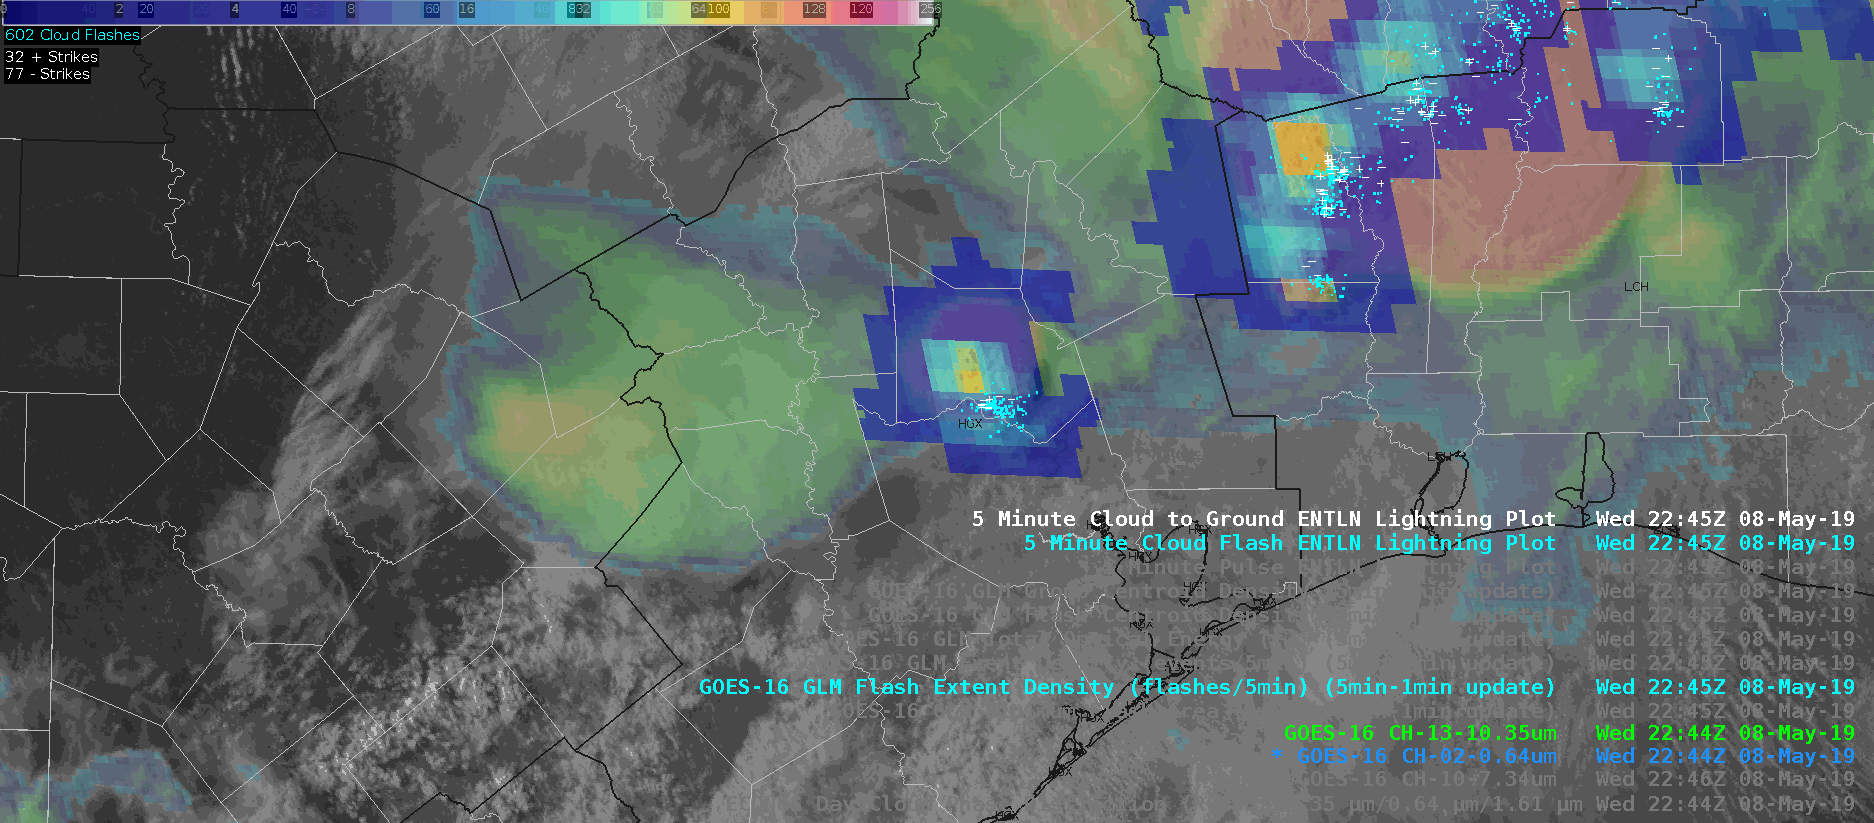
Having both GOES-E and GOES-W GLM data provides some interesting opportunities to compare how the two instrument’s viewing angles impact the data.  Sometimes it does, sometimes it doesn’t.

First case, it confirms the large flash size in a flash across the Texas and Oklahoma Panhandles into Kansas: top image is GOES-W and bottom image is GOES-E.  The white flash is over 2000 km2; G-17 was 2140 and G-16 was 2685.  Not bad!  This was probably a flash extending  from convective cores in northwest Oklahoma back into the anvil region.

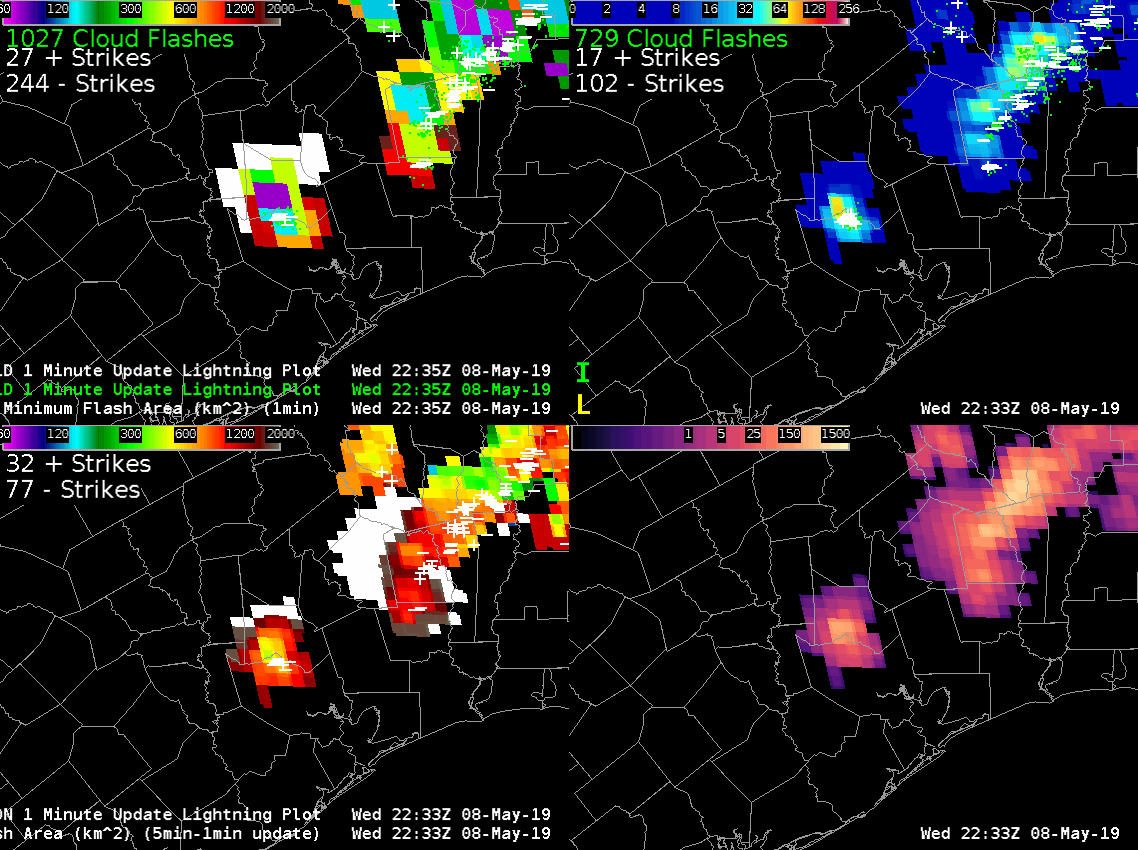
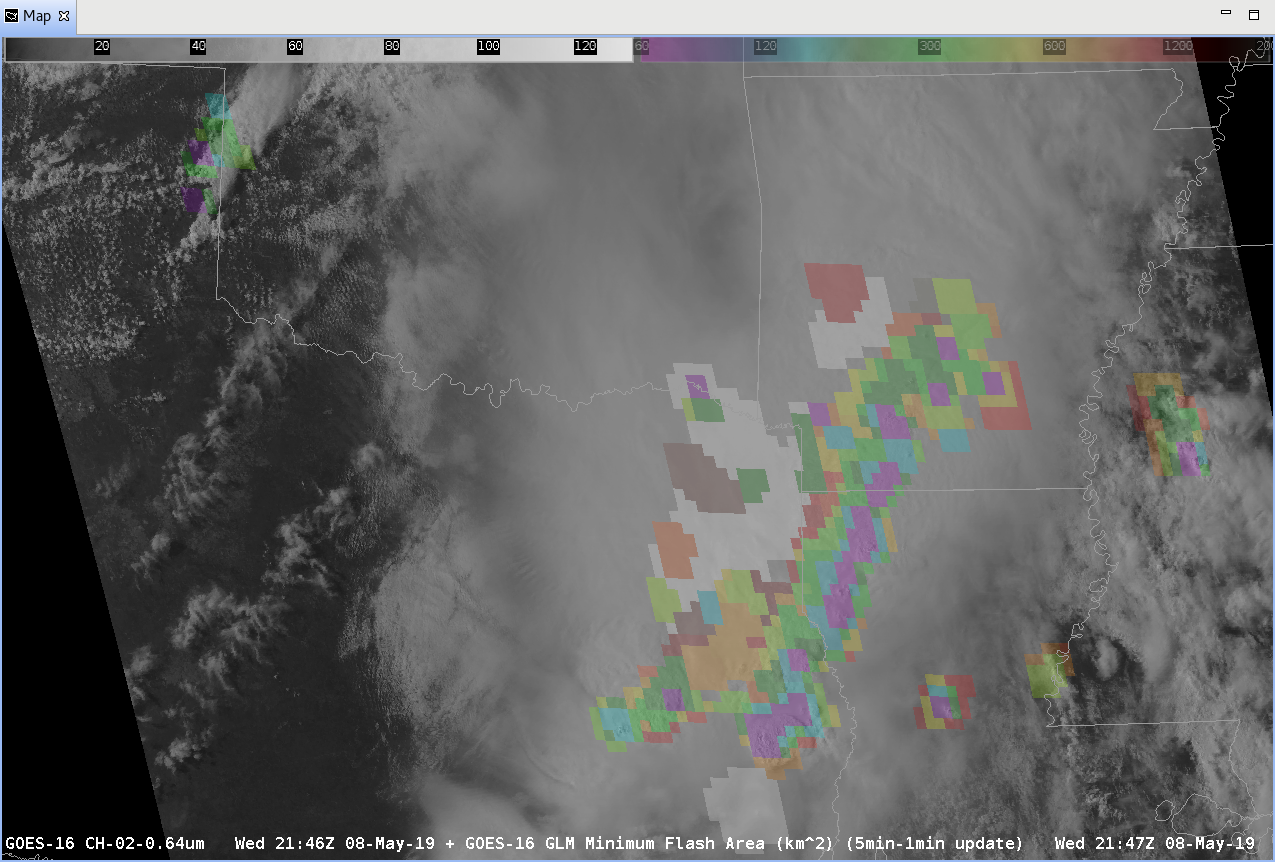
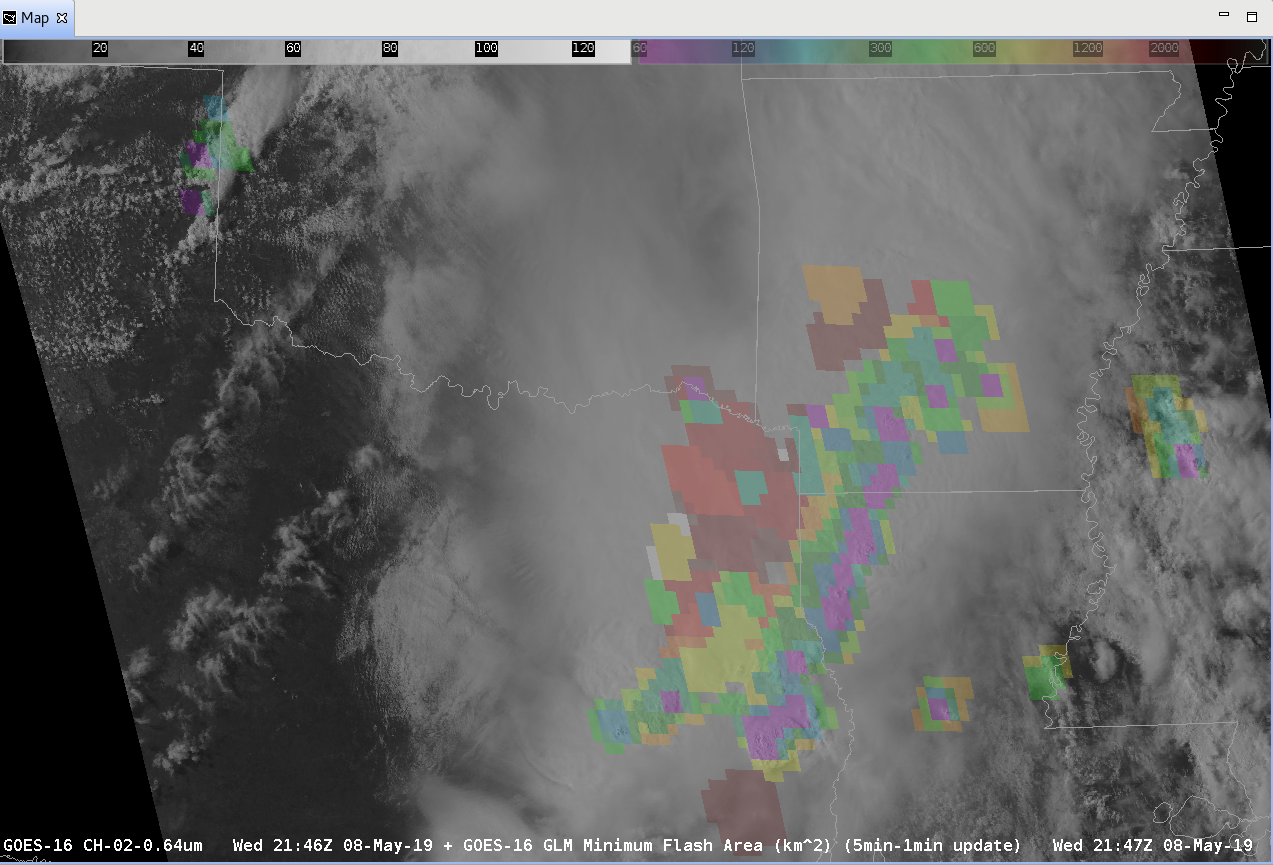
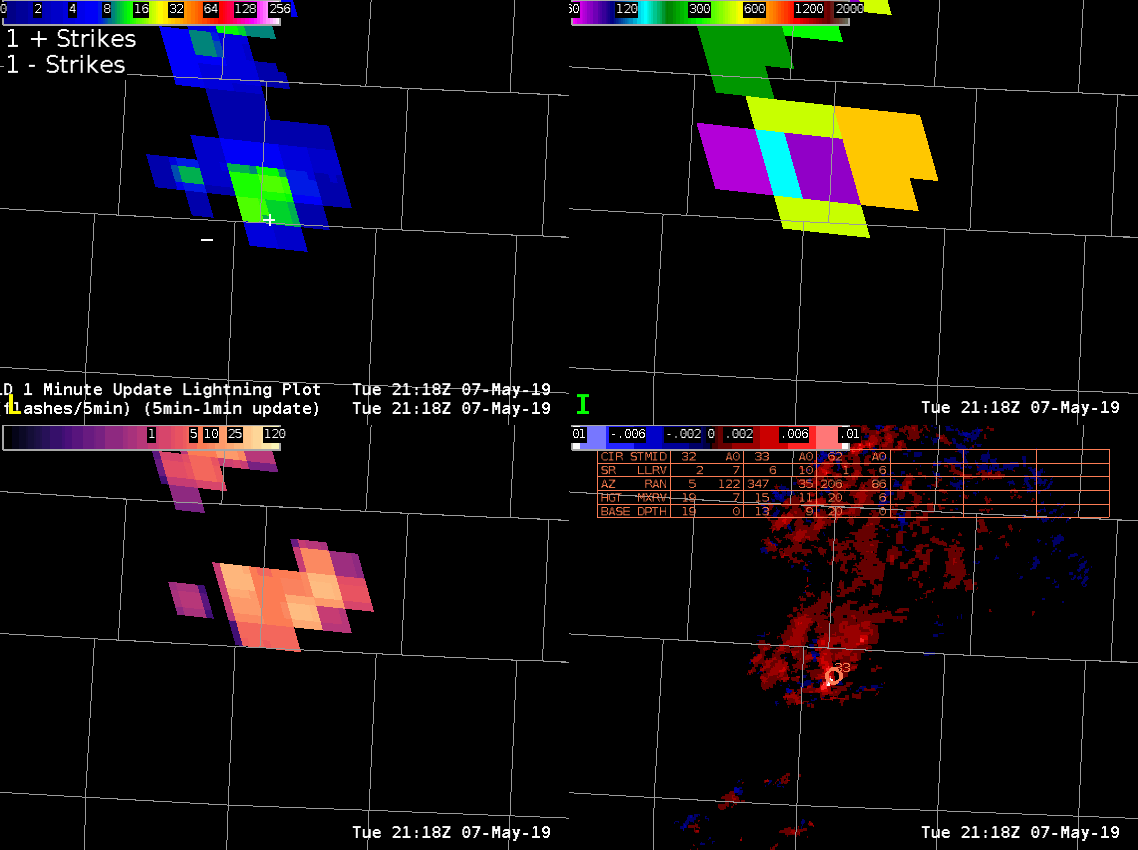
But now let’s look at a different flash; this time a bit further south.  The top image is G-16, bottom is G-17.

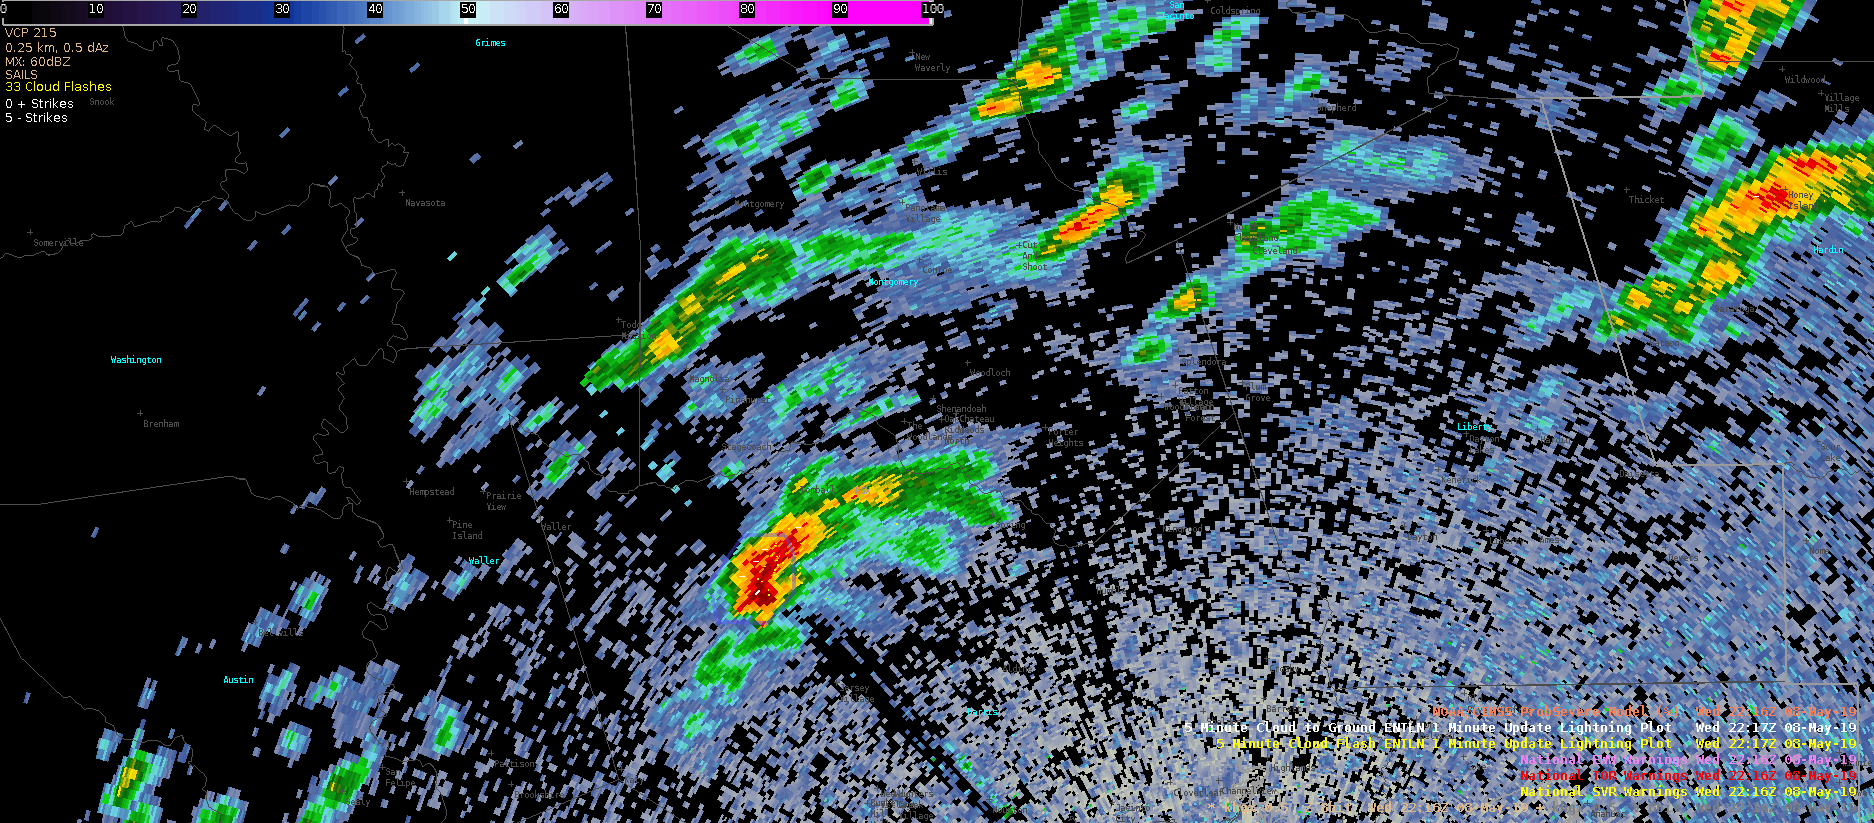
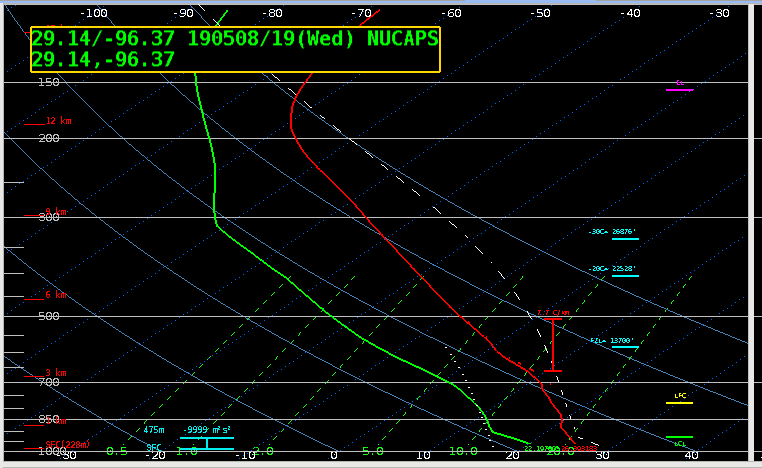
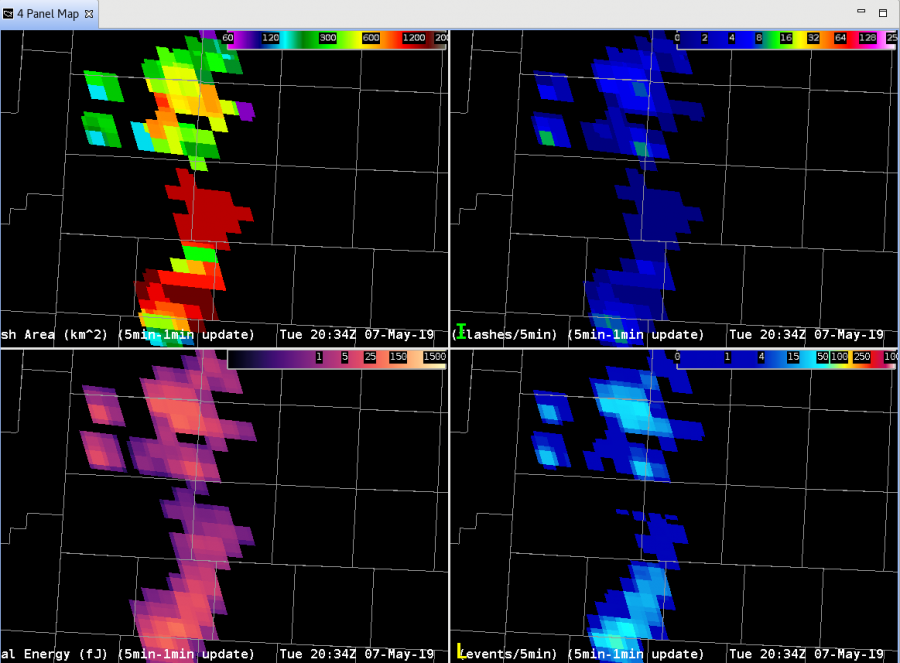
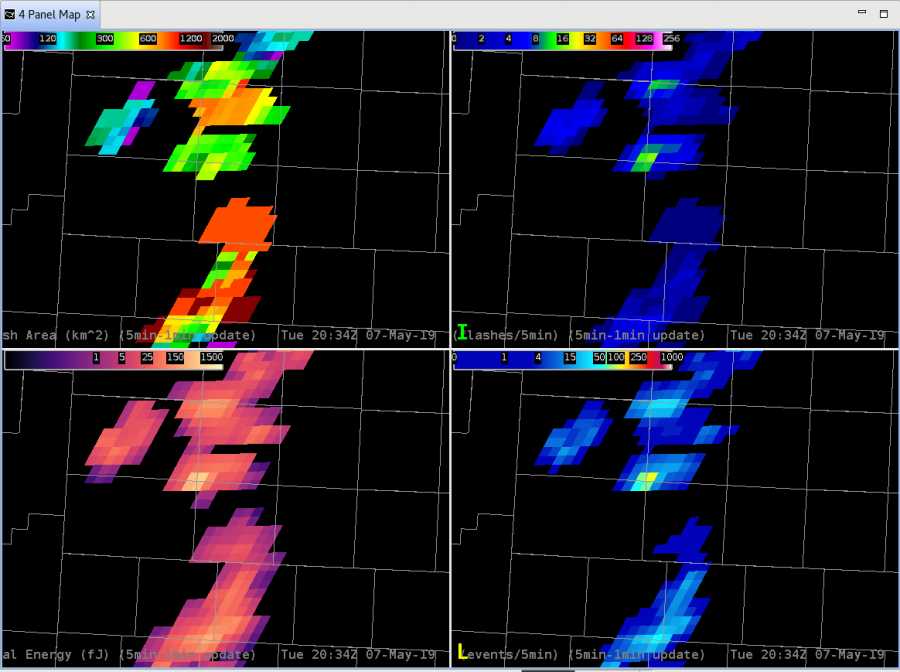
The white flash in G-16 was shown as a 2262 km2 flash while G-17 in dark red was only 1096 km2.  Why the big difference?  Probably the different viewing angles.  The image below is centered on a strong overshooting top that the flash in question above originated around:

G-16 has a more favorable viewing angle on this flash looking towards the updraft/overshooting top from the southeast.  G-17 may have had some of the weaker portions of the flash blocked by optical depth of the anvil or being underneath a part of the overshooting top.

The implications are that depending on the orientation of the storm to the GLM instruments; checking both will perhaps provide confidence in the evolution of Flash Area and potentially other GLM flash products as well.

-Dusty

Lightning Jumps in Action

The storm near Tulia is…impressive.  Aside from being a long-tracked supercell, the storm has been extremely active electrically.  There have been several lightning jumps with this storm that appears to coincide with an increase in the strength of the mid-level mesocyclone.  First we will take a look at an hour long loop (TL – Flash Extent Density overlay with Vaisala GLD, TR – Minimum Flash Area, BL –  Optical Energy, BR –  Mid-level Azimuthal Shear (3-6 km AGL) with New Mesocyclone Detection Algorithm Overlay) :

There are two jumps to take a look at, 1) between 21:29 and 21:40, 2) 21:55 – 21:20.  Although the AzShear product doesn’t show a strong mid-level meso developing, the number of positive CG flashes in the GLD data increases and we see continued small area flashes in the core.  The more impressive jump is the second one;  AzShear shows a much more pronounced area of positive shear, a long-lived NMDA indication (the circle with 4 pips on it), and overall smaller flashes in the area of that storm.

Shortly after the last jump (and not shown here), live stormchaser feeds showed a rapid strengthening of low-level features; well defined wall cloud, organized rotation, and frequent CG activity sending a flurry of stormchasers heading east to get out from under the storm…

-Dusty

Big, Bad Flash or Bad Big Flash…Update

Well, one piece of the puzzle was solved.  A second large flash in the Minimum Flash Area  product occurred between Lubbock and Amarillo, around 1500 km2.  To see what was going on, we now take a look at the difference between GOES-16 GLM:

and GOES-17 GLM:

After a LOT of going back and forth, we realized that the color table for Flash Extent Density had the alpha at zero for anything around 1.0 to 1.244.  SO, the previous example that showed no FED actually DID have data associated with the large flash; it was hidden (my bad!).  Fixing the color table to plot any data greater than zero at the darkest color blue and…voila! The large flash now does show a FED of 1.0.  So that problem is now solved.

However, there is still a question as to why that big area flash occurred where it did, when it did, and if it was actually as large of a flash as indicated.  Still something to dig into further!

-Dusty