Big, Bad, Flash or Bad Big Flash

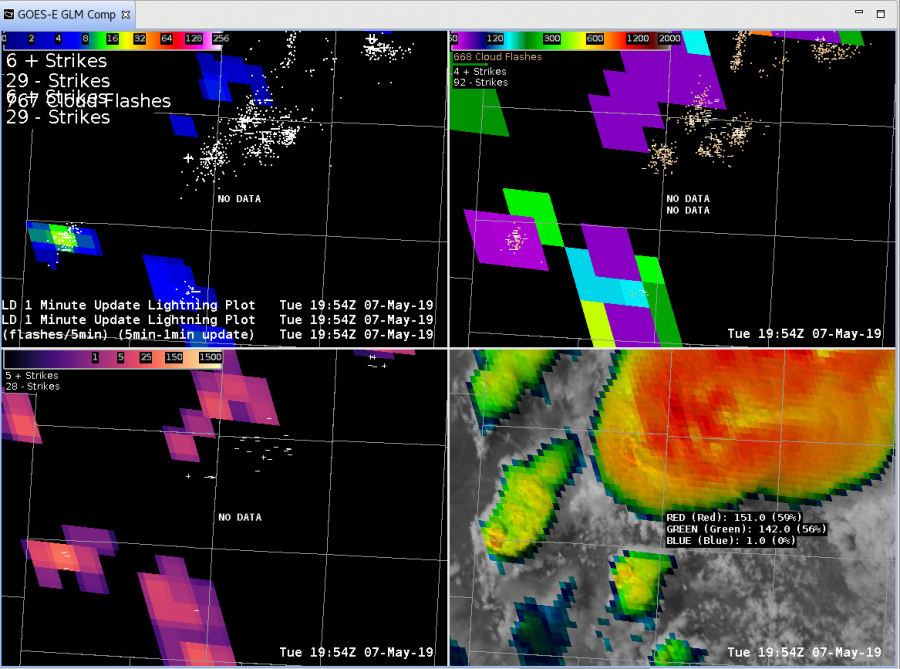
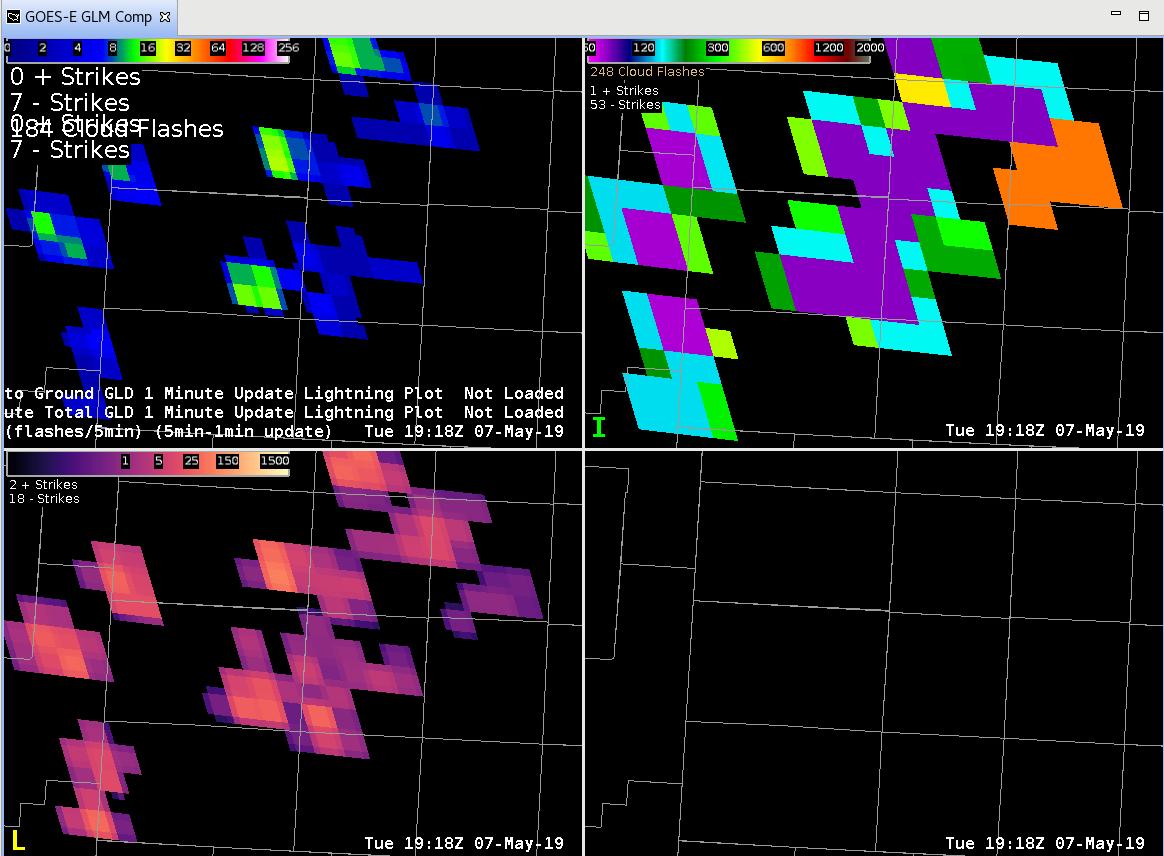
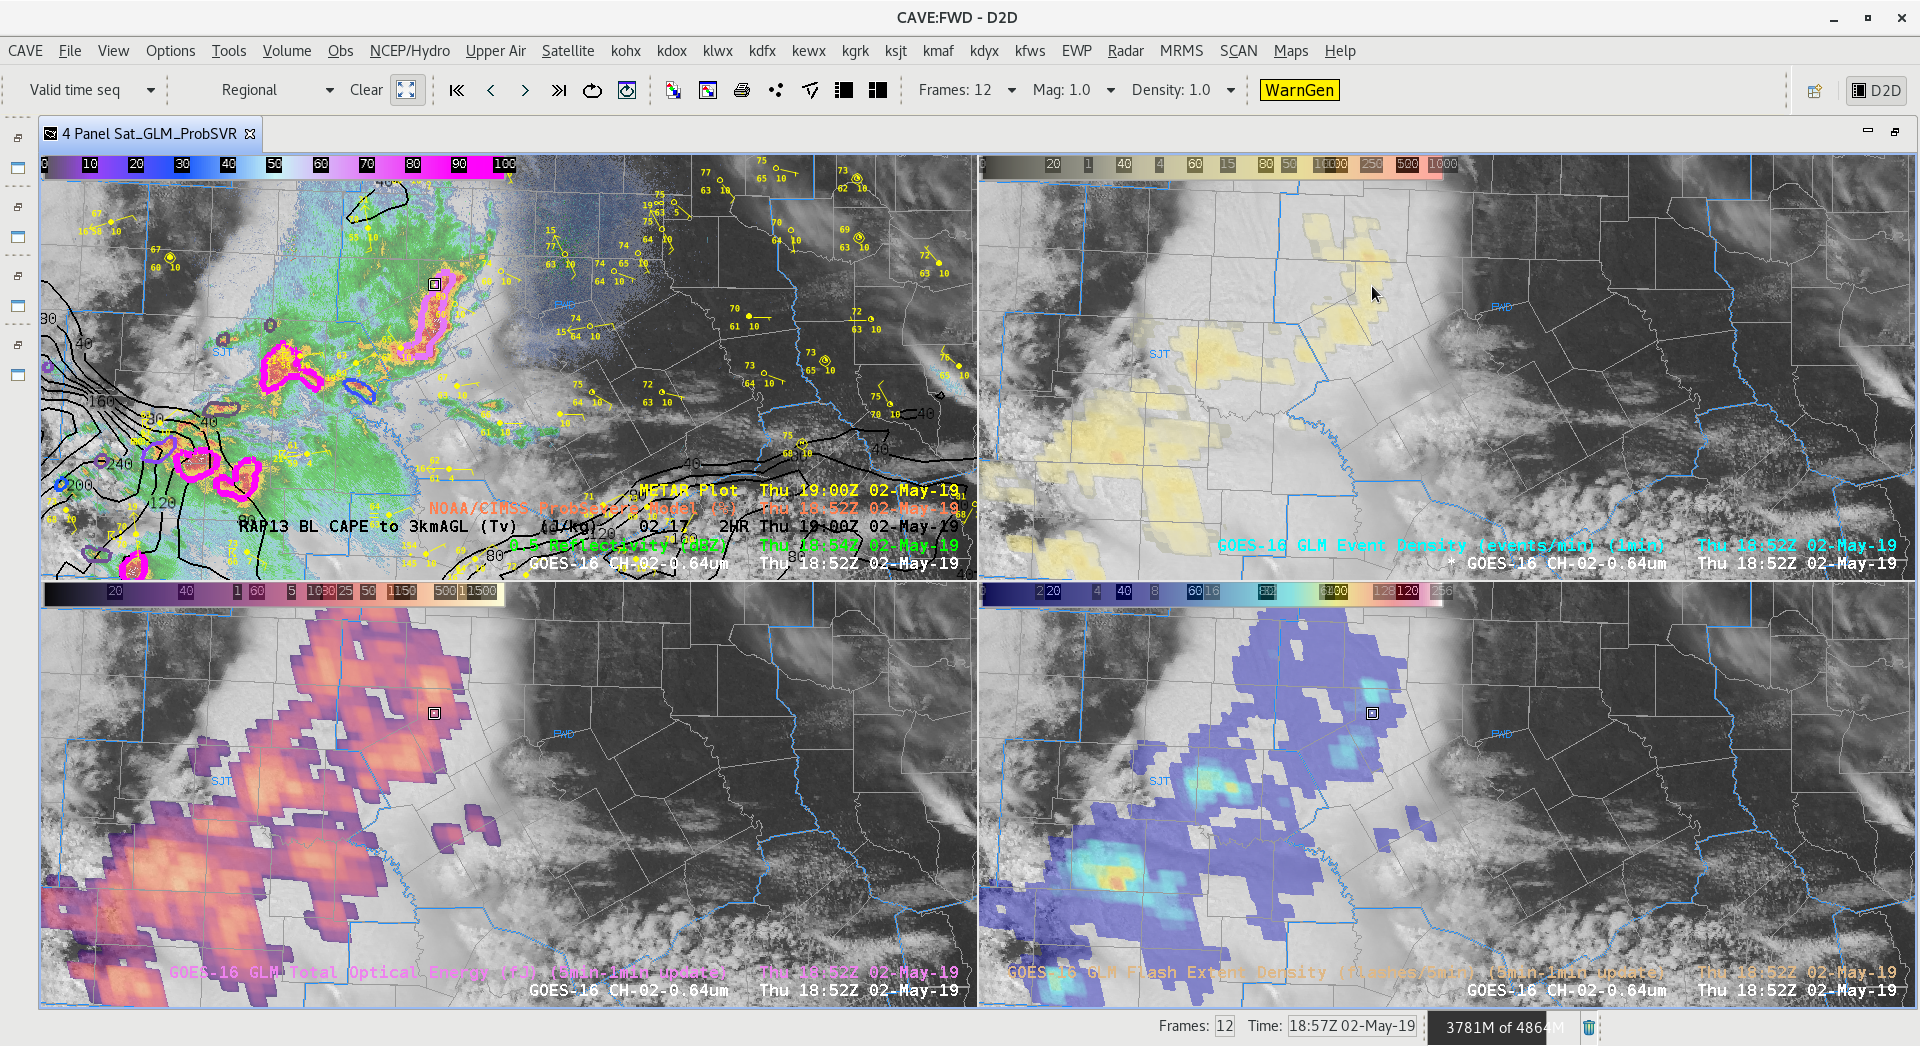
Everything was chugging along great with the GLM and the storms around Amarillo this afternoon as this image from 19:54 shows (TL – Flash Extent Density 5-minute w/ 1-minute update with Vaisala GLD Data overlayed, TR – Minimum Flash Area with ENI Total Lightning overlayed, BL – Total Optical Energy with Vaisala NLDN overlayed, BR – IR/VIS Sandwich):

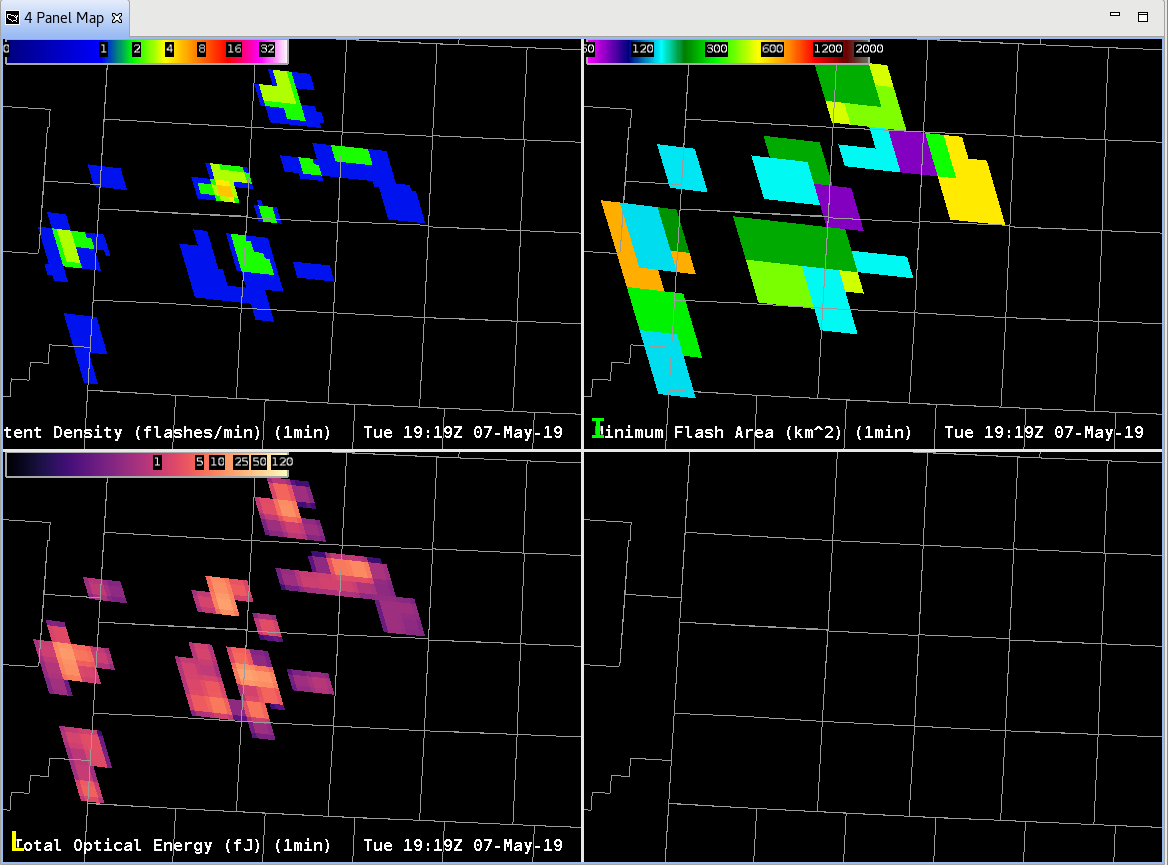
But then the next set of data arrives at 19:55:

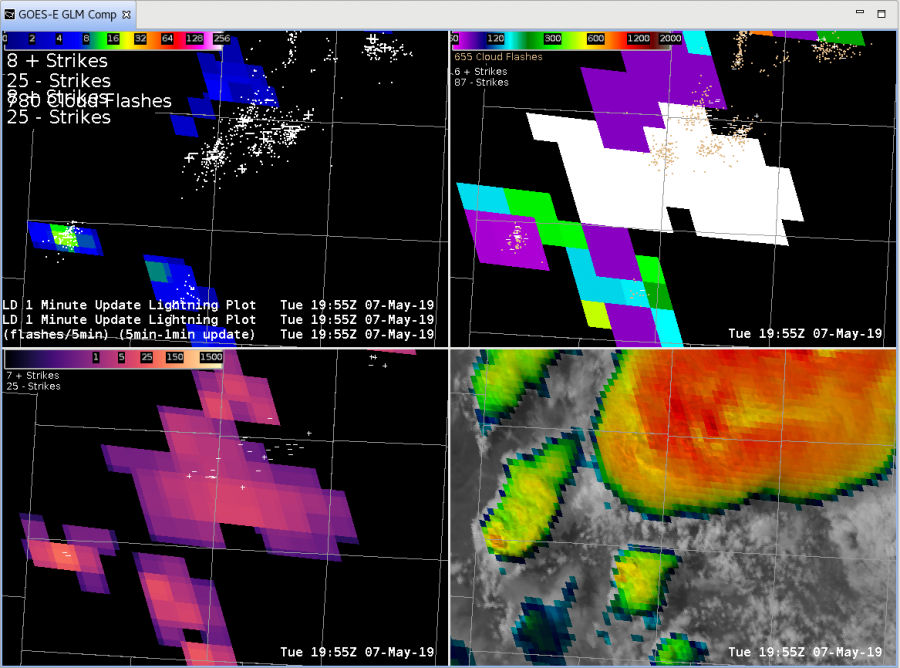
So, that big white area showed up which is a 2918 km2 area flash.  WOW.  THAT. IS. HUGE.  But the question now becomes is that correct or not?  Taking into account parallax and the data from the ground-based networks shows that there was electrical activity in the general area.  However, it isn’t in the area that would line up with the parallax; the ground-based network data should be closer to the southeastern area of the flash.  Also of interest is that there is no Flash Extent Density associated with the large flash but there is an associated area of Total Optical Energy.

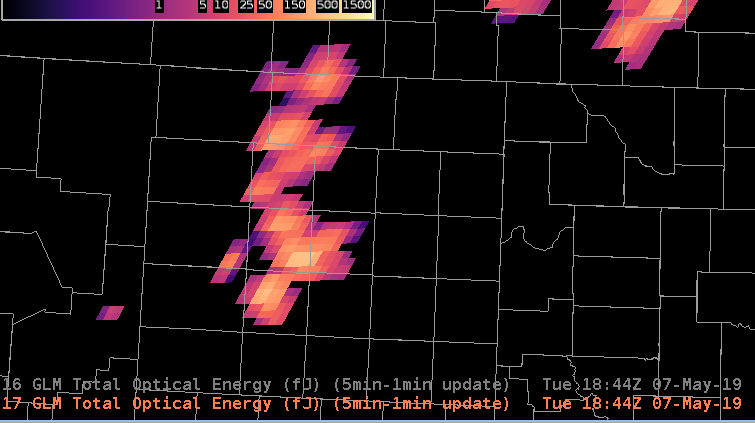
One thing we are tossing around here is the possibility of a cloud reflection; here is the 1-minute visible mesoscale scan with the big flashes overlayed:

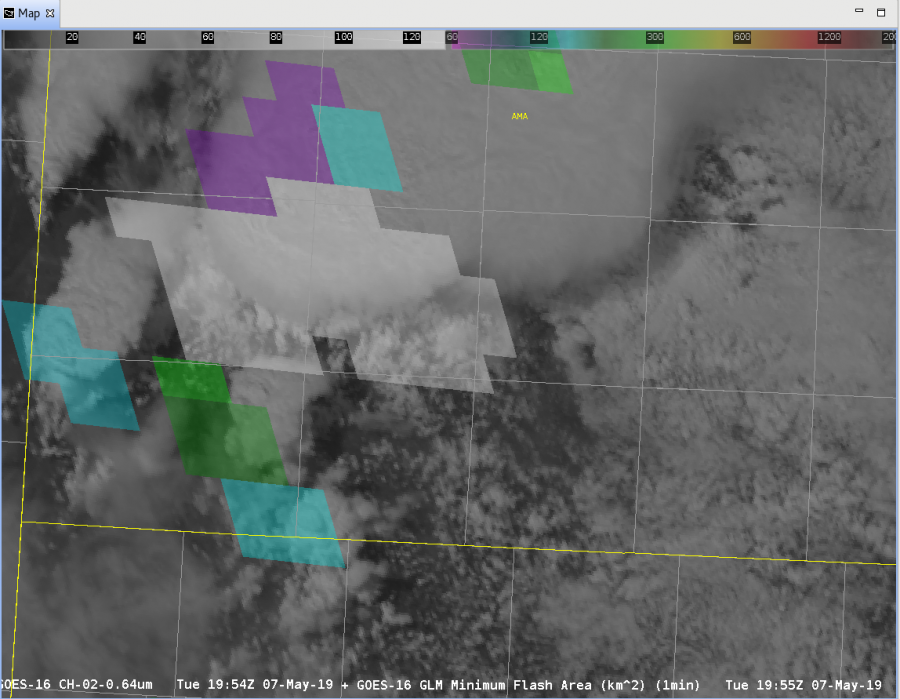
If there was indeed a flash at this time, the optical energy could have reflected from the originating area off the anvil, and then reflected back off the low clouds around the updraft to the GLM instrument.  However, the fact that there isn’t any data associated with this flash in Flash Extent Density is concerning.  Needless to say, the lightning scientists here are all going “Hmmmmmmm….”

-Dusty

GOES 17 May Have Better Angle of TX S Plains Storms

Due to the location of GOES 17 and GOES 16 , forecasters may want to consider the satellite’s angle of view for convection. In this example, GOES 17 has a better “viewing angle” into developing convection across west Texas.  Optical brightness has been brighter than GOES 16 and a better output of Extent Density.

5-Minute with 1-Minute vs. 1-Minute GLM Min Flash Area

So, the first thing looking at today is the best way to display Minimum Flash Area.  This is a nice addition to the Flash Area products and seems to have some utility in displaying the state of convective growth.  As a reminder, smaller flashes are usually indicative of new or strengthening convection while larger flashes are mature/decaying/sustaining stages of convection.  This will come in handy with a lot of convection to see which cores may be the strongest in any given area.

The problem is the best way to view this information; the 5-minute with 1-minute updates seems to have worked well in the past for most of the GLM data but seems to cause some problems with the Minimum Flash Area.  Case in point, here is a 4-panel with the 5-minute/1-minute update from the Texas Panhandle north of Amarillo (TL – Flash Extent Density, TR – Minimum Flash Area, BL – Total Optical Energy, BR – empty; note, non-default color tables on the top row!):

Wow!  That’s a pretty large area of small flashes (purple).  BUT, it’s a total from the last 5-minutes so storms could have moved, strengthened, weakened, dissipated, etc. in that time.  What does the “regular” 1-minute plot look like?

Huh?  Where did all the small flashes go?  Well, the small flashes (purple) in this case are likely where the GLM is seeing the strongest updates in the last minute, not the last 5 minutes.

Something to consider when looking at rapidly developing convection, storms that are moving fast, or storms that are pulsing with rapid time intervals; the 5-min with 1-min update can mask important details when it comes to storm electrification!

-Dusty


AllSky vs GOES Products

One of the limitations of GOES TPW is that it will not display data when there is a significant amount of clouds in the area. AllSky Layer Precip is a great alternative to GOES TPW for areas that are experiencing clouds. The same goes for AllSky CAPE vs GOES CAPE. With a MOD Risk of svr wx today across the TX Panhandle, having the AllSky Data available greatly benefits forecasters today.

GOES GLM products offset

Always important to keep in mind that the locations on all GOES Products are offset based on the tilt of both GOES satellites relative to the CONUS. Good Example of the offset of GLM with ENTLN lightning data displacement shown here.

Would something like this be problematic when calculated into the ProbSevere model?

#ProtectAndDissipate

First All-Sky Experience

Interesting CAPE value drop off

During the first opportunity to sit at AWIPS-II and familiarize myself with the different datasets to be evaluated during the EWP, I noticed an interesting drop off of CAPE values from the All-Sky suite.

Over the course of an hour, the All-Sky CAPE values oddly drop off by about 2/3 betweem 1458Z and 1528Z, only to rise again in the next frame available at 1557Z. While understanding that atmospheric conditions, such as a propagating storm could cause a drop, analysis of the morning doesn’t indicate the presence of such conditions.

All-sky CAPE values over southwestern KS, 6May2019 1458Z
All-Sky CAPE values over southwestern Kansas 6May2019 1528Z
All-Sky CAPE over southwestern Kansas 06May2019 1557Z

A visible satellite loop of the 0.64 micro channel from GOES-16 shows early morning stratus dissipating between approximately 14-16Z. During this time, the stratus burn off is indicative of the boundary layer beginning to mix out with the sunshine and surface plots corroborate with warming temperatures.

As I’m unable to find anything meteorologically that would support the CAPE drop and rise over 60 minutes, it’s a little concerning as a forecaster too see a jump like this the first time using it. I thought this would be good to point out as a first blog post.

-icafunnel

Visible satellite and surface observations over southwestern Kansas 06May2019 1400-1600Z

All-Sky LAP PW vs. Merged TPW

There has been considerable examination of the All-Sky LAP products (PW and CAPE) this week, and for good reason – they’re quite good. I wanted to take a quick look at how the All-Sky LAP total PW compared with the merged TPW product. The All-Sky product is on the left and TPW on the right. I overlaid the 20z 1 hour RAP PW forecast for comparison. Ignoring the higher resolution of the All-Sky, the very broad distribution of enhanced and depressed values are similar in location between the two products. However, the TPW values are considerably lower than both the All-Sky and the RAP forecast. Further, pulling the 21z SPC mesoanalysis PW shows that the All-Sky tends to be the better of the two satellite products.

The TPW seems good for very broad generalizations, but if given a choice between the two in operations, I’ll take the All-Sky, All-Day Every-Day.


–Stanley Cupp

GLM comparison for Line of thunderstorms

A linear storm was moving east across western FWS CWA producing 1″ size hail.  Look at the cursor location, GLM Flash Extent Density and Event Density products were highlighting the most intense part of the storm better the GLM TOE product.  The GLM Total Optical Energy is preferred for initial storm development.  When thunderstorms become mature its best to use the GLM Flash Extent Density or GLM Event Density product to compare storms in the mature phase.  -Jake Johnson

Spectacular 1 min GOES satellite imagery of a Colorado supercell

Using feature following zoom to stationary view track a supercell  in ECO. Many things visible here, including uplift and twisting of stratus deck in the inflow region, anvil plume texture, and updraft texture. The parallax error ends up helping the user get more info about the vertical structure and composition of the storm – contrary to the often requested need for ‘parallax corrected’ imagery.

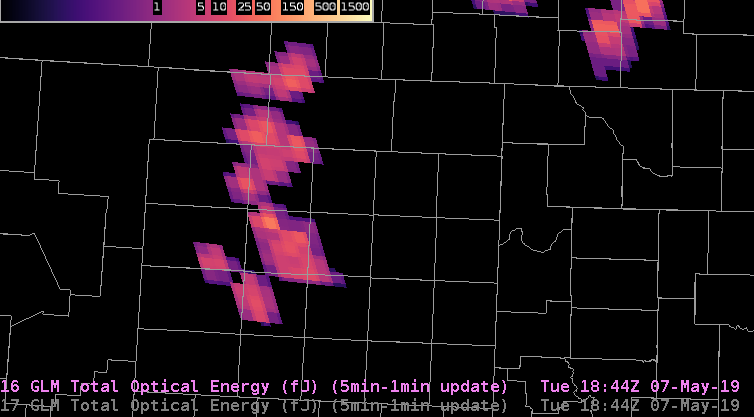
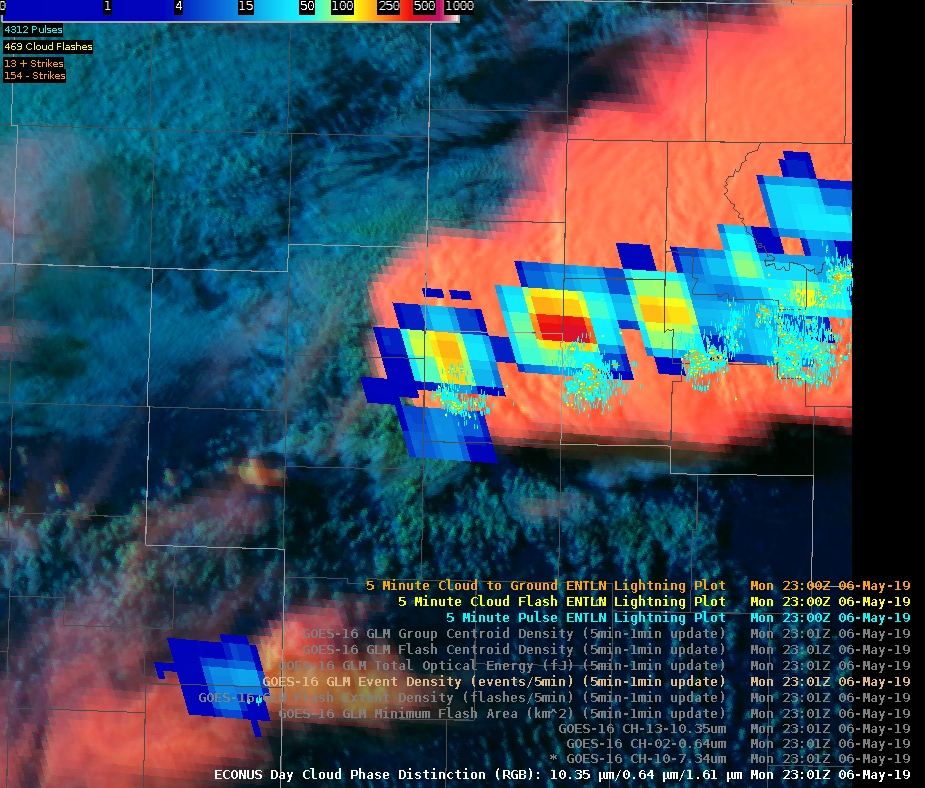
Day cloud phase 1 min of the same storm. Does not get much better than this!

-Dusty Davis