Good non-severe storm with agreement from radar/satellite products

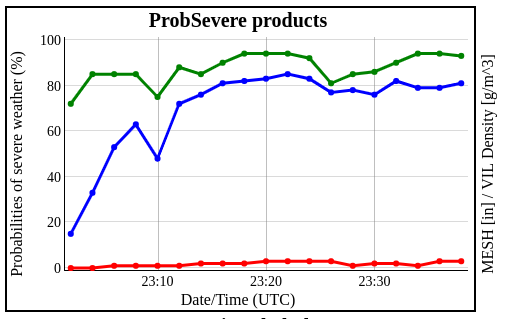
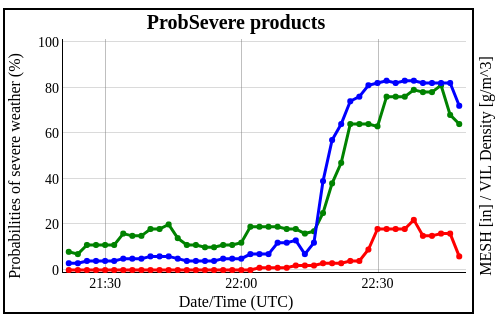
One storm became near severe around 545 pm in EWX CWA. All parameters; lightning, ProbSevere and Dual-pol radar agreed on the evolution of the storm and expected impacts. Radar data suggested there to be equal wind and hail threat based on high ZDR and KDP within the core suggesting sub-severe hail. There was some notching in the back side of the storm’s reflectivity as the front end of the storm surged eastward suggesting some wind threat. Lightning over this time had increase from 10 fl/min to 20 fl/min about 15-20 minutes prior to the development of some weak mid level rotation. As the storm cycled and weakened, so did the lightning and ProbSevere values. An uptick in GLM event density was followed by a slight increase in ProbSevere values toward the end of the loop.

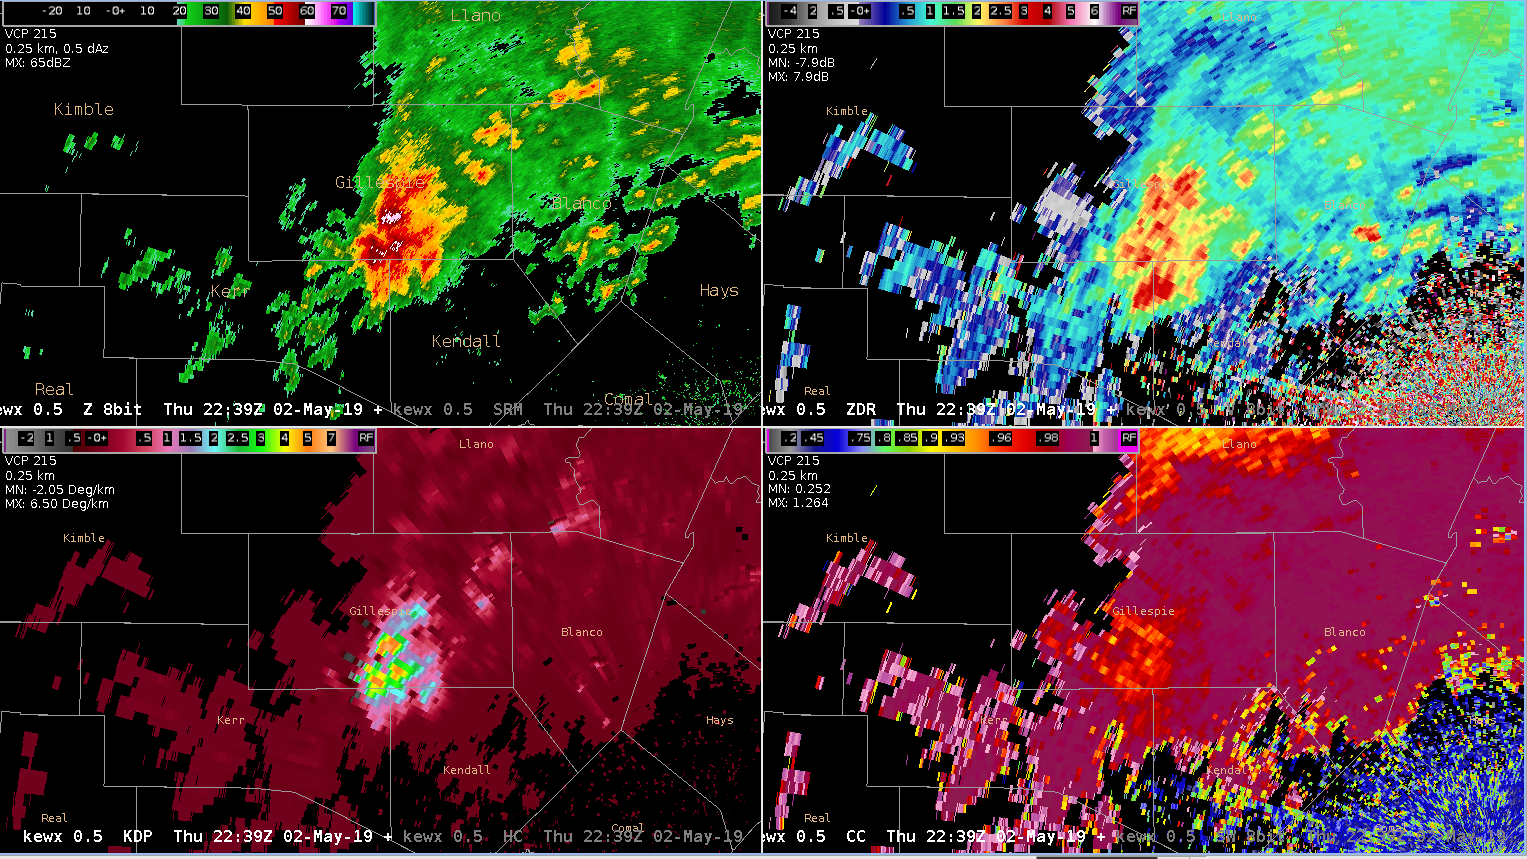
KEWX 4-panel – Refl (UL), ZDR (UR), KDP (LL), CC (LR)

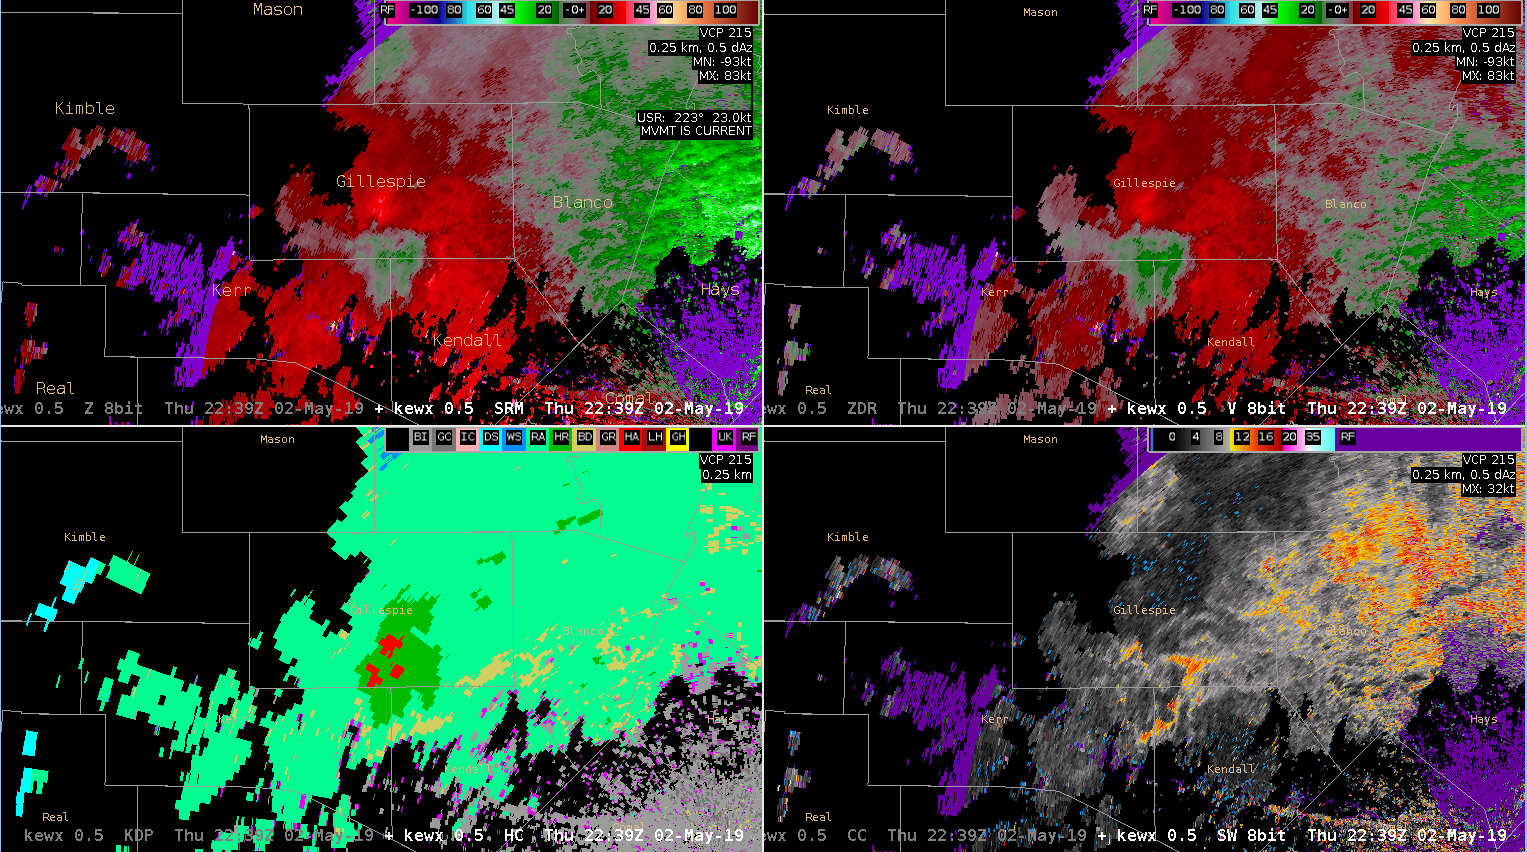
KEWX 4-panel – SRM (UL), V (UR), HC (LL), SW (LR)

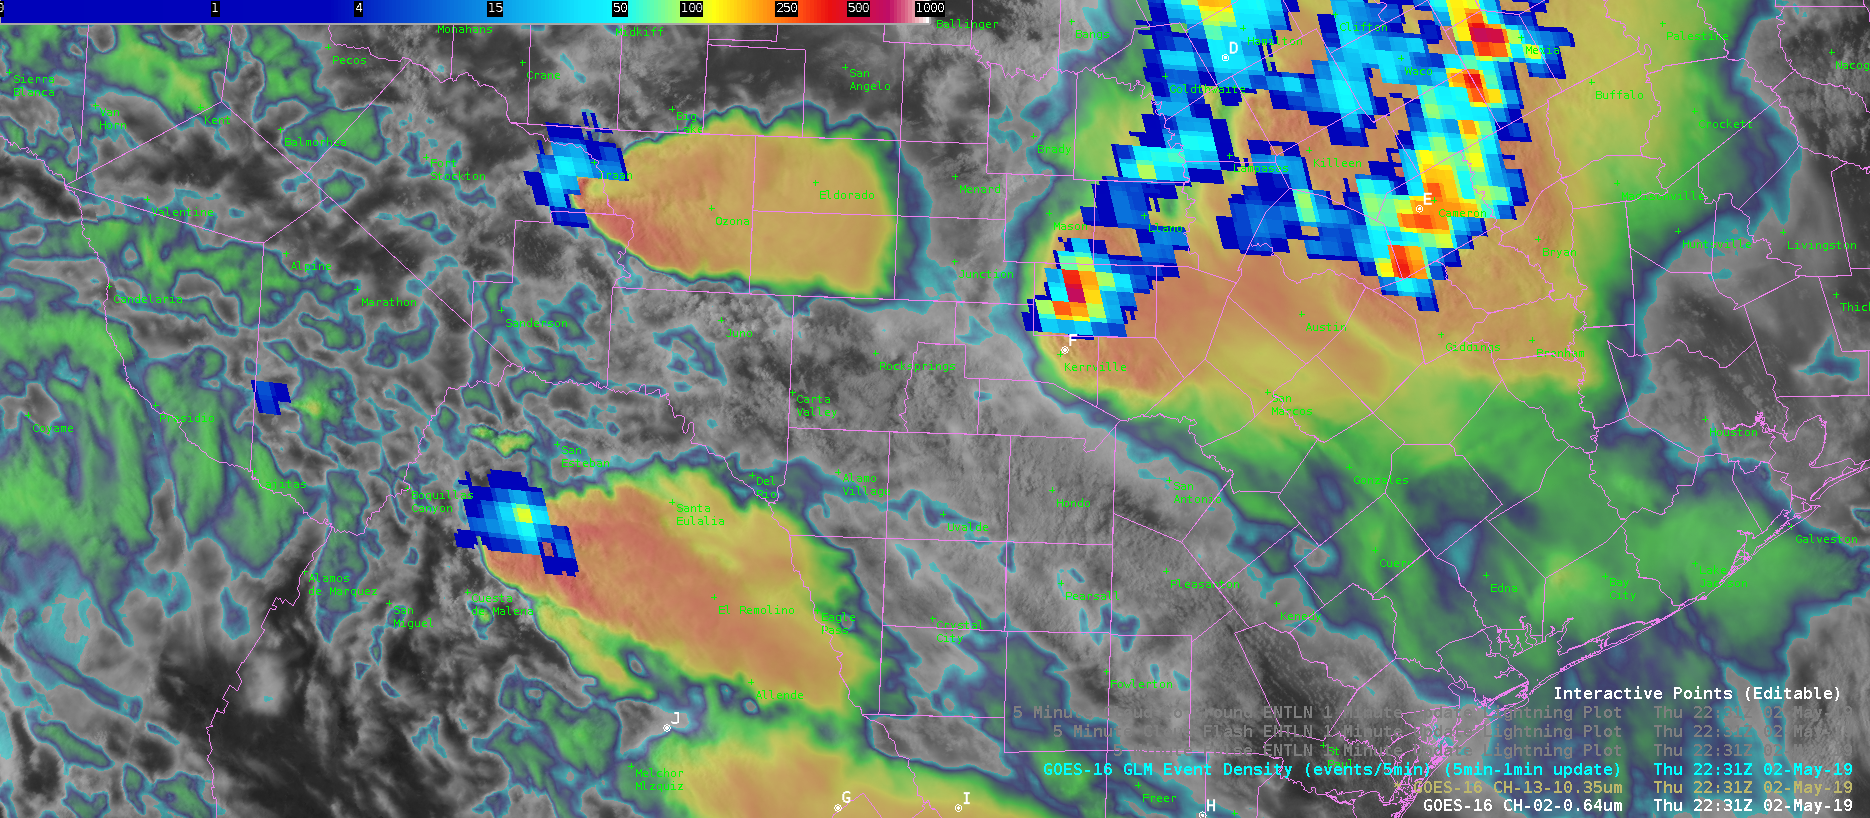
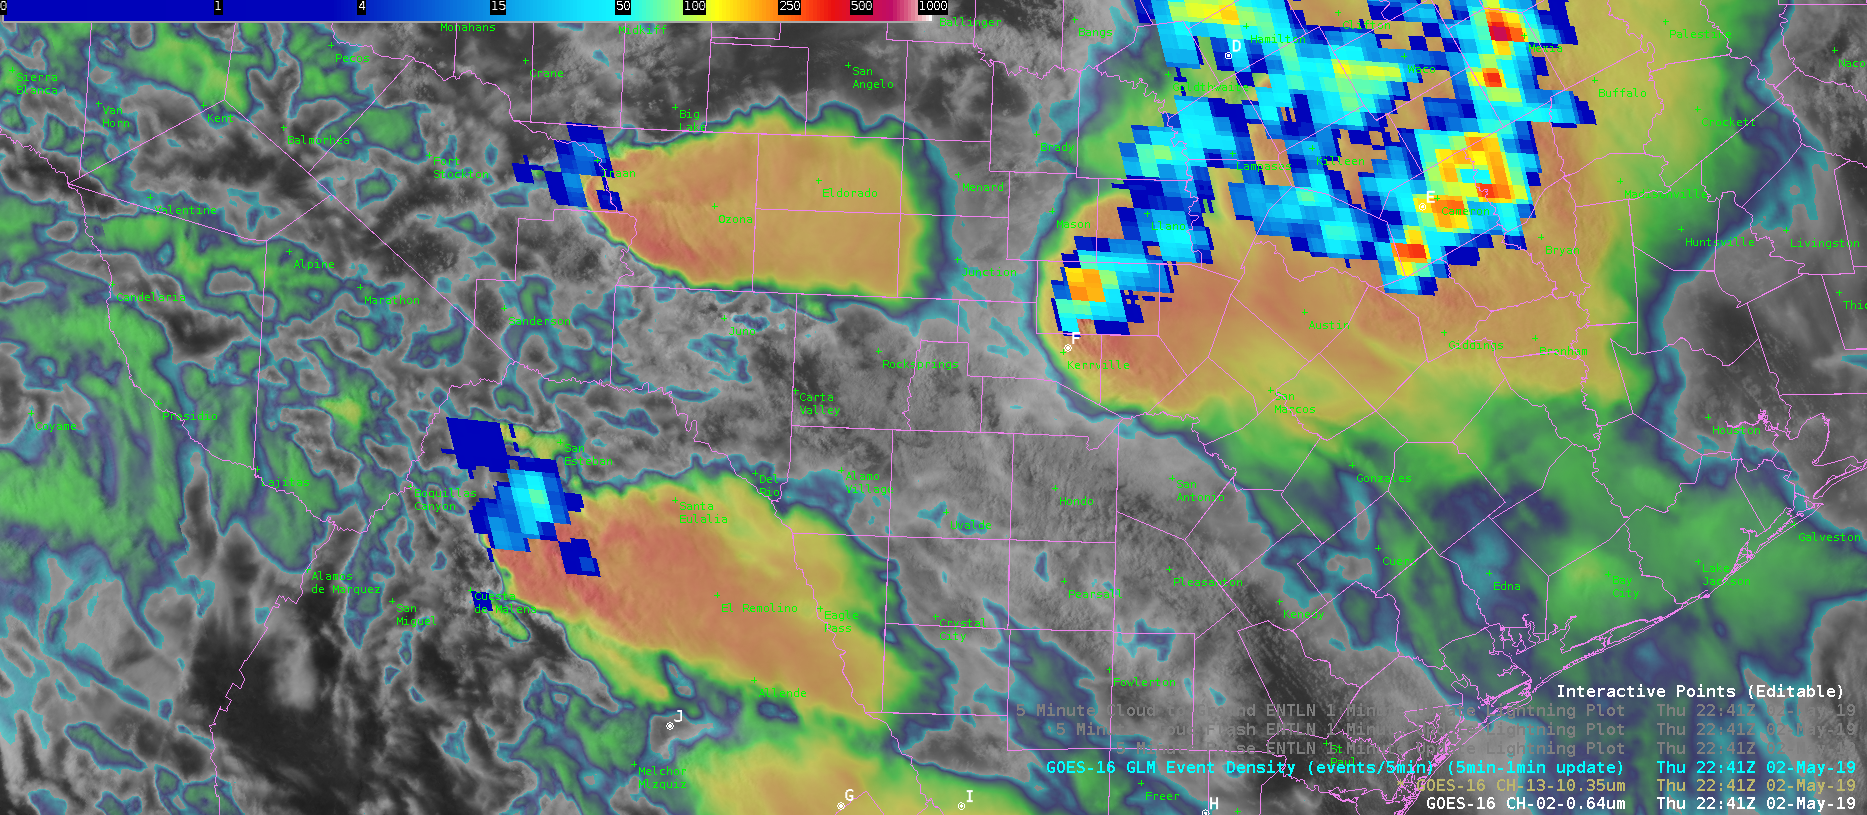
GLM sequence of Gillespie County storm – 1-min(FED)(UL),AFA(UR),TOE(LL),EventDensity(LR)

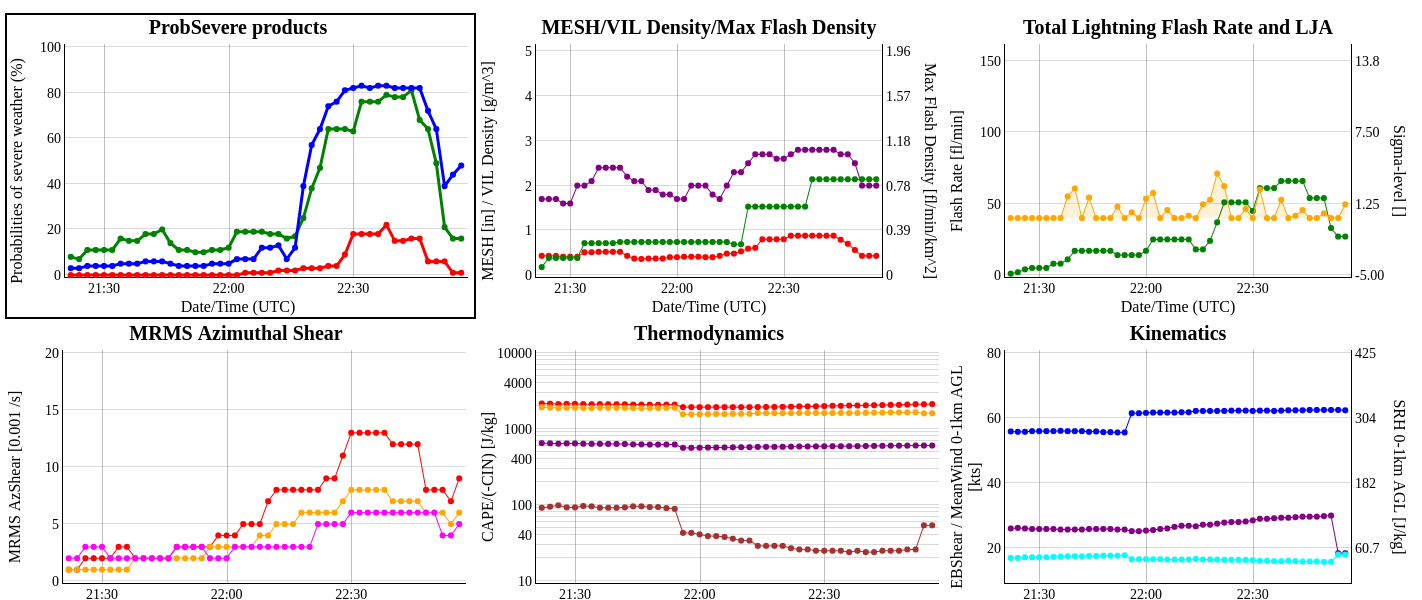
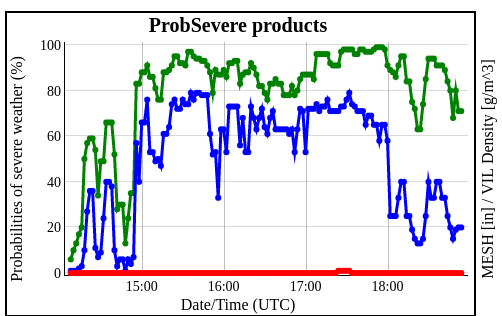
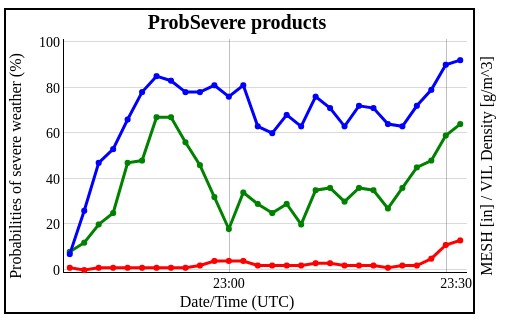
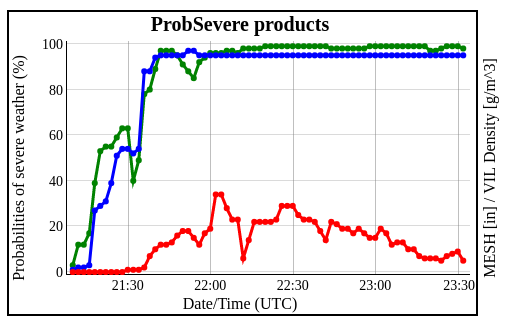
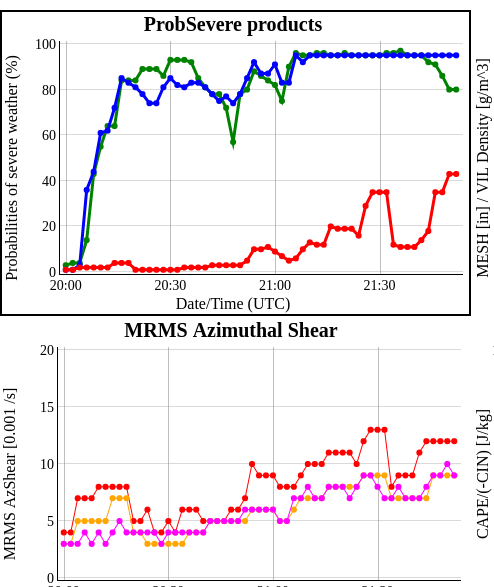
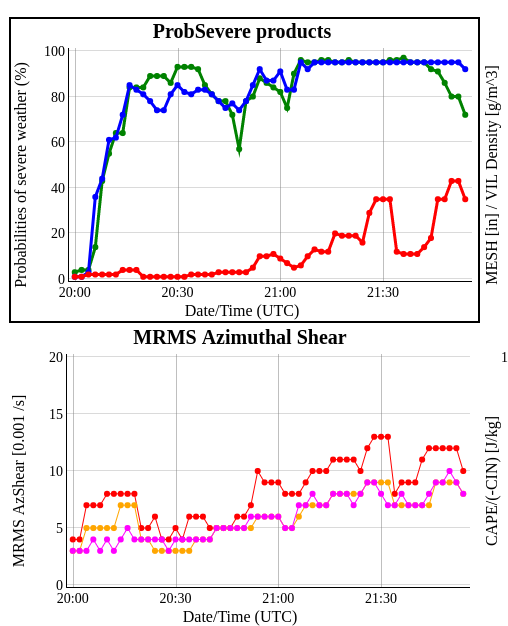
ProbSevere time trends from http://cimss.ssec.wisc.edu/severe_conv/plots/PSplots.php?ID=176047

— SCoulomb

Lightning Event Density As A Proxy For Storm Intensity

Lightning Event Density was mirroring the storm near point F for a fair amount of time. Notice how the prob severe graph almost directly correlates to the product. When Flash Event Density decreased, the Prob Severe decreased as well. Greater Flash Event Density seems to correlate to storm intensity.

Lightning Event Density Before Storm Weakens (Point F)
Lightning Event Density After Storm Weakens (Point F)
Trend-line for the storm…notice the drop-off that occurs when the flash event density decreases.

South Beach

ProbSevere Trendmap for a splitting supercell

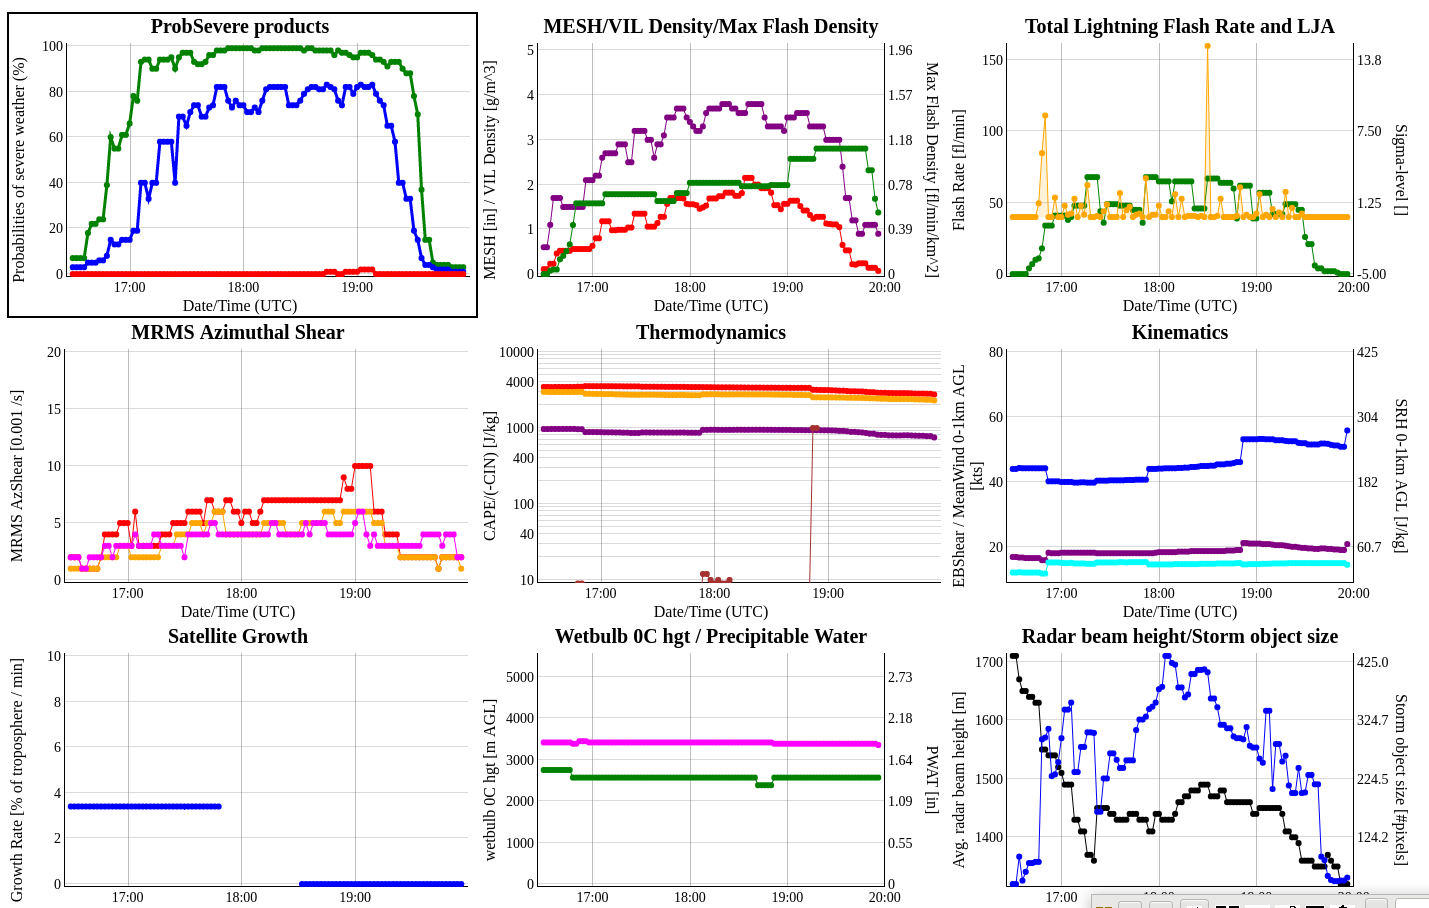
Graph of probsevere for splitting supercell discussed in earlier blog entries. These graphs are extremely useful to forecasters looking for trend analysis.

Possibly even more important could be their use in post-event analysis. For example, plotting lines on these graphs when LSRs came in, when tornadoes occurred, can give forecasters an idea of what the trends were showing in MRMS at the time of the impacts. The RealEarth viewer appears to allow you to view these graphs from object IDs back about 24 hours, however only the object ID shapefiles are available before that in time. It would be very useful for forecasters to have access to these time series plots for post event analysis – perhaps consider making them available for any object IDs up to a week old?

-Dusty

Prob wind – two cases with unexpected results.

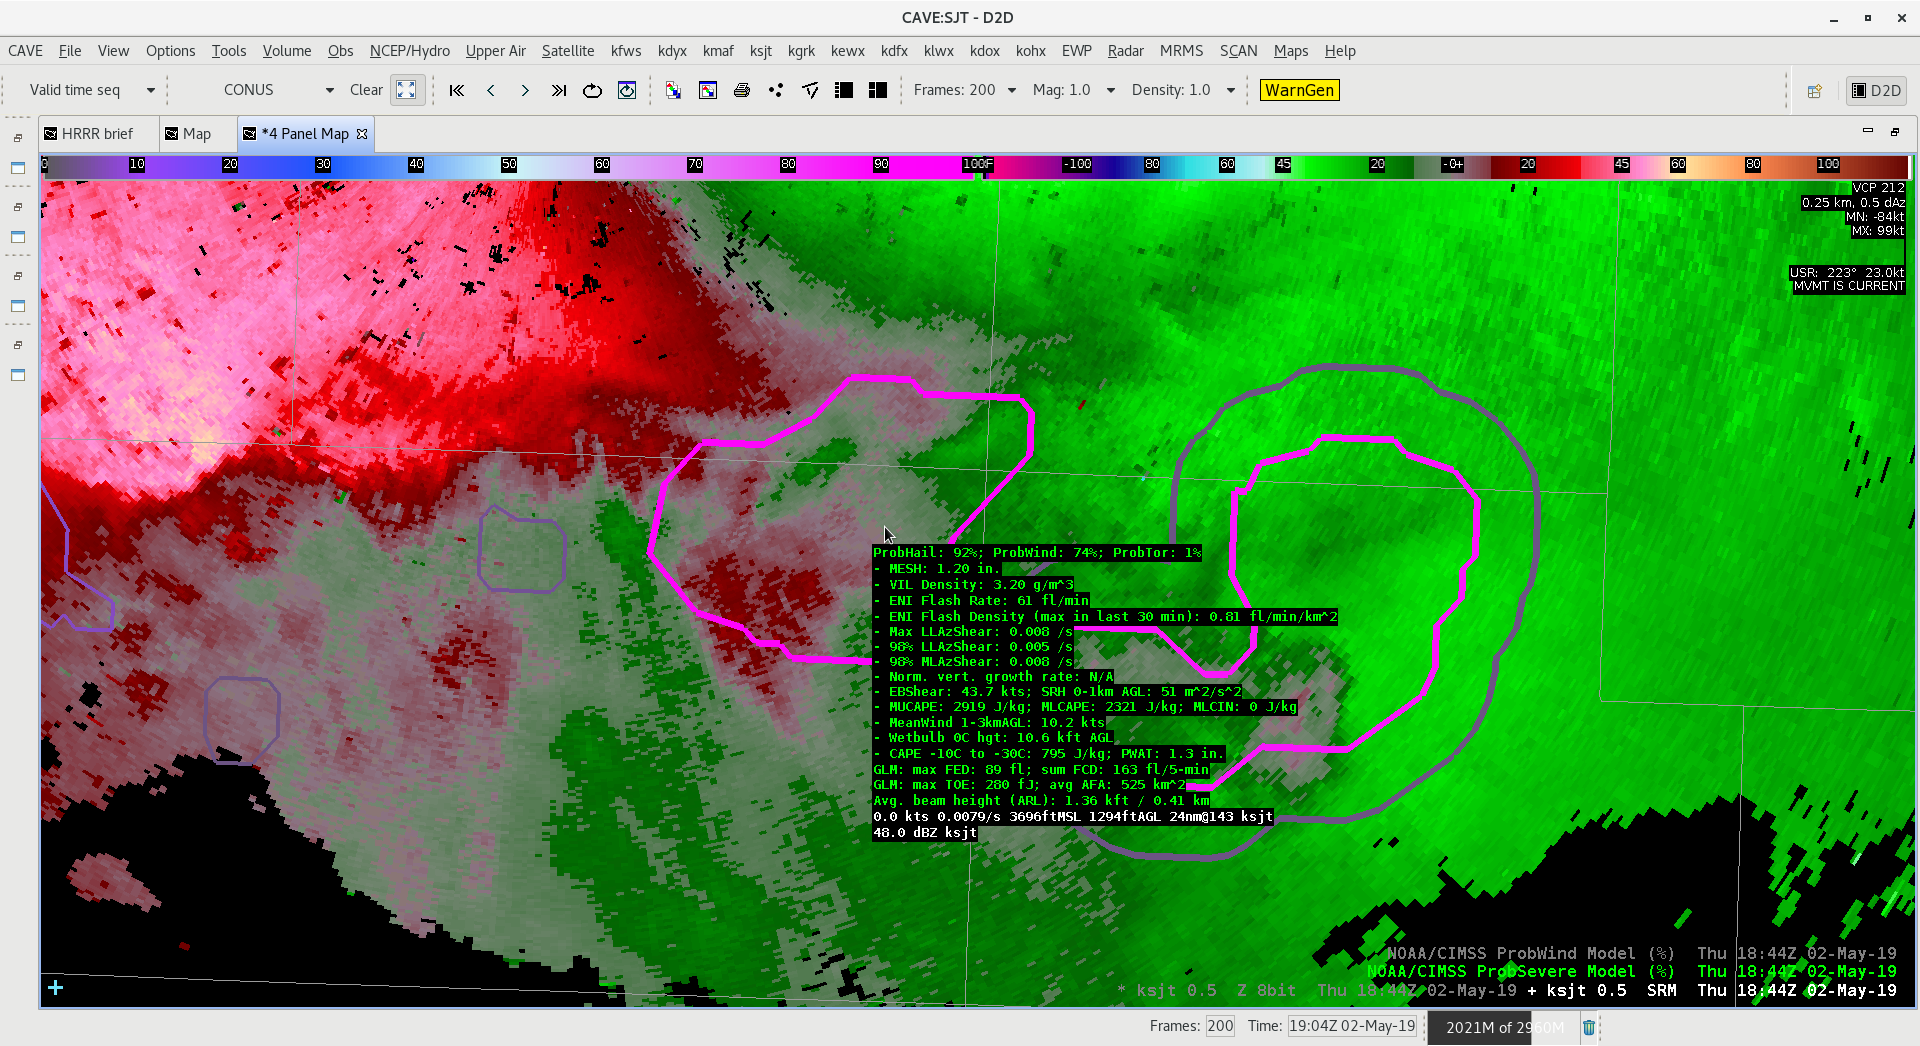
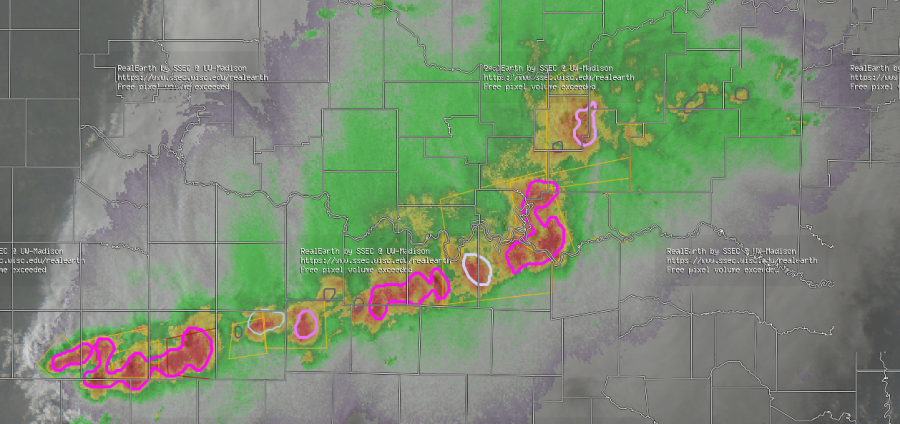
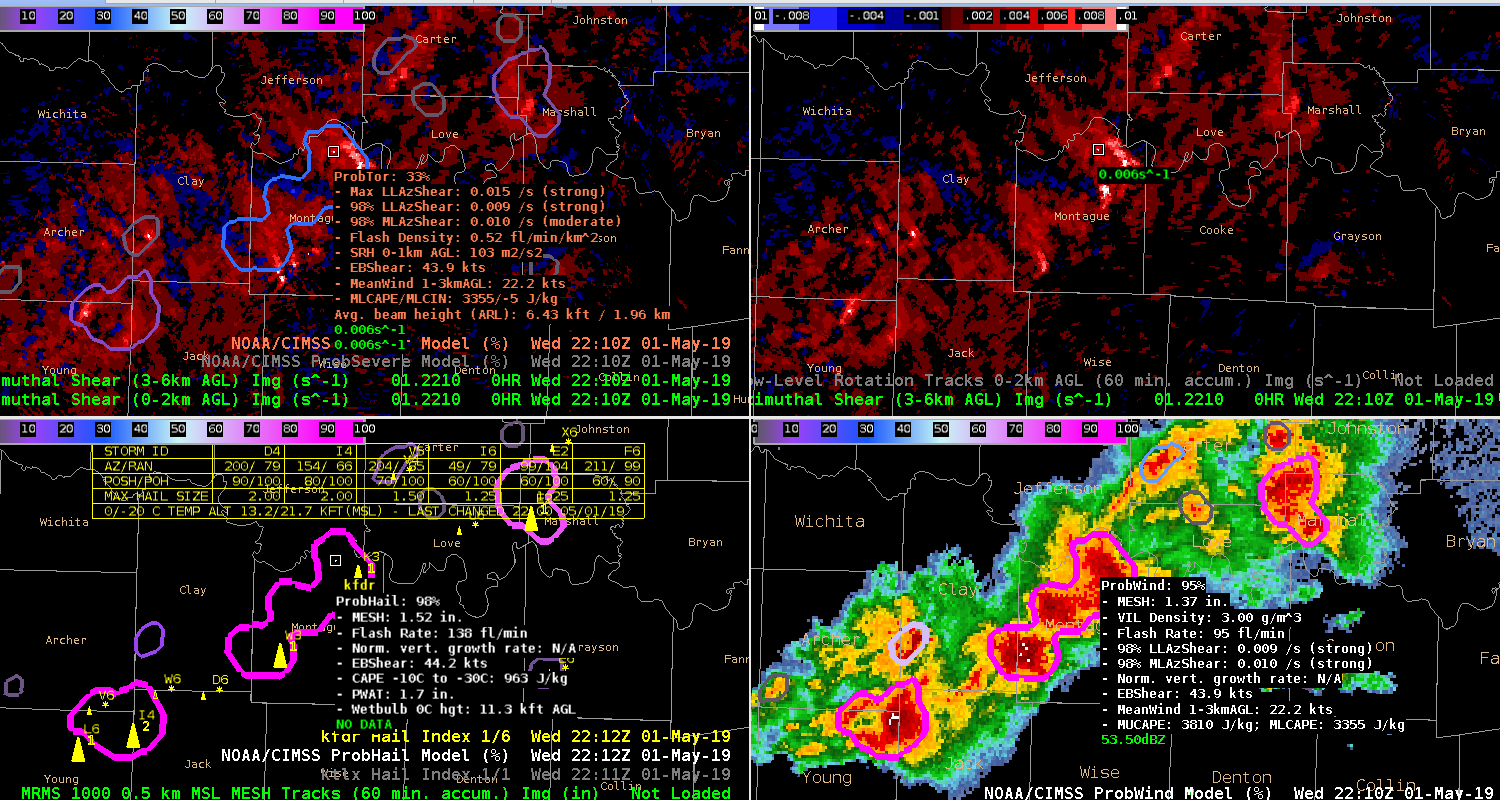
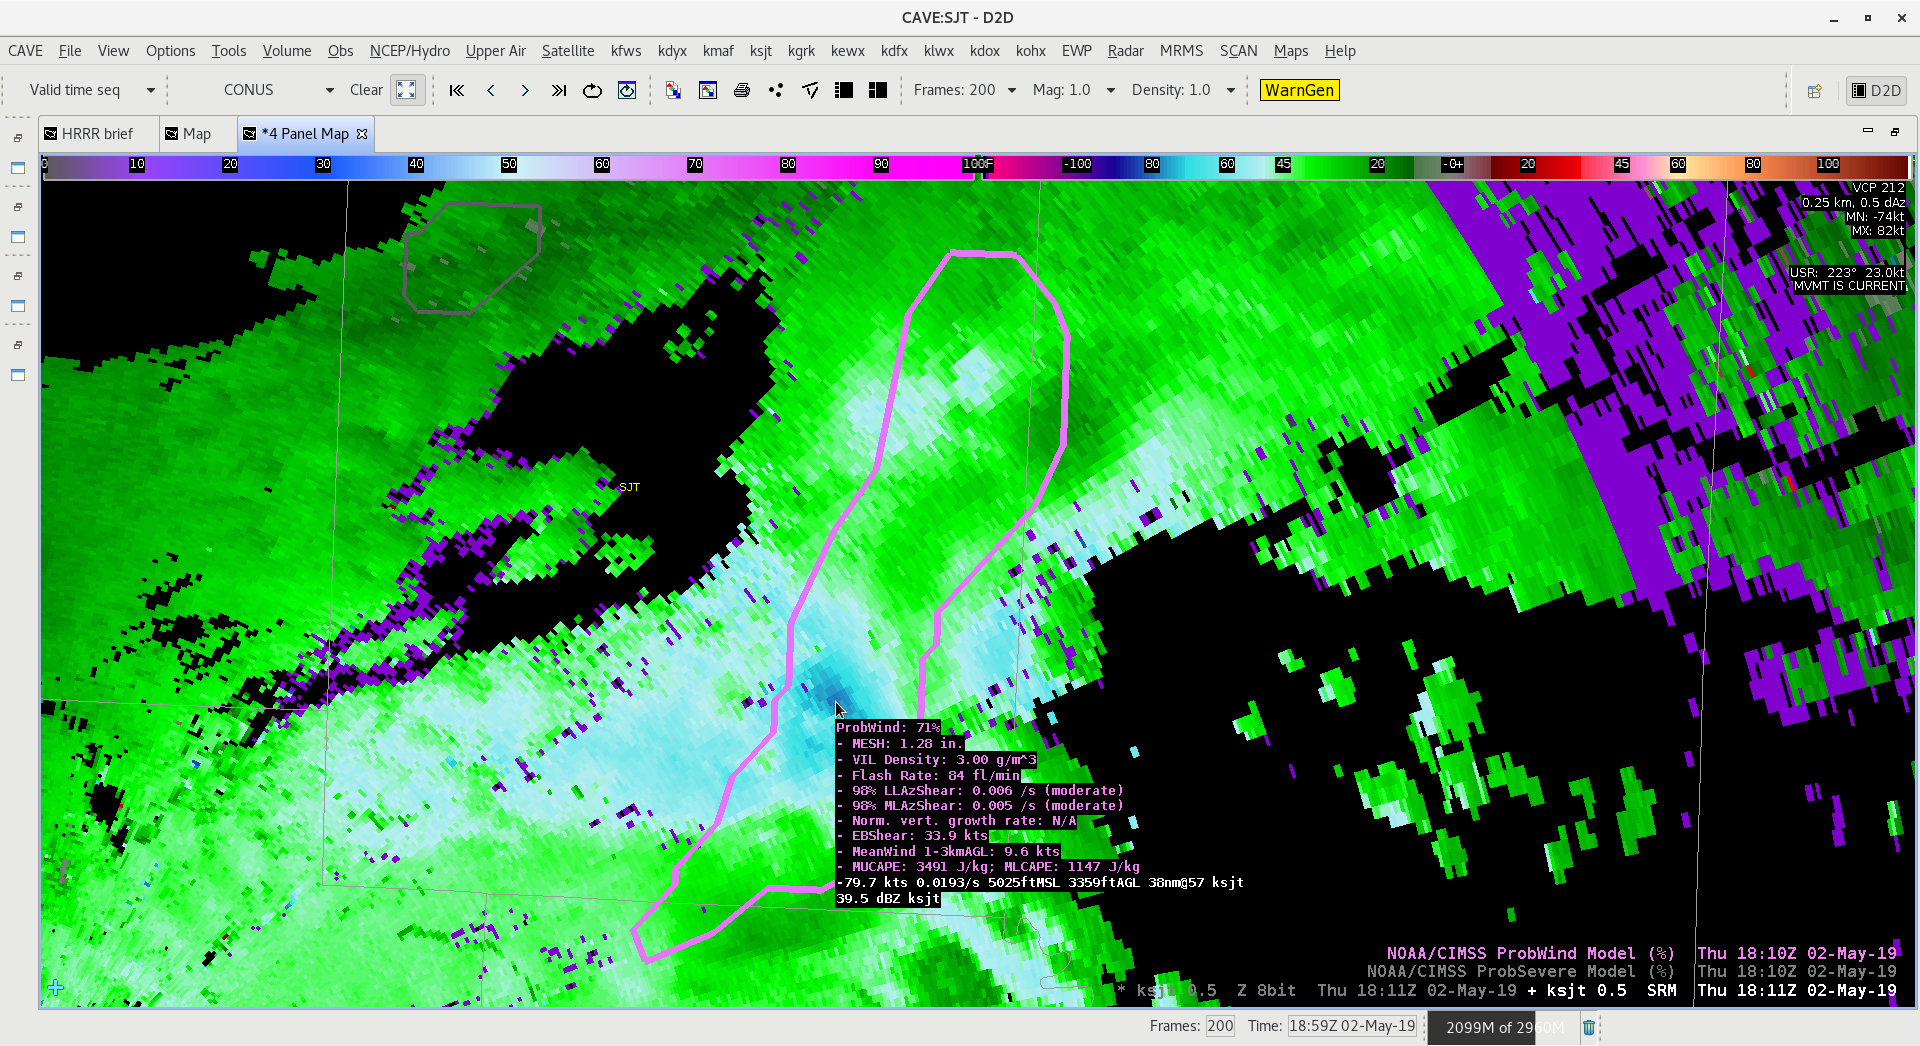
Here are two cases where ProbWind produced surprising results. In the case above, a very strong wind signature descended from a linear storm segment. BV data near 80 knots in the lower 3 scans, however ProbWind was only at 71%. I would have likely issued a warning here without ProbWind, however the ProbWind data made me question mid-level winds within the thunderstorm complex.

In this case, a storm well behind the main outflow is identified. Prob wind is slightly higher here, at 74%, however the storm had no signs of imminent high wind in any of the lower tilt data. This case may have been a result of stronger mid level winds aloft affecting the prob output.


-Dusty Davis

ProbSevere – Transition from hail to wind threat

ProbSevere seemed to have a pretty good handle on the dominant severe threat  as initially discrete storms early in the day,  began to congeal and grow upscale into the early evening north of the Red River. This can be shown in same sample graphics below.     The first two trend graphics are from storm objects over the northern, maturing portion of the MCS, generally north of the Red River where mainly wind damage reports were observed (and some small hail).  The second two trend graphics are from somewhat newer storms that were developing southwestward into northern Texas where primarily hail (and wind) were observed.  – Quik Twip

High ProbWind values with severe reports!!

The storm cluster across N TX began to gust out late in the afternoon. Line motion was ~43kt as the storms surged across Montague county just south of the Red River. There was a report of wind damage in Texas (power poles blown down) and in Oklahoma (estimated 60-70 mph winds) associated with the storm cluster.  ProbWind was as high as it has been the past couple of days in the 92-95% range during this time. Of note, the Flash Rate was very high with the identified object, at times nearing 150 fl/min and the AzShear was ‘strong’. This combined with the environmental parameters helped increase the wind probs throughout the life of this cluster as it moved ENE. ProbWind was equally high with other objects to the northeast and southwest of the featured storms yet no wind reports were received from them. Interestingly though, ProbTor was ~30% with the Montague county object at this time helping draw attention to it.

Low Level AzShear (UL), Mid Level AzShear (UR), ProbHail (LL), ProbWind (LR)

More investigation of the MDA algorithms

Investigating the MDA algorithms, it continues to seem as though the NMDA (shown in light blue) continues to do a better job at identifying mesocyclones compared with the “normal” algorithm. Its performance may be comparable with the DMD (yellow).

Overlay of all 3 MDA algorithms.

South Beach

ProbTor not showing much “Love” for Tornadic Supercell in Love Co OK


ProbTor showed a noticeable increase in values as the circulation on the Love County storm improved from 21:24-21:28 however there was a significant drop off at 21:34 even though the circulation from KFDR maintained its intensity and actually improved gate-to-gate. Looking at the MRMS AzShear graph you can see the same trends pinpointing the main driver in the ProbTor behavior. By 21:44 the AzShear recovered and ProbTor also returned to its previous value and continued to climb. There was some apparent “funky data” that got into AzShear to cause the unexpected drop. This emphasizes the need to have the proper products paired in AWIPS displays in order to diagnose why some algorithms may “fail” at times.

ProbSevere Time series. (http://cimss.ssec.wisc.edu/severe_conv/plots/PSplots.php?ID=166605)

Low Level AzShear (UL), Mid Level AzShear (UR), New Mesocyclone Detection Algorithm (KFDR) (LL), Low Level Rotation Tracks (LR) 21:20-22:14

KFDR 0.5 deg SRM 21:03-22:13.

Multi-radar comparison of Tornadic Storm near Red River

KTLX, KFWS and KFDR perspectives of tornadic supercell near the Red River.  Spotters indicated occasional brief touchdowns with this storm.  Animation is from 2050 to 2143 UTC around the time of the reported brief touchdowns.  Last image is the time trend of ProbTor  (red trace) and MRMS AzShshear (red trace).  KFDR seemed to sample the mesocyclone the best and subsequent gate-gate-shear (90 nm from RDA).  ProbTor indicated a gradual increase then took a sudden drop shortly after 2130 UTC, then continued to increase.  This may have been the result of a similar drop in the MRMS AzSHear.  Not clear why AzShear dropped off briefly (perhaps a sampling issue with one of the radars). However, radar SRM data did not show any indication of weakening circulation in any of the, in fact the velocity couplet was even stronger around 2130 UTC especially KFDR radar.  A caution to forecasters to be careful when examining trends in the ProbTor and be sure to examine the various inputs into ProbTor in conjunction with the radar (velocity trends). – Quik Twip