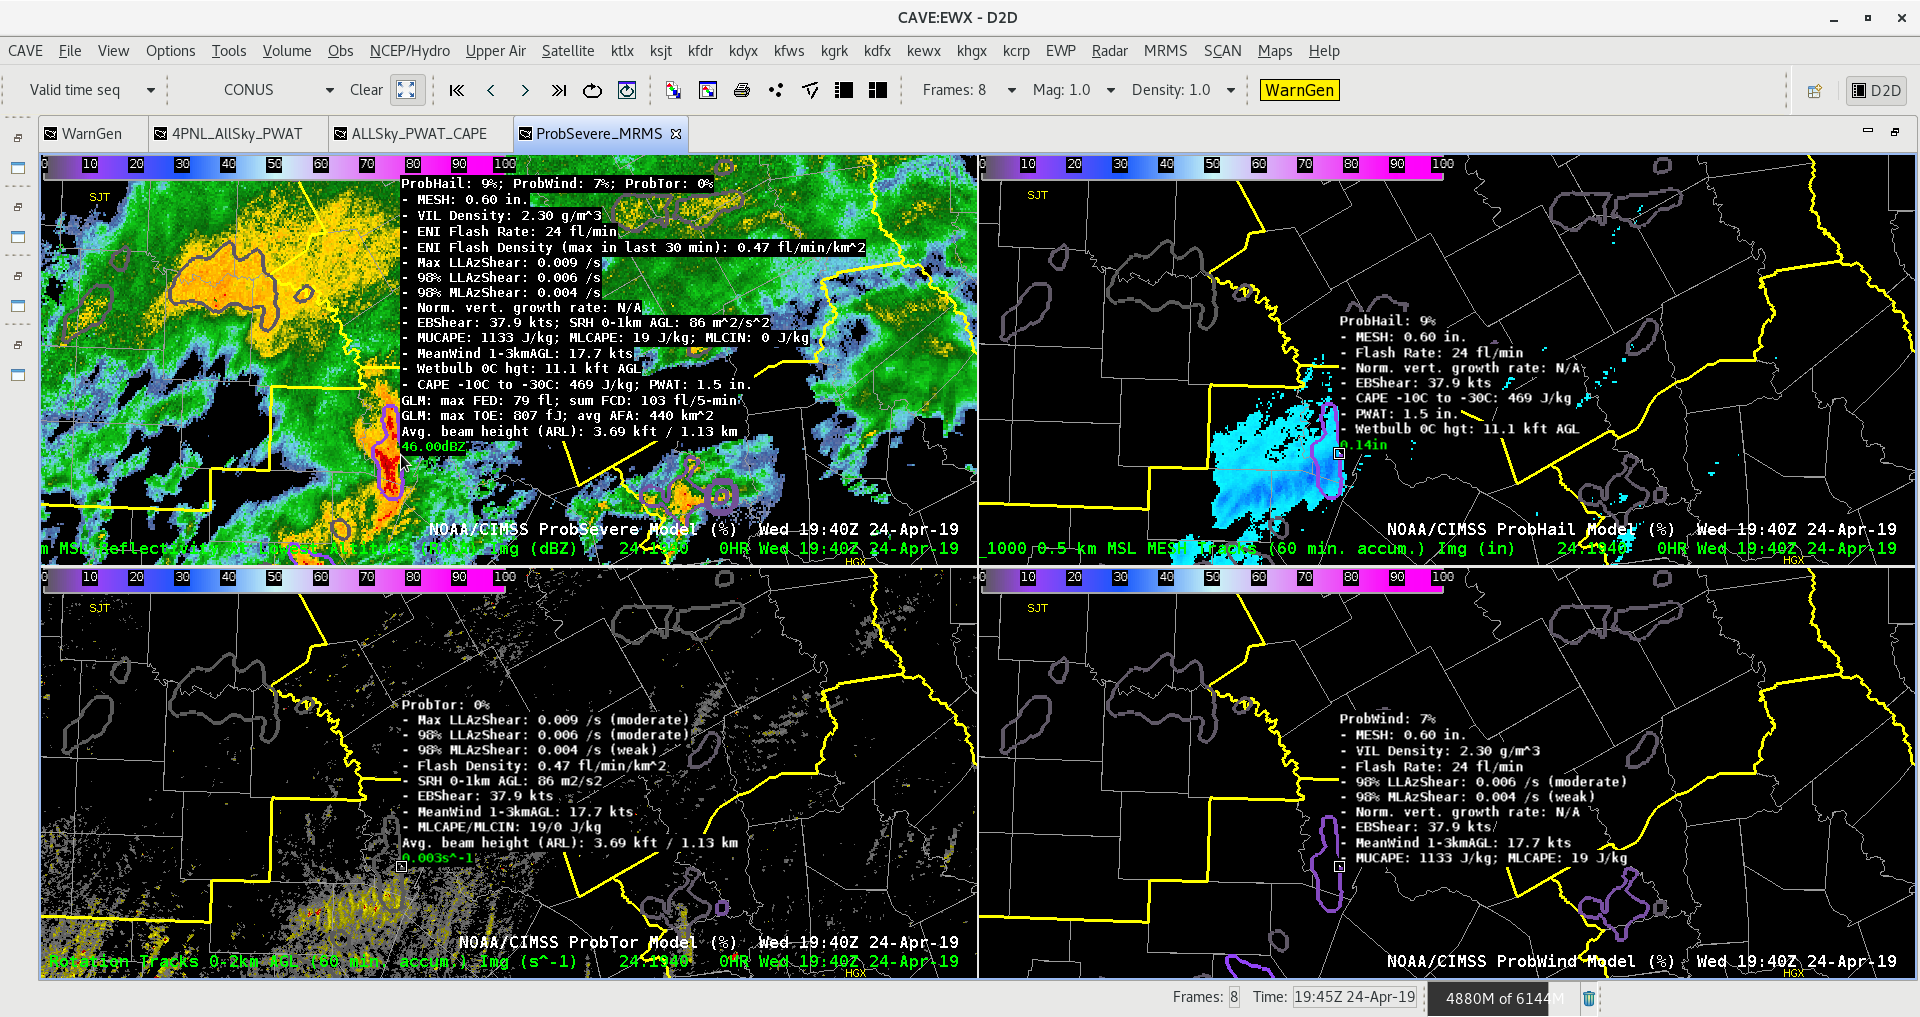
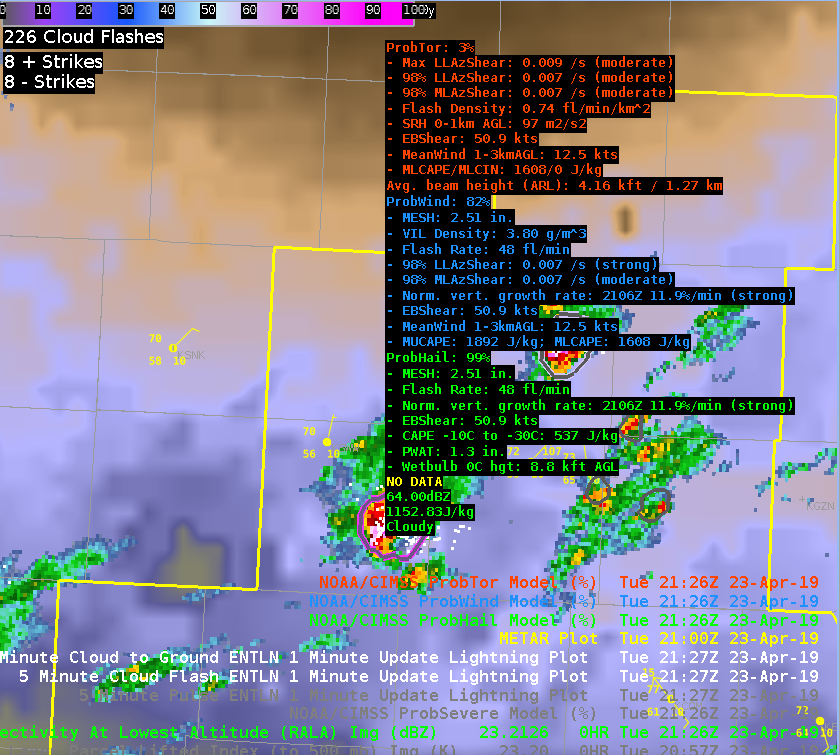
One of our primary goals today was to examine the relationship between the ProbSevere model and the lightning jump detection algorithm. A strong storm fired on the front range of the Rockies, just west of Denver. The ProbSevere model noted strong satellite growth rates in a moderately-sheared environment, with MESH only 0.17″. The probability of severe was 33% at 1920 UTC. At this time the PGLM indicated a flash rate on the order of 6 flashes per minute. Two minutes later, at 19:22 UTC, the ProbSevere was 46%, as MESH increased to 0.33″, and the total flash rate at 8 flashes per minute per pixel. Over the next 4 minutes, two consecutive lightning jumps were indicated in excess of 2 sigma as the total flash rate rose from 8 to 20 flashes/min/pixel (2 sigma jump at 1922 UTC, 4 sigma jump at 1924 UTC). ProbSevere increased to 66% at 19:24, and 77% at 19:26 (MESH = 0.71″). This storm intensity information highlighted the rapidly developing updraft within the storm; signalling the potential for severe weather was increasing as the first storm in the area approached the Denver Metro Area.The NWS issued a severe thunderstorm warning at 19:36 UTC. The jump in ProbSevere (46% to 66% from 19:22 to 19:24 UTC) and the 2-sigma and 4-sigma jumps from the LJA (at 19:23 and 19:24 UTC, respectively) may be able to give forecasters enhanced confidence and perhaps more lead time to initial rapid development in the storm, and potential severe hazards. Animated GIFs for Flash Extent Density (top), Lightning Jump Detection Algorithm (middle), and ProbSevere (bottom) from 1920 UTC to 1930 UTC can be seen below.
Additional lightning jumps were noted at 1943 UTC (3 sigma) followed by multiple 2 sigma jumps at 2000 UTC, 2001 UTC, and 2004 UTC, and another 3 sigma jump at 2005 UTC. These additional jumps were additional signals that the updraft in the storm was re-intensifying and continued to have the potential to produce severe weather. Thus any warning that was issued should remain in effect. During this time period, ProbSevere remained at or above 98%. The first tornado report associated with this storm was at 2005 UTC and hail to the size of golf balls were reported in the Denver Metro. Also hail depth of at least 5 inches was reported at Denver International.
In this case, ProbSevere and LJDA both displayed the rapid intensification of the updraft, and could be especially useful in identifying the first severe storm of the day, and the maintenance of the ProbSevere and additional lightning jumps continued to highlight the threat of severe weather as the storm continued eastward as the storm propagated eastward. This information is a high temporal resolution (1-2 minutes) and provides additional data points that can fill gaps between radar volume times.
-JC,CS,BW


 All Sky LAPS retrievals indicate ML CAPE just shy of 1000 J/kg, but with this environment, I would expect instability to be higher.
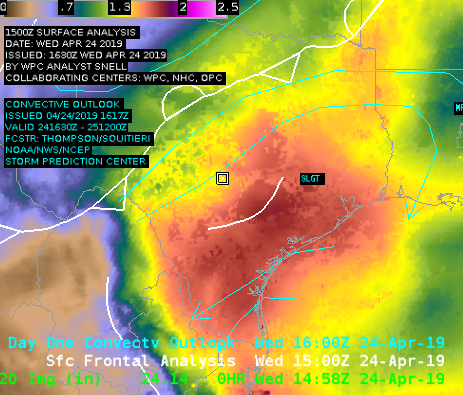
 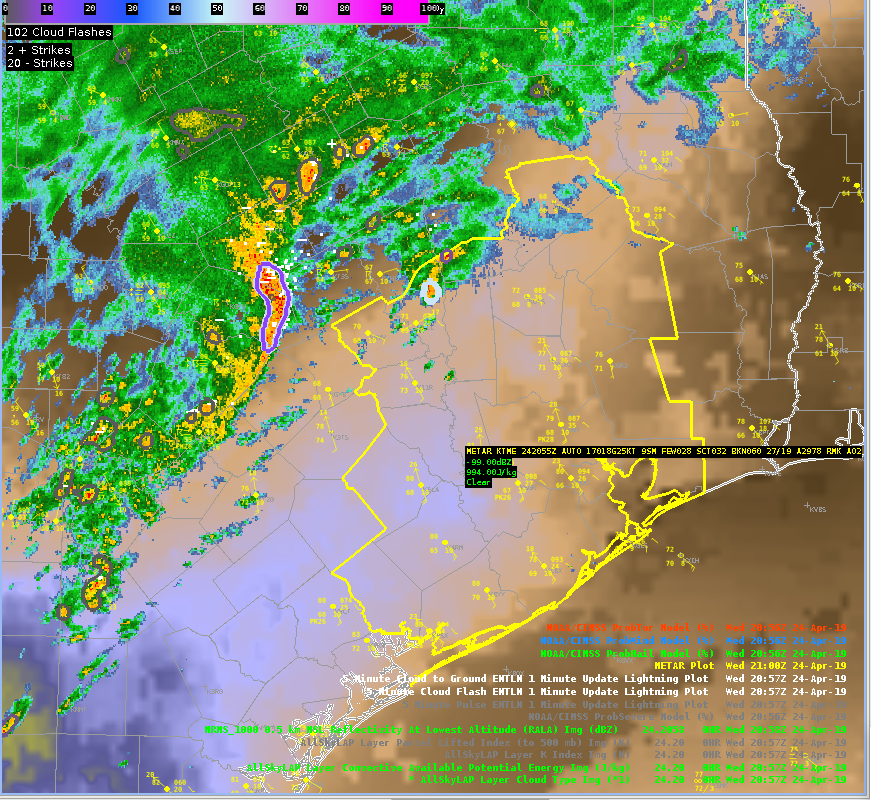 The modified NUCAPS shows a profile more in line with what I would expect to see. In this profile, the surface dew points were close to what surface obs show, but the surface temp did need to be adjusted up a bit. This sounding, coupled with analyzed deep layer shear, leads me to think severe weather is a possibility in this area.
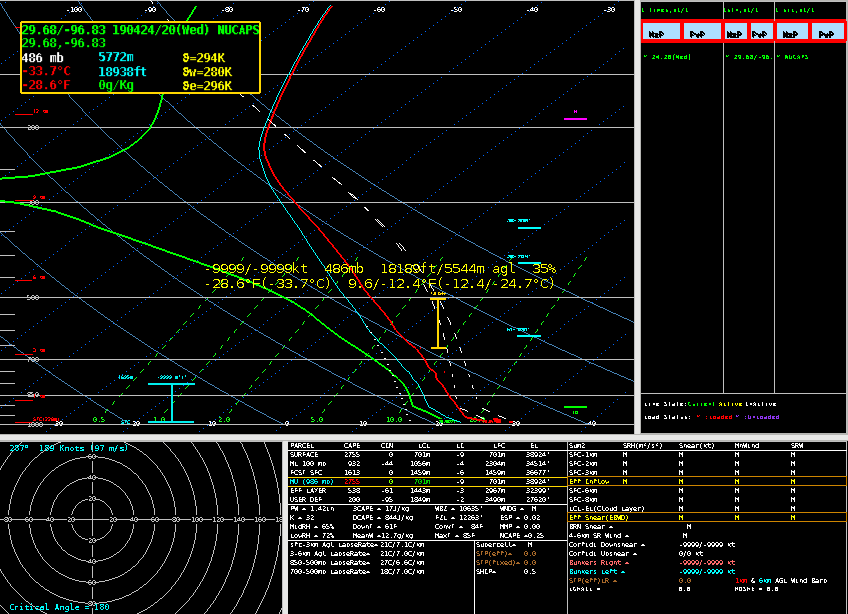 Sandor Clegane
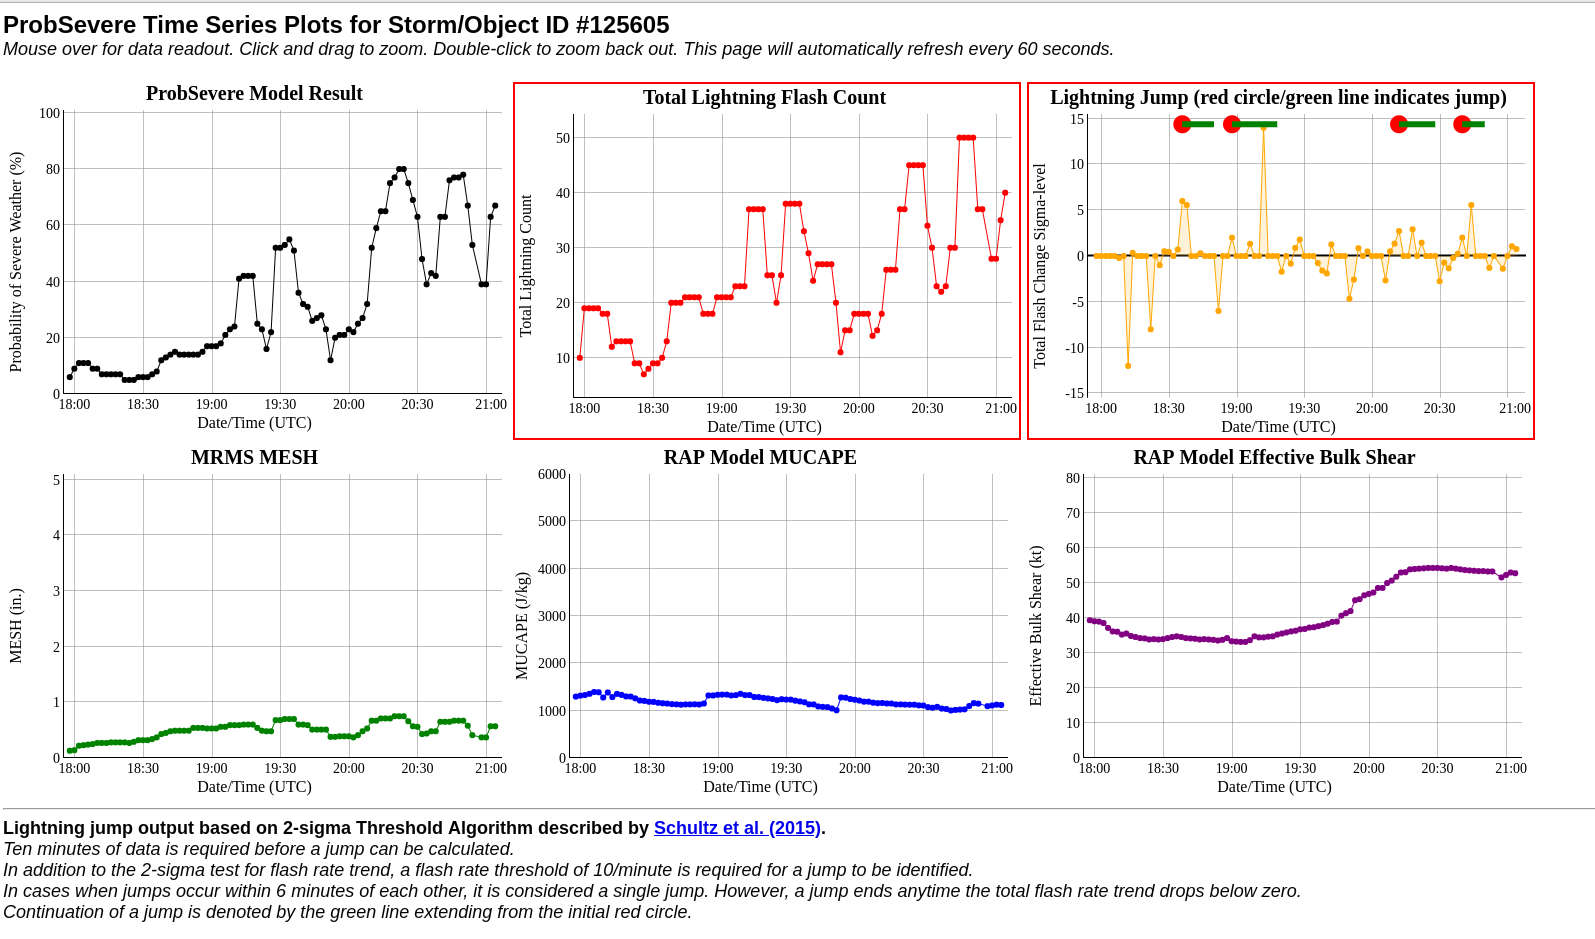
 Sandor Clegane