
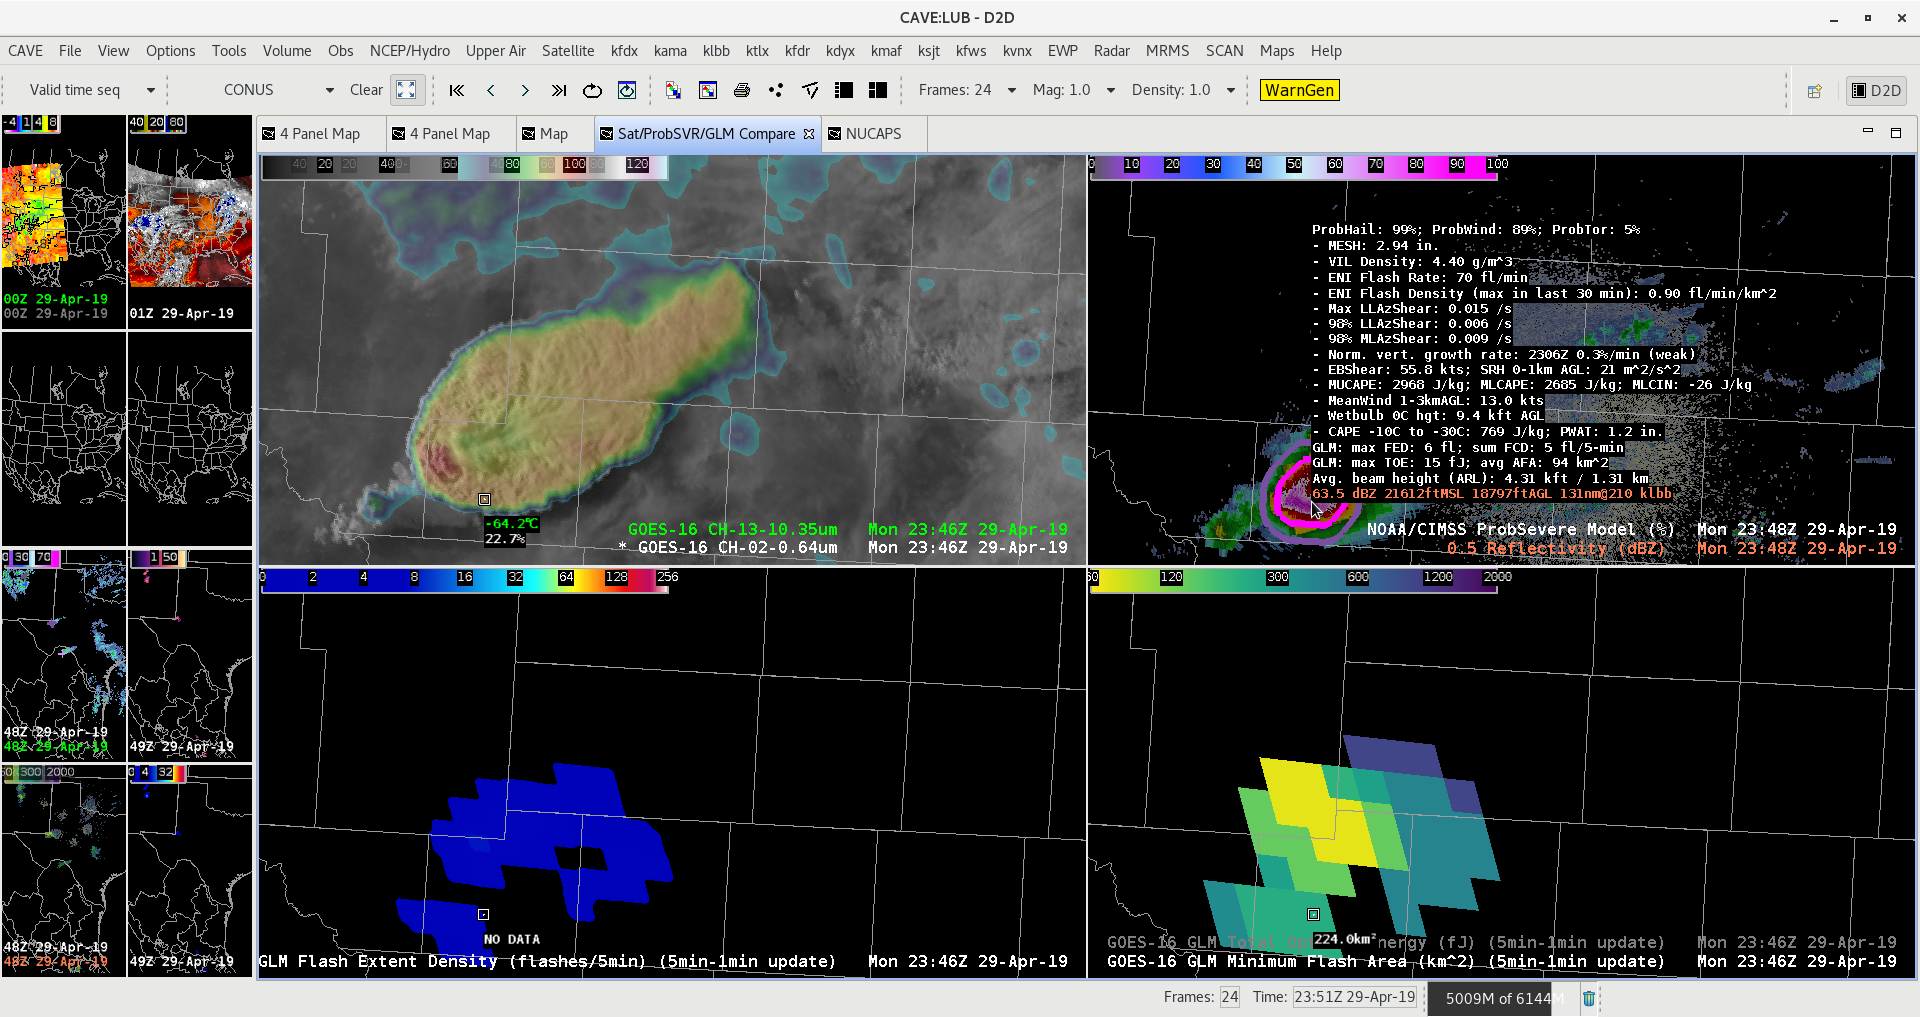
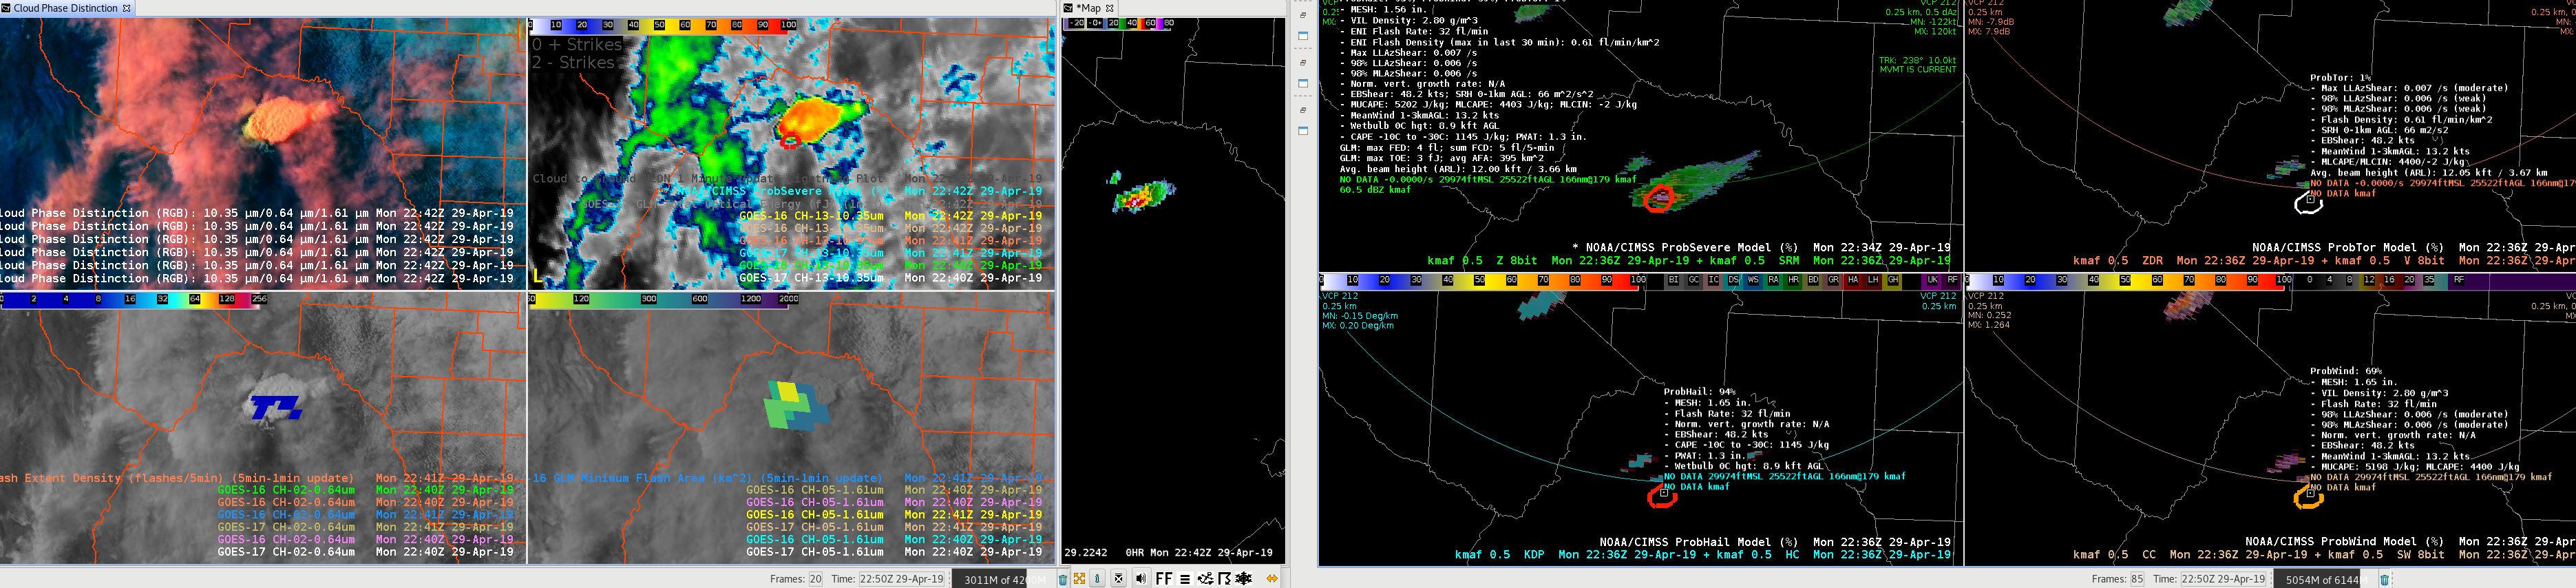
GOES-16 Sandwich Product showing a nice above anvil cirrus plume. ProbSVR showing 99% for large hail and Tor prob 5% with nice double rings. GLM Min Flash area remained in place with overshooting top of this supercell.
Official websites use .gov
A
.gov website belongs to an official government
organization in the United States.
Secure .gov websites use HTTPS
A
lock (
) or https:// means you’ve safely connected to
the .gov website. Share sensitive information only on official,
secure websites.

GOES-16 Sandwich Product showing a nice above anvil cirrus plume. ProbSVR showing 99% for large hail and Tor prob 5% with nice double rings. GLM Min Flash area remained in place with overshooting top of this supercell.
ProbSvr readout is becoming so long it is hard to fit within a 4_panel. It is not usable as a readout in a 9_panel due to the number of parameters being shown. Perhaps combine the LLAzShear into a single line such as (Max,LLA,MLA) (0.004/s,0.0002/s,0.005/s) to save space???
— S Coulomb
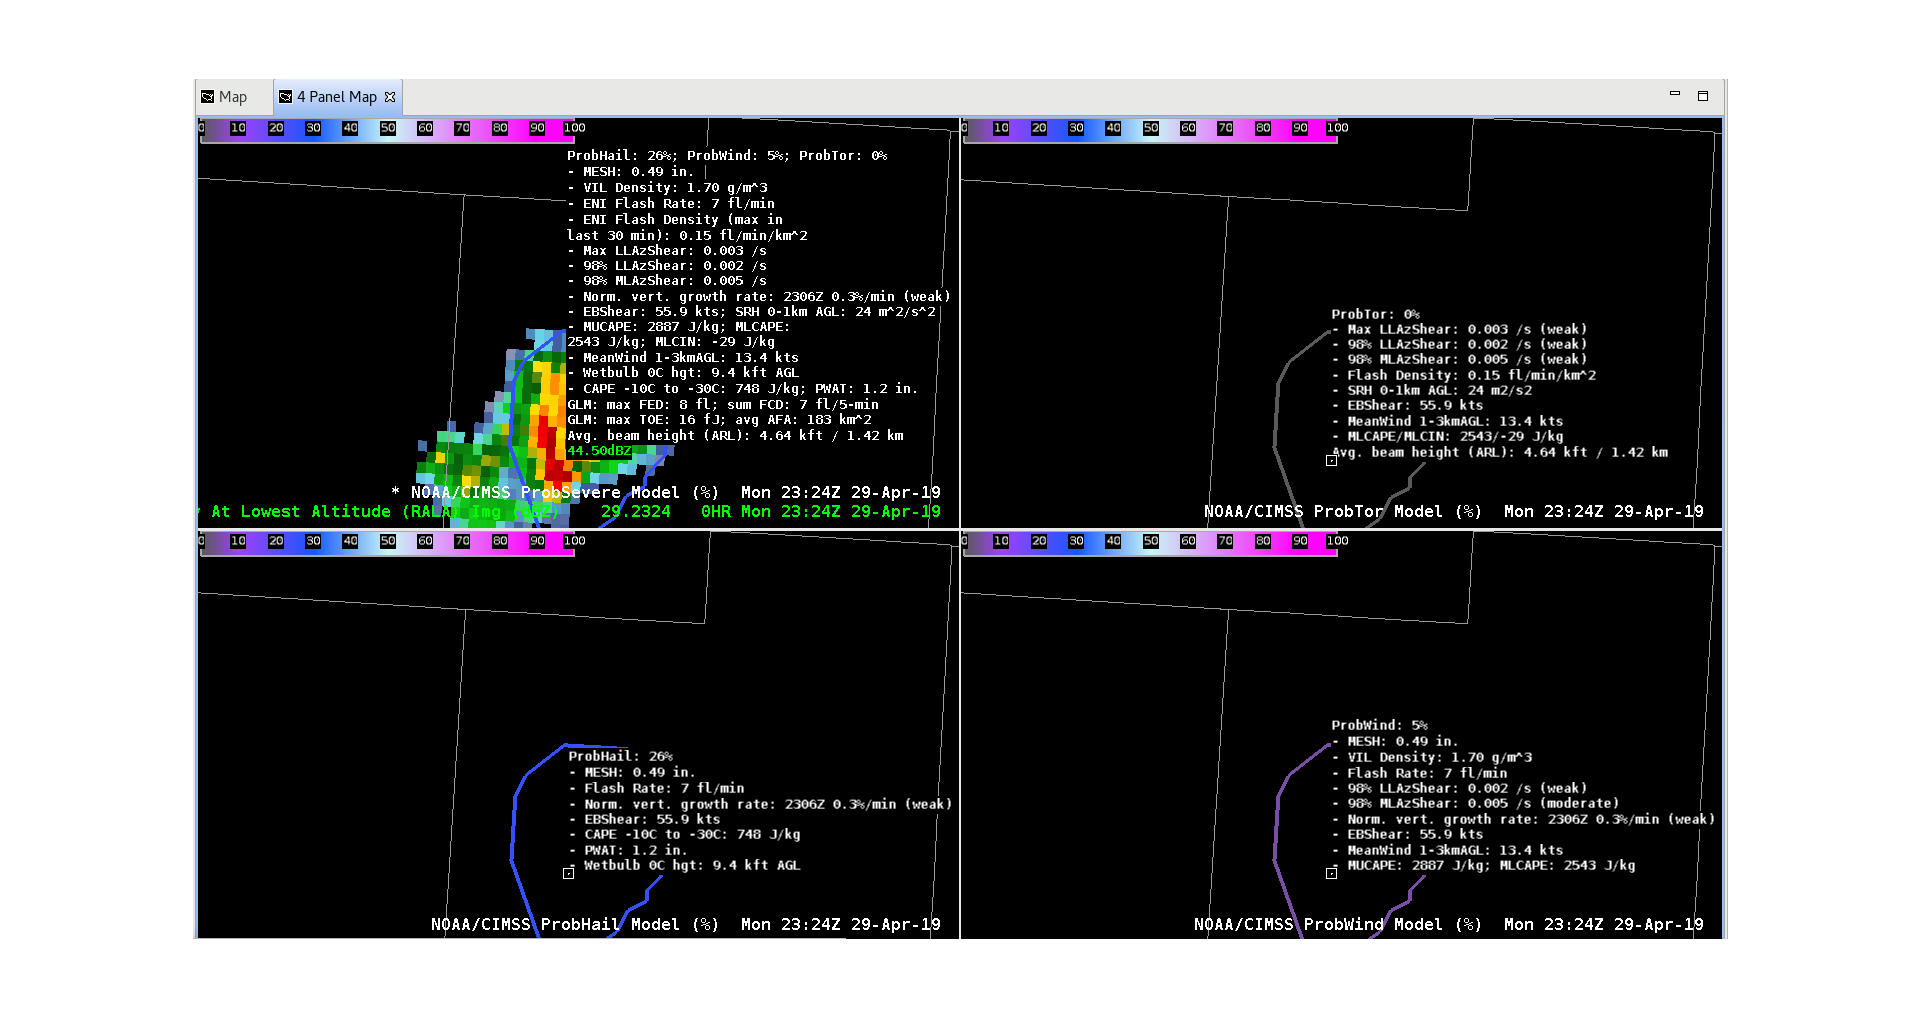
 Loop showing the evolution of a strong cell west of Del Rio in Mexico. Prob Severe values were dominated by Prob Hail in this case. This hail threat makes sense given mesoanalysis and storm mode, supported by 12z Del Rio sounding. Peak values around 97% occurred before the storm split, but after peak dbz values observed on radar. This makes sense considering the beam height at this range (165 mi from MAF) was showing the mid-level core at 30kft MSL – hail would likely have needed time to fall out from this height. This case could be useful for offices with high radar beam heights distant from isolated thunderstorms. Prob Tor did nudge up around the time of the storm split enough to show the ‘double contour’, however V data at low levels was not present.
Same storm now with GLM Event Density. This data showed a lightning decrease around the time that the storm split. Following the split, almost 0 lightning was observed in the southern cell, while the left split saw a spike in event density. The left split reinvigorated shortly after the split while the right mover weakened.
This is the same loop with radar overlaid that shows the storm split and this time flash extent density. Almost 0 lightning data seen in the south cell.
Below is an example of a case where prob severe my offer the best option for a warning decision. This storm is outside of the best RADAR coverage available; however, strong development has been seen on Satellite imagery for an extended period of time. In a case like this, the PROB Severe Algorithm may be the best option for a warning decision, based on the data available.
 South Beach
Here is one drawback of ProbSevere that has been briefly discussed. The areal extent of the identification is not based off of some of the features that feed into it, but rather the dBZ reflectivity representation. In this case, for a MCV and line of storms, the blob below is approximately 152 miles long using a center line to calculate the distance. ProbSevere kept this size of storm for two 2 minute calculations before breaking the storms apart into several different identifications.
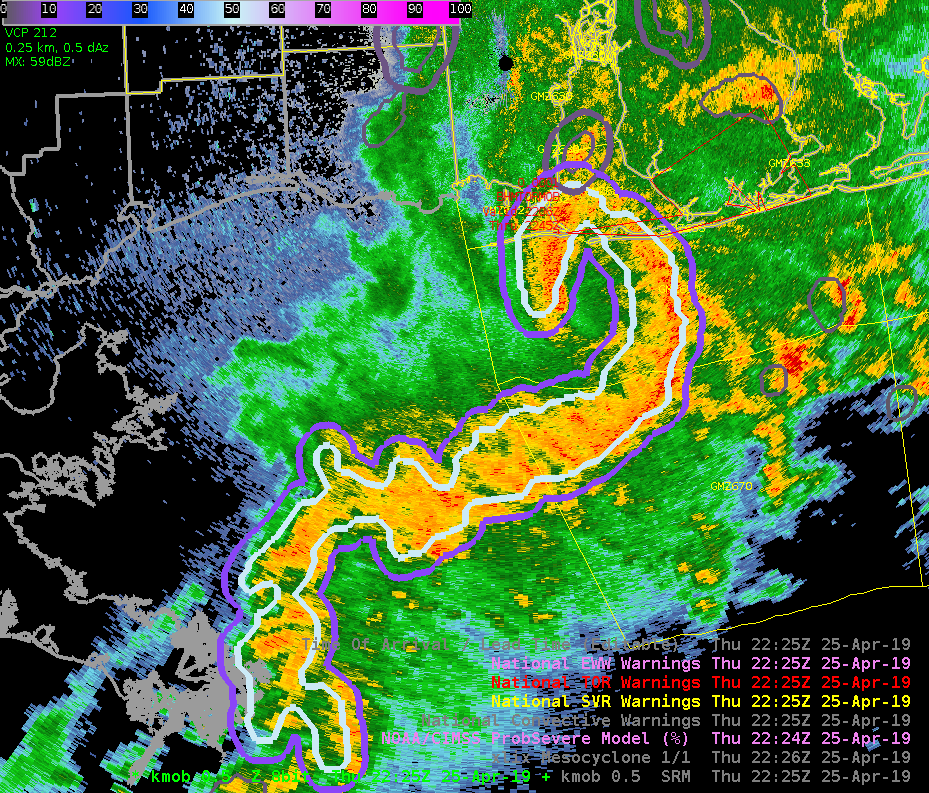
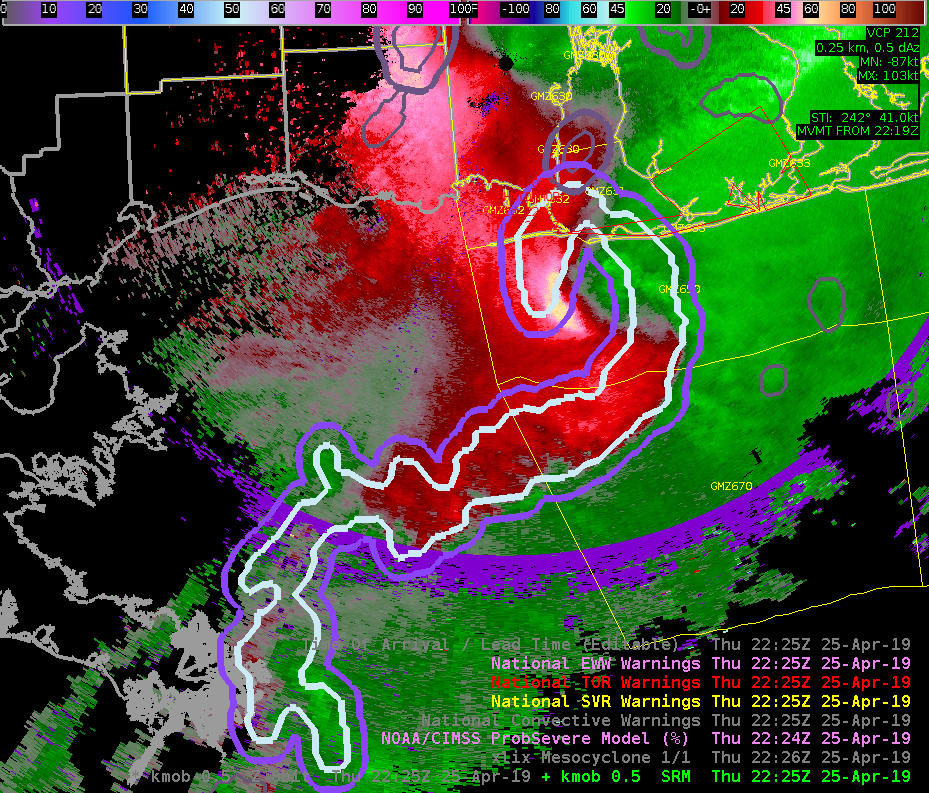
-Alexander T.
ProbTor did a decent job on pinging the developing waterspout off of LIX’s coast. As for lightning, the MFA was the first to show a response that bore paying attention to, with the ED/FED products maxing out later, as the circulation tightened and the cell matured.
~Gritty
Forcing and storms remain well to the west of our CWA, but the atmosphere is becoming primed for strong to severe storms later this afternoon. LAPS All Sky retrievals show that ML instability has been steadily building, reaching roughly 500 J/kg along the Gulf coast.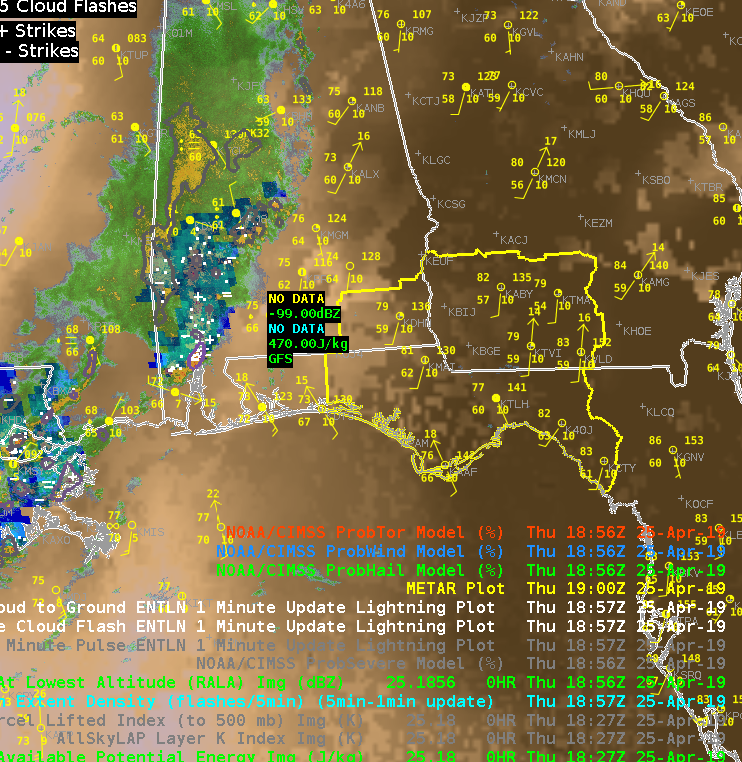 An 8 hour loop shows how the instability has built and gives more confidence that instability will continue to build ahead of the storms to our west.
  We did feel that LAPS CAPE seemed a bit underdone given the intensity of the downstream of the convection, so we took a look at the latest NUCAPS retrievals. We examined the point in the extreme SE of our CWA.
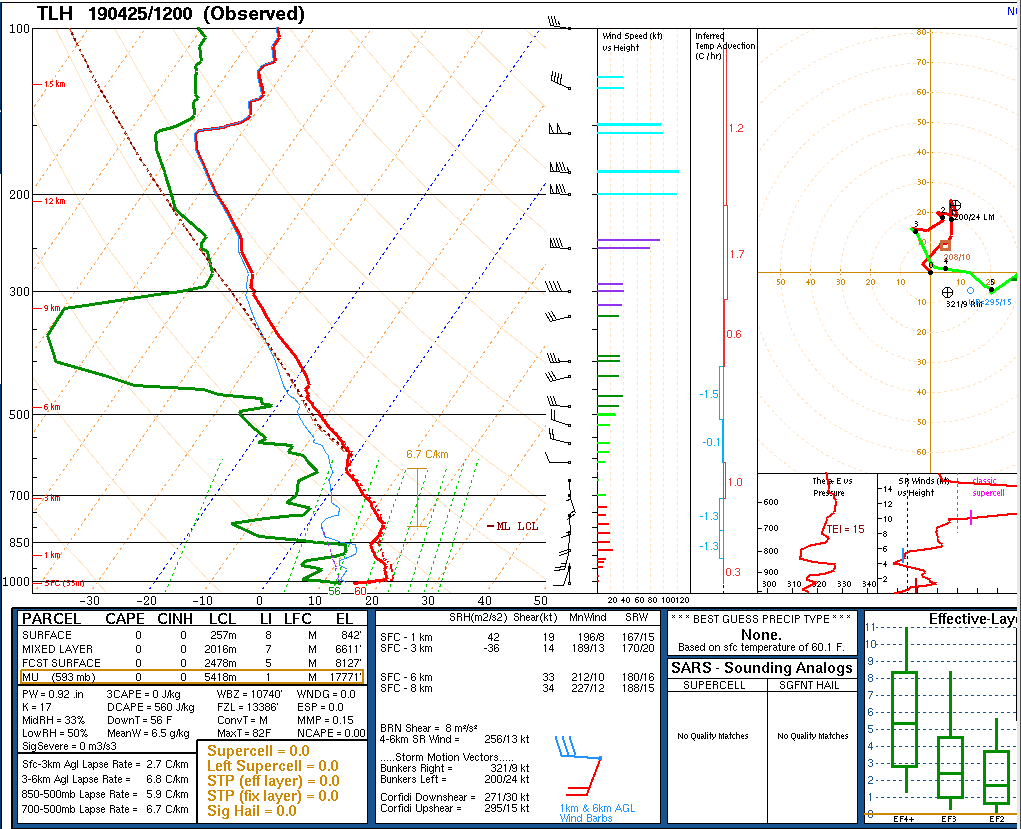
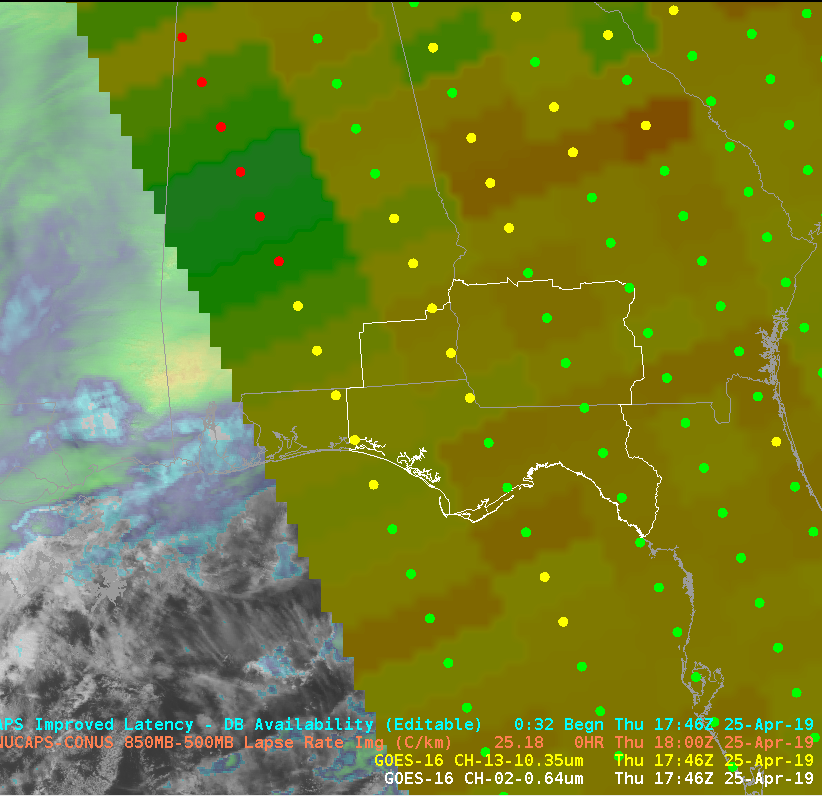 The boundary layer on the unadjusted sounding required some adjustment to match the nearest obs, but overall, seemed to capture the general profile well. I was initially skeptical about the warm nose just above 700mb, but a similar feature was evident on the 12z sounding from TAE. This feature may have an impact on storm intensity and potential hazards, and it would be particularly helpful to see how this feature changes over time.
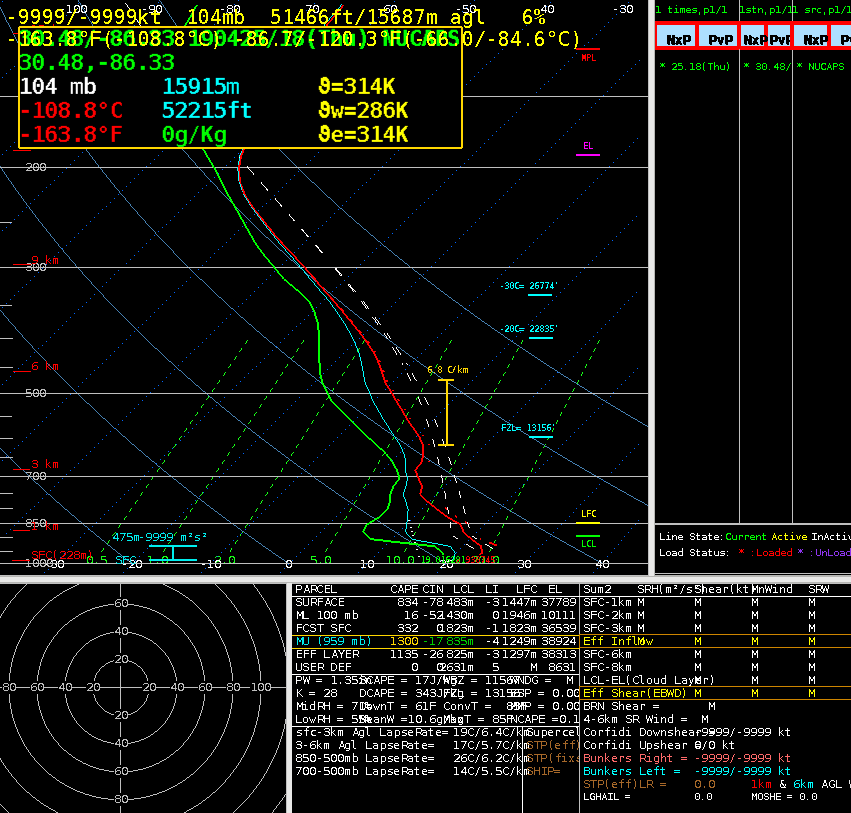
 Sandor Clegane
PRIOR to the Milam/Burleson County tornado warnings that you can read about below in other blog posts there was a tornado near the Texas A&M Campus in College Station. See these tweets:
If you looked at the image below you would not really be concentrating on the storm (I use the term ‘storm’ loosely) near College Station on the right side of each panel. Based on velocity, AzShear, Reflectivity your focus would be the bowing line segment to the west that would soon produce gate-to-gate velocity signatures south of Hearne.
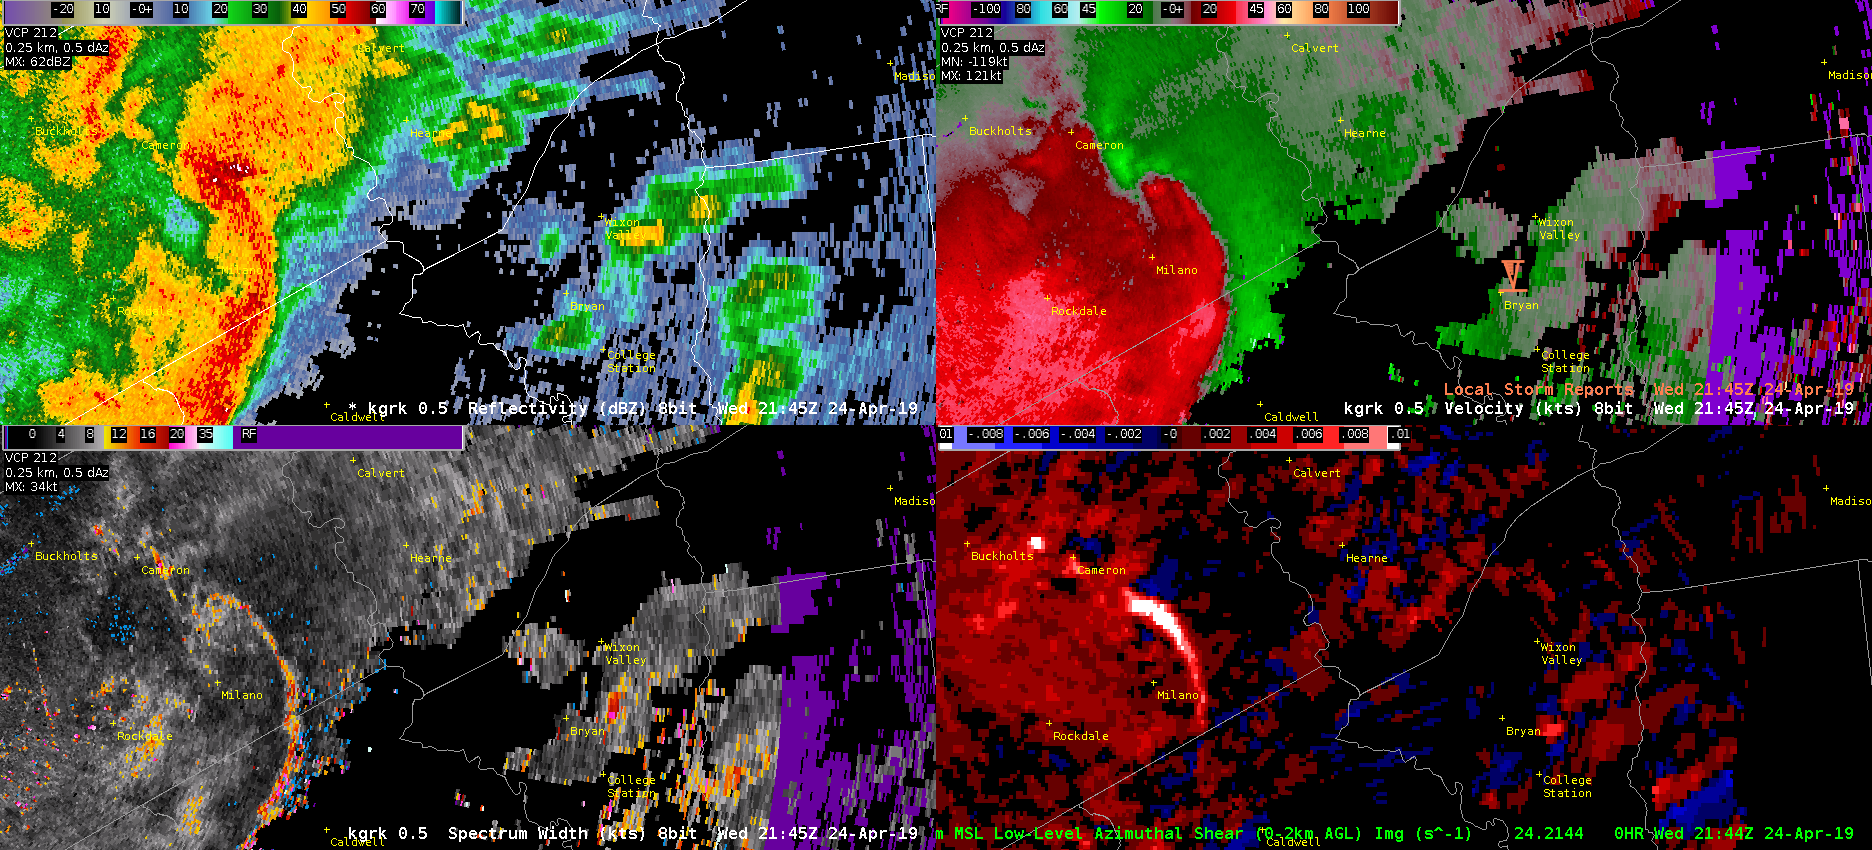
If you were to zoom into Bryan-College Station though a few things begin to jump out at you. Mainly the high Spectrum Width, the relative maxima in AzShear, and a VERY weak couplet looking signature in velocity (look near the blue Tornado Icon). This is the time that the tornado was reported. The good news is that Spectrum Width picked up on the turbulence in the storm, and AzShear does have a local max, but the values are only 0.007 s^-1 compared to 0.014 s^-1 at the bookend vortex to the west. This scale only goes from 0 to .01 s^-1.
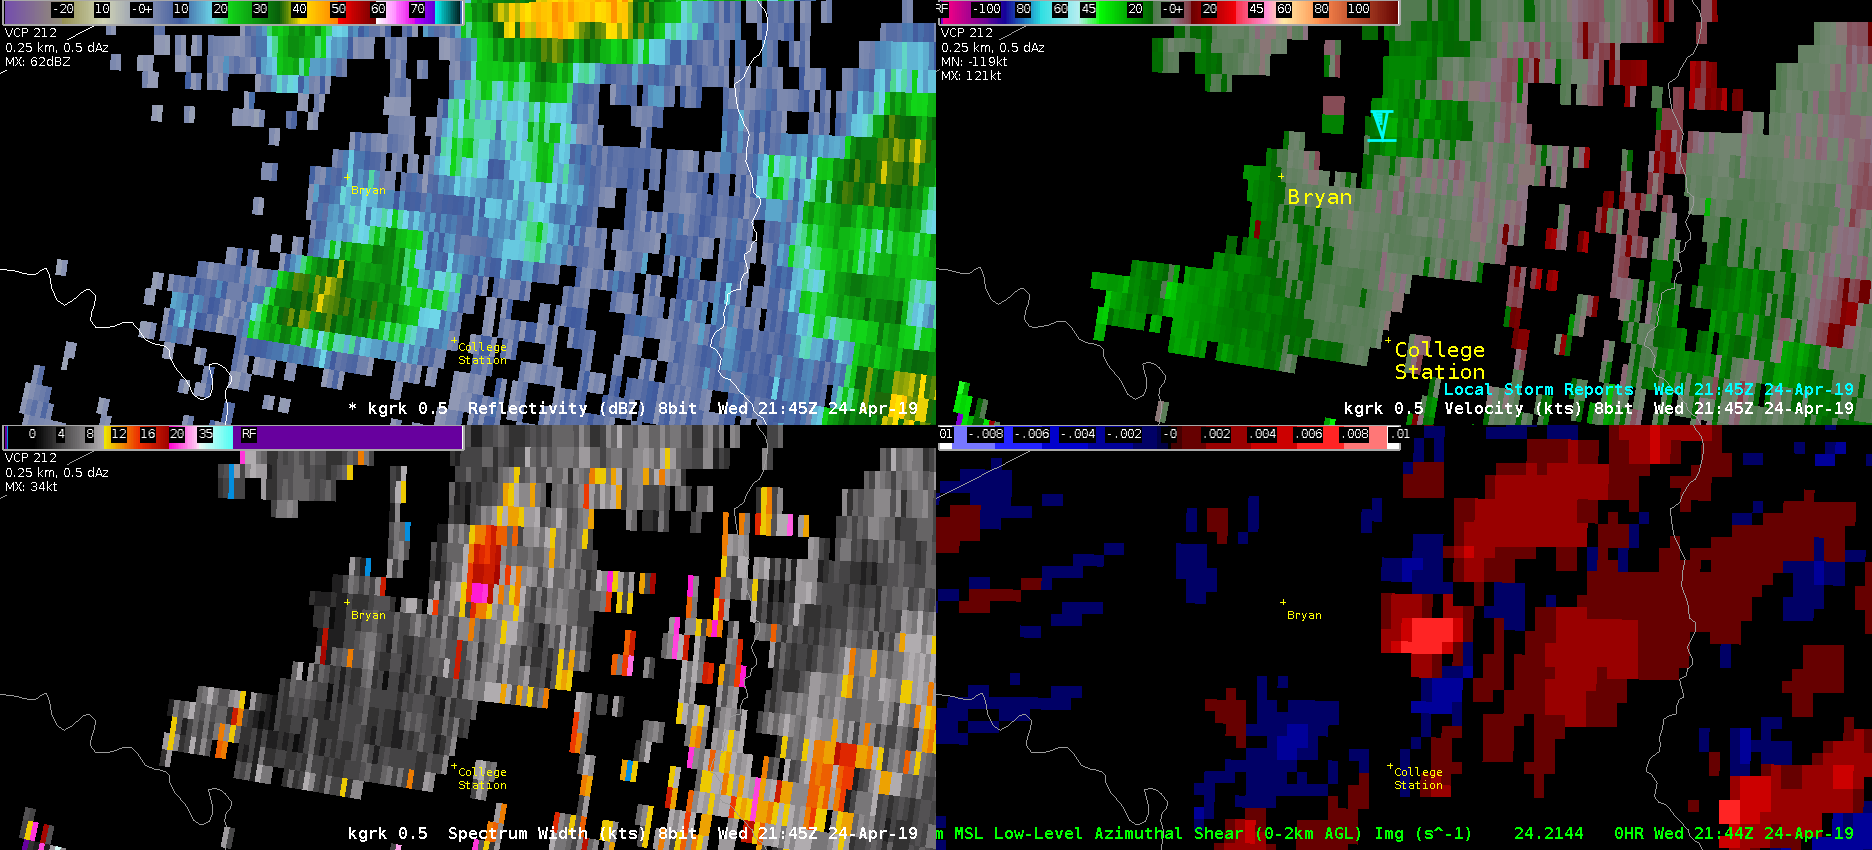
The velocity signature does get slightly better in the 2149z. This is probably a quick spin up due to boundary interaction, but it is shocking that this little SHOWER produce the tornado when the larger storms to the west produced NO reports as of now (0026z). The good news is that there were local maxes in the AzShear and SW, but not enough that these would be your focus of course.
ProbSevere never pinged the storm…and there were other indications in velocity, AzShear, and SW with other showers that were similar to the tornadic College Station storm. Oh the joys of quick spin up tornadoes due to boundary interactions in Central Texas!
-Alexander T.
ProbSevere and the GLM helped bring may attention to a storm in the northern portion of my CWA. ProbWind began exceeding 50% as the Flash Extent Density began spiking. This led to investigation of base radar data which led to a severe thunderstorm warning.
 Sandor Clegane
Storms in the EWX CWA early in the shift were generally remaining sub-severe, with what looked to be heavy rain as the dominant threat. The first two loops (below), the storms were riding right along the gradient of the PWATs and CAPE. (continues below)
As the cluster of storms reached the eastern edge of a greater area of instability (below), the concern then turned to how much of the instability would be tapped into and how storms would react, with the thought that they’d likely become more robust. (continues below)
Attention was then turned to how the GLM was observing the evolution of the stronger cluster of storms within the northeastern portion of the CWA. I created a four-panel display, with MFA overlaid onto the mesosector visby imagery (upper left, below), clean IR with TOE overlaid (upper right; I had blinking enabled to capture the highest fJ, but is unseen in this GIF), Event Density with Group Centroid Density overlaid (bottom right, below), and FED with Flash Centroid Density overlaid (bottom right, below). It was fascinating to watch how the lightning unfolded with this particular cluster, and the MFA in particular immediately drew my eye to the storms moving toward the FWD CWA border. The smaller flashes began to blossom and expand out, which then had me look at the TOE and density products. The density products ramped up, but what I found the most interesting is that the MFA seemed to give me that initial clue that this storm was in fact tapping into some of the higher instability and allowing for the updraft(s) to intensify.
I then proceeded to take a look at the MRMS LL AzShear product (below), wistfully wishing I could look at the single radar version of this product. Sure enough, a clear signature developed, highlighting the amplifying wind within this cluster.
Last but not least, looking at ProbSevere, the ProbWind product picked up well on this signature, highlighted below.
Conclusion: I’m continuing to see some promise that there’s something to look deeper into with respect to these additional lightning products, particularly the MFA when used in combination of something like the Event or Flash Extend Density products. There seemed to be a good correlation with the TOE, as anticipated, but I’m still unsure about its utility as a stand-alone product. As for the Average Flash Area, I didn’t even pull it up given the limited amount of screen space I had and what I saw yesterday, with the AFA in particular not giving me hope of being able to gather good info/lead time in comparison to the MFA.
~Gritty
Side note: Had some excellent conversation with the GLM expert in the room and as we were talking and analyzing some of these products, it was noticed that there was quite an extensive channel, lightning that shot out well to the north of this cluster of focus. These GLM products could provide beneficial information when providing DSS to partners, such as letting partners and the public know not to go back outside just because there’s either light rain or the storm had already passed.