
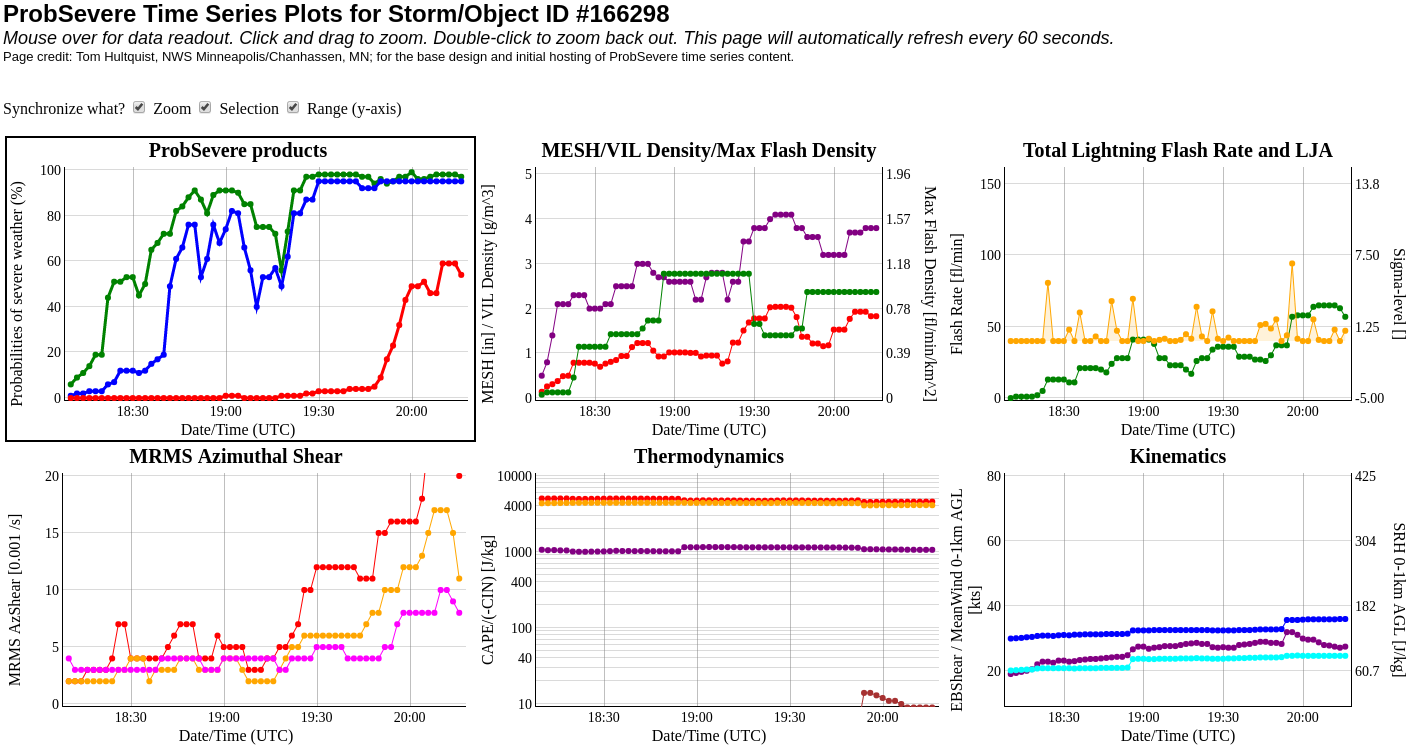
ProbTOR showing rapid increase in tornado probability with AZ_Shear increase. These time series trends are extremely valuable for trends when diagnosing storm intensity increasing/decreasing. – Jake Johnson
Official websites use .gov
A
.gov website belongs to an official government
organization in the United States.
Secure .gov websites use HTTPS
A
lock (
) or https:// means you’ve safely connected to
the .gov website. Share sensitive information only on official,
secure websites.

ProbTOR showing rapid increase in tornado probability with AZ_Shear increase. These time series trends are extremely valuable for trends when diagnosing storm intensity increasing/decreasing. – Jake Johnson
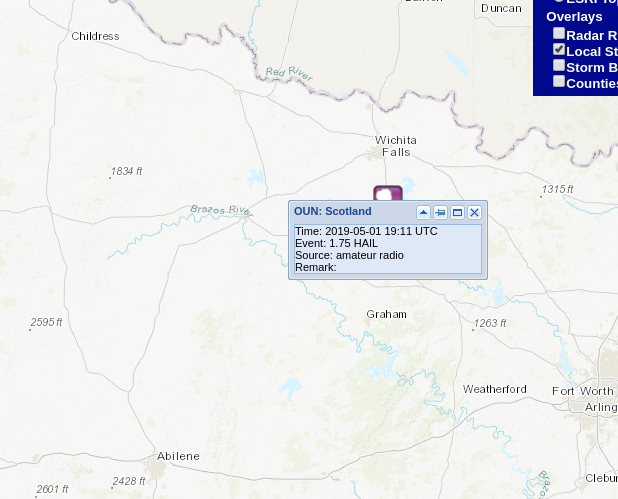
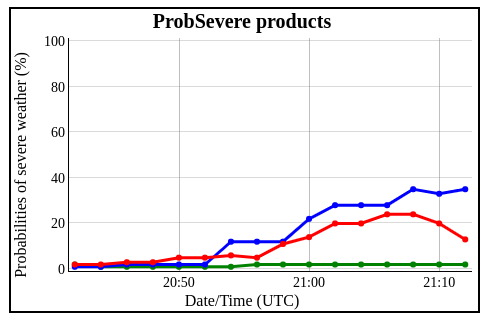
With Large Hail being the biggest concern today. Focus has been primarily on that aspect. Notice how high the severe hail probability climbed very rapidly. With a report coming in just after a major jump in the probability of severe hail.
Notice the report came in 10 minutes after the large jump in probability.
A great way to track your storm intensity trending.
South Beach
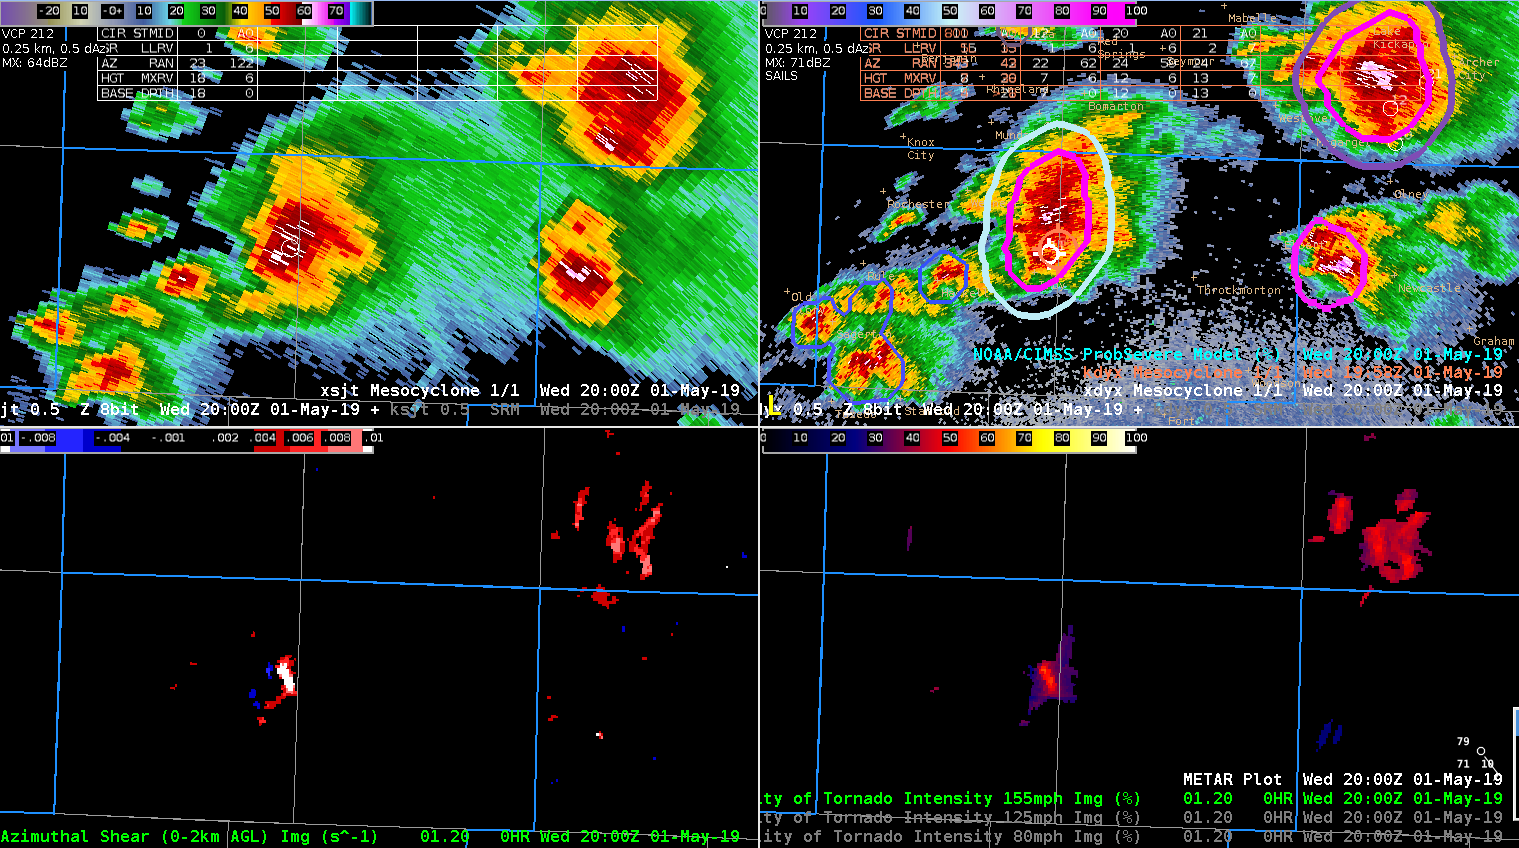
The supercell over NW TX developed a new meso. AzShear also picked up on both circulations. ProbTor values remained relatively low (~3%) throughout this transition. AzShear was weak with SRH only 107 m2/s2, mean wind was also low at 22 kt – all enviro. parameters were near the climatological averages not increasing the ProbTor above average values.
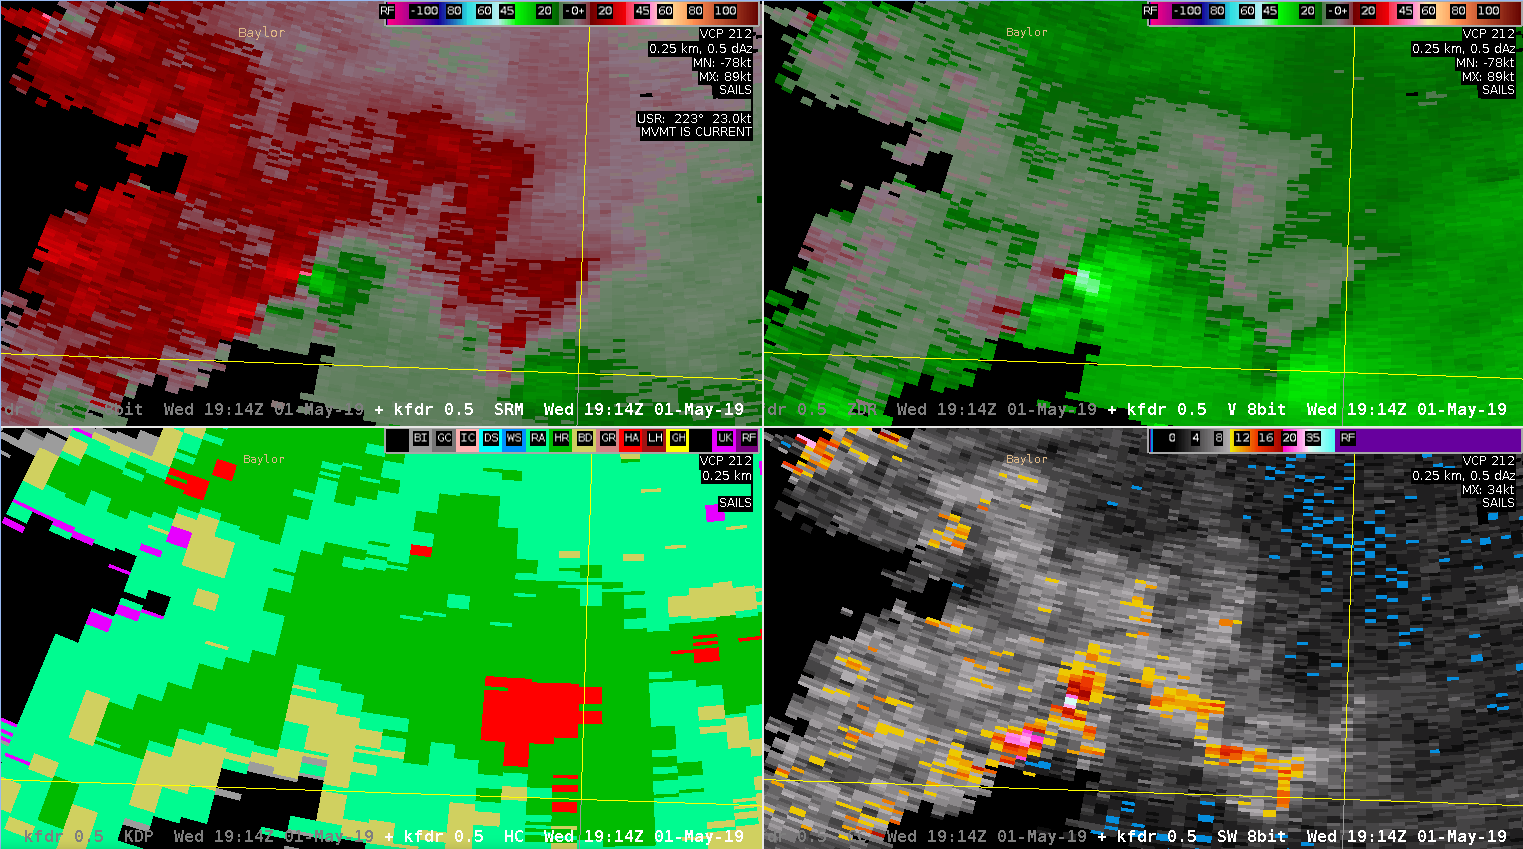
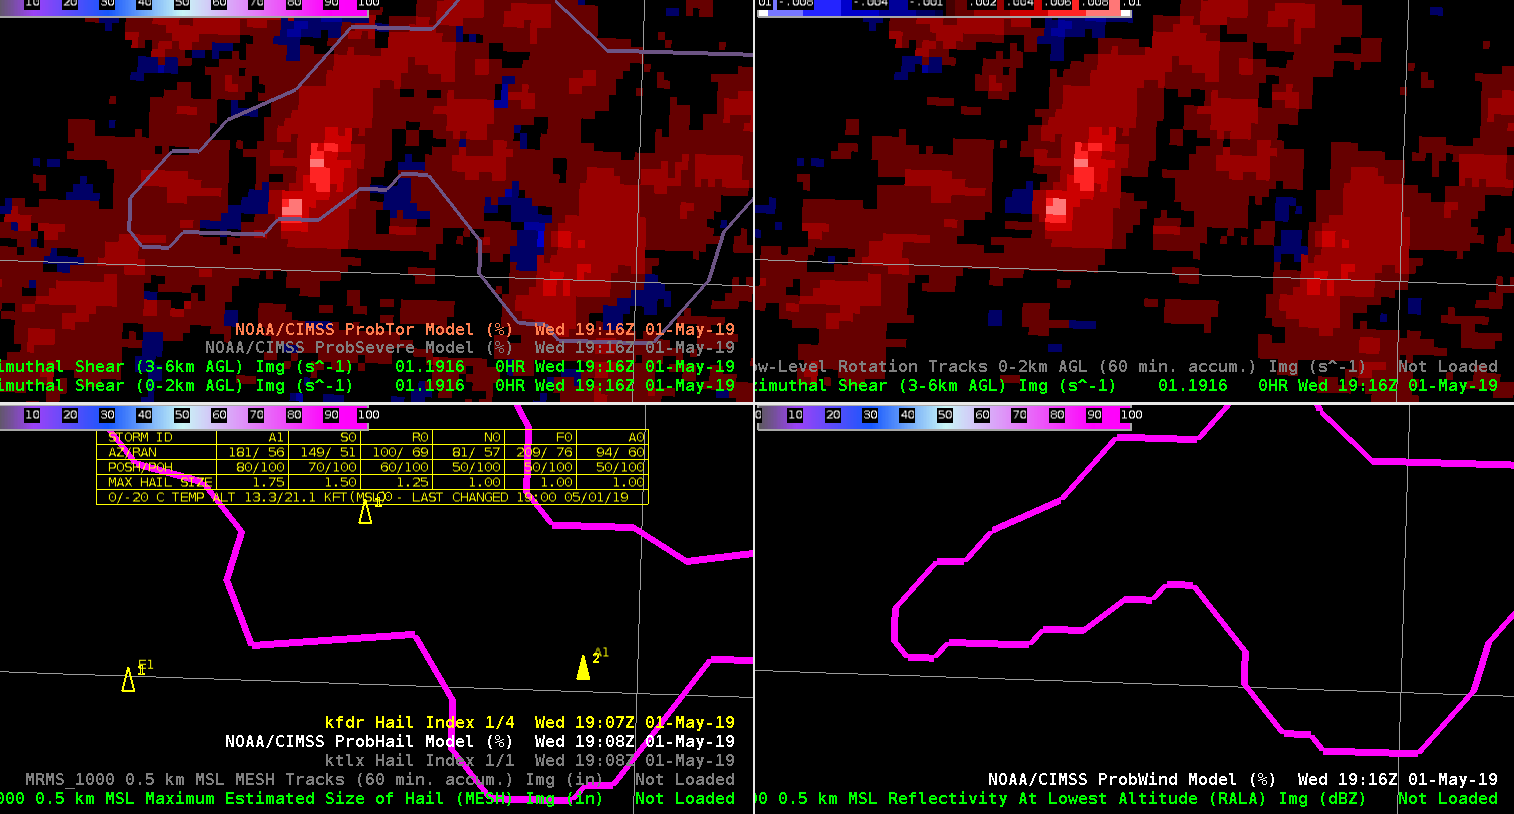
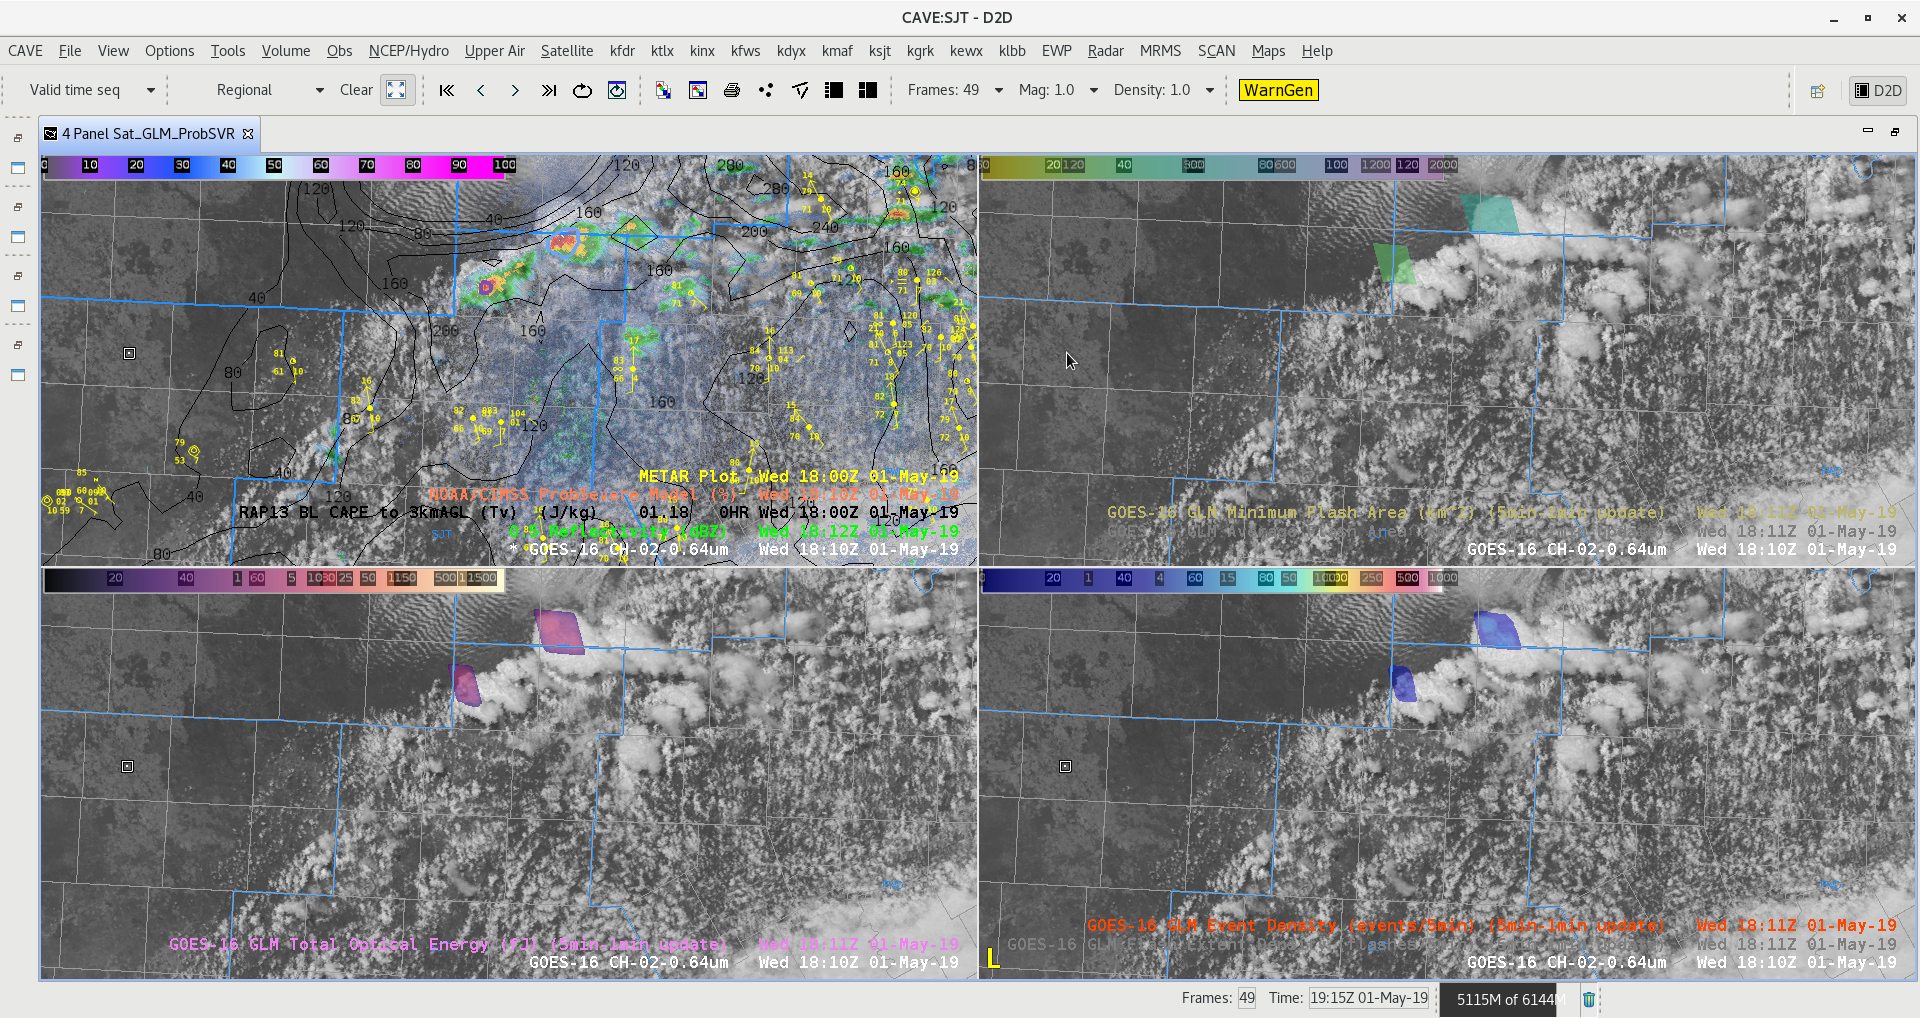
Figure A
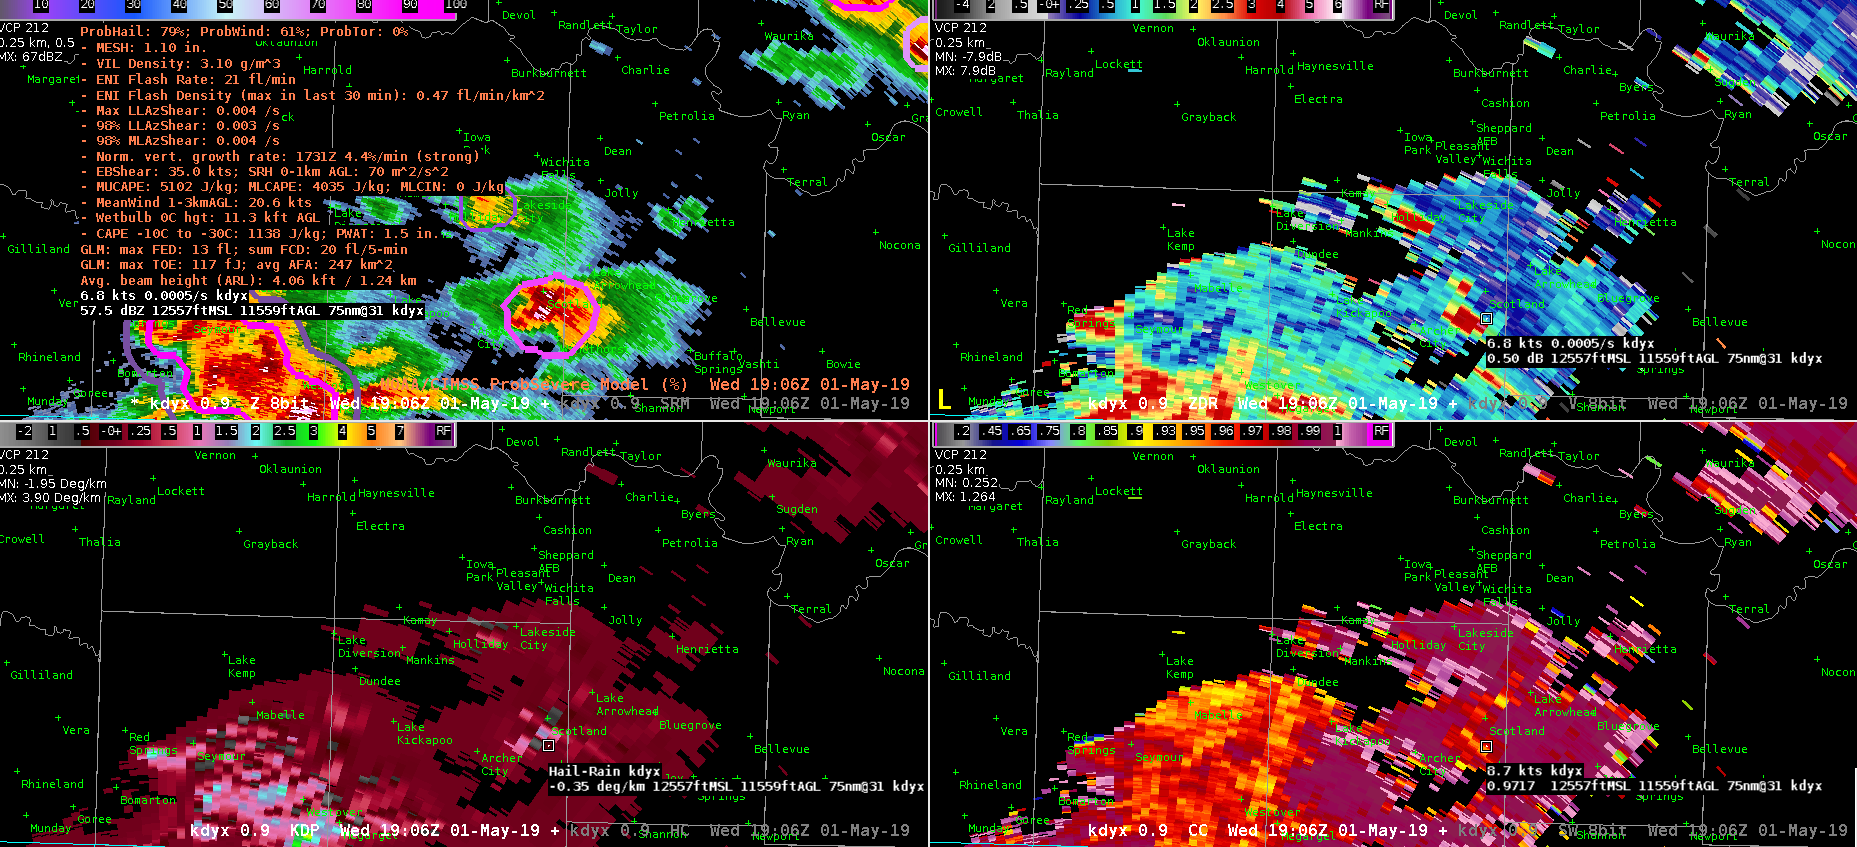
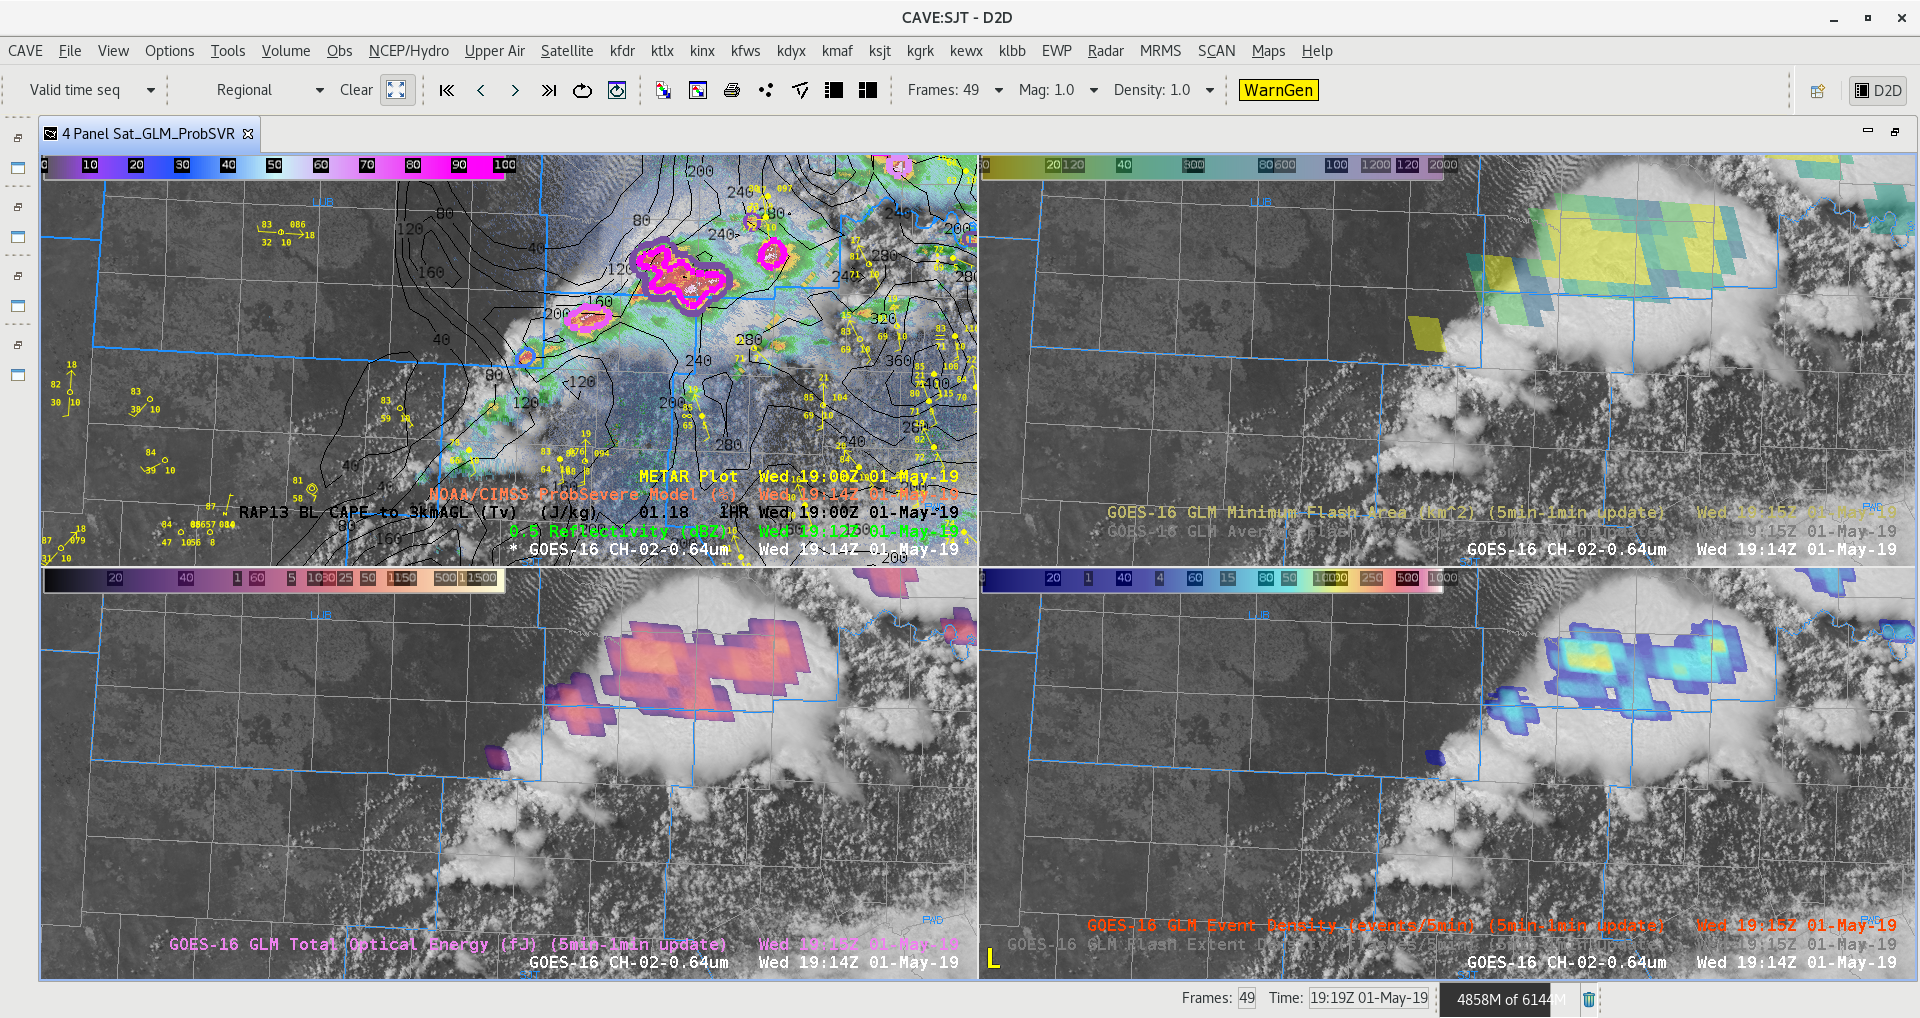
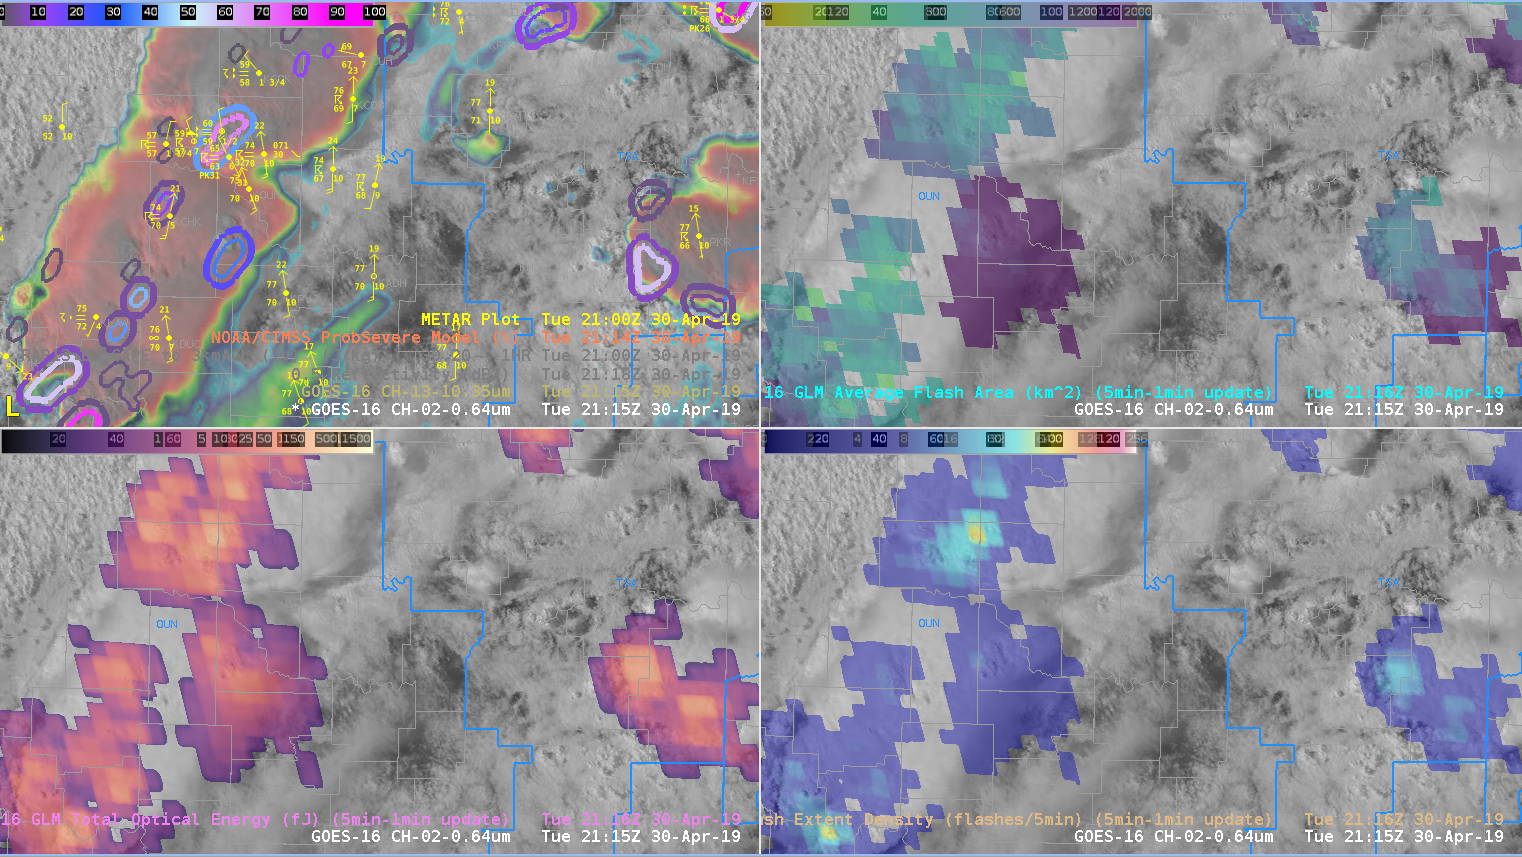
Lightning and ProbSVR detection of first storm develop in west Texas. GLM products high-lighting two updrafts at 1810Z in Figure A.
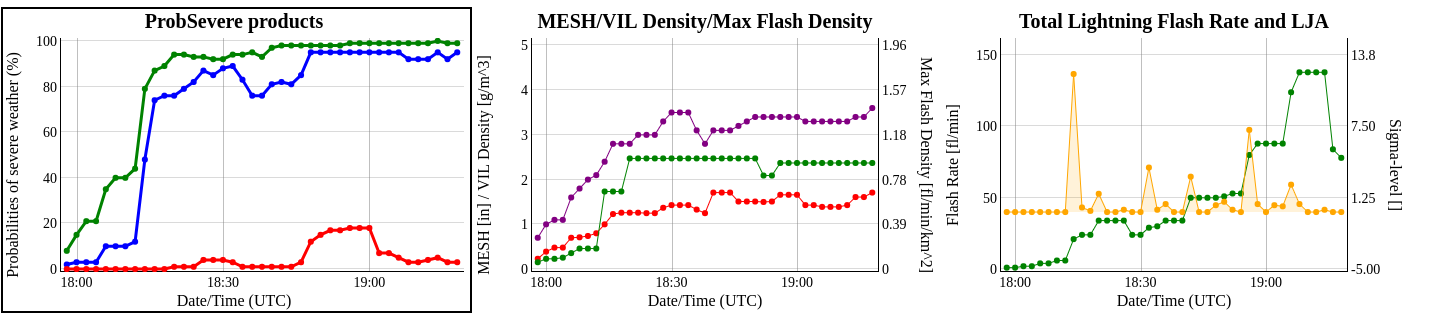
Lightning really increased showing lightning jumps and ProSVR Hail/Wind greater than 90% in time series trends. Notice Tornado trend increased slightly with lowering wall cloud report, however environment is not as favorable for tornadoes today with 0-1km shear on the low end.
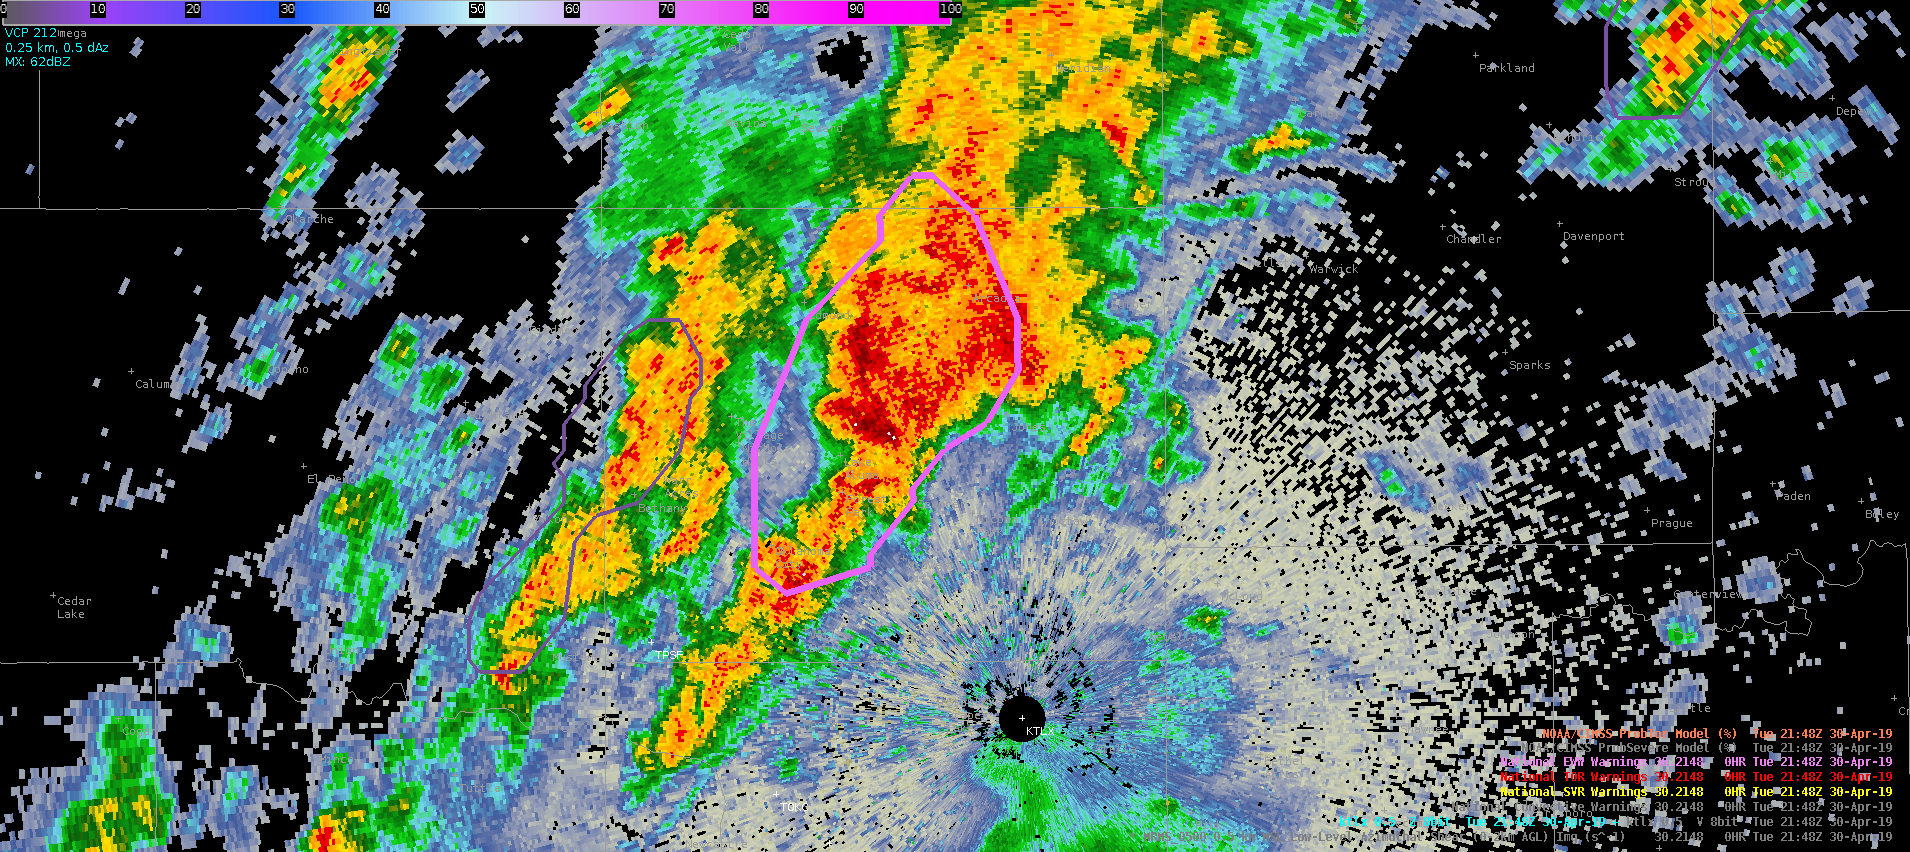
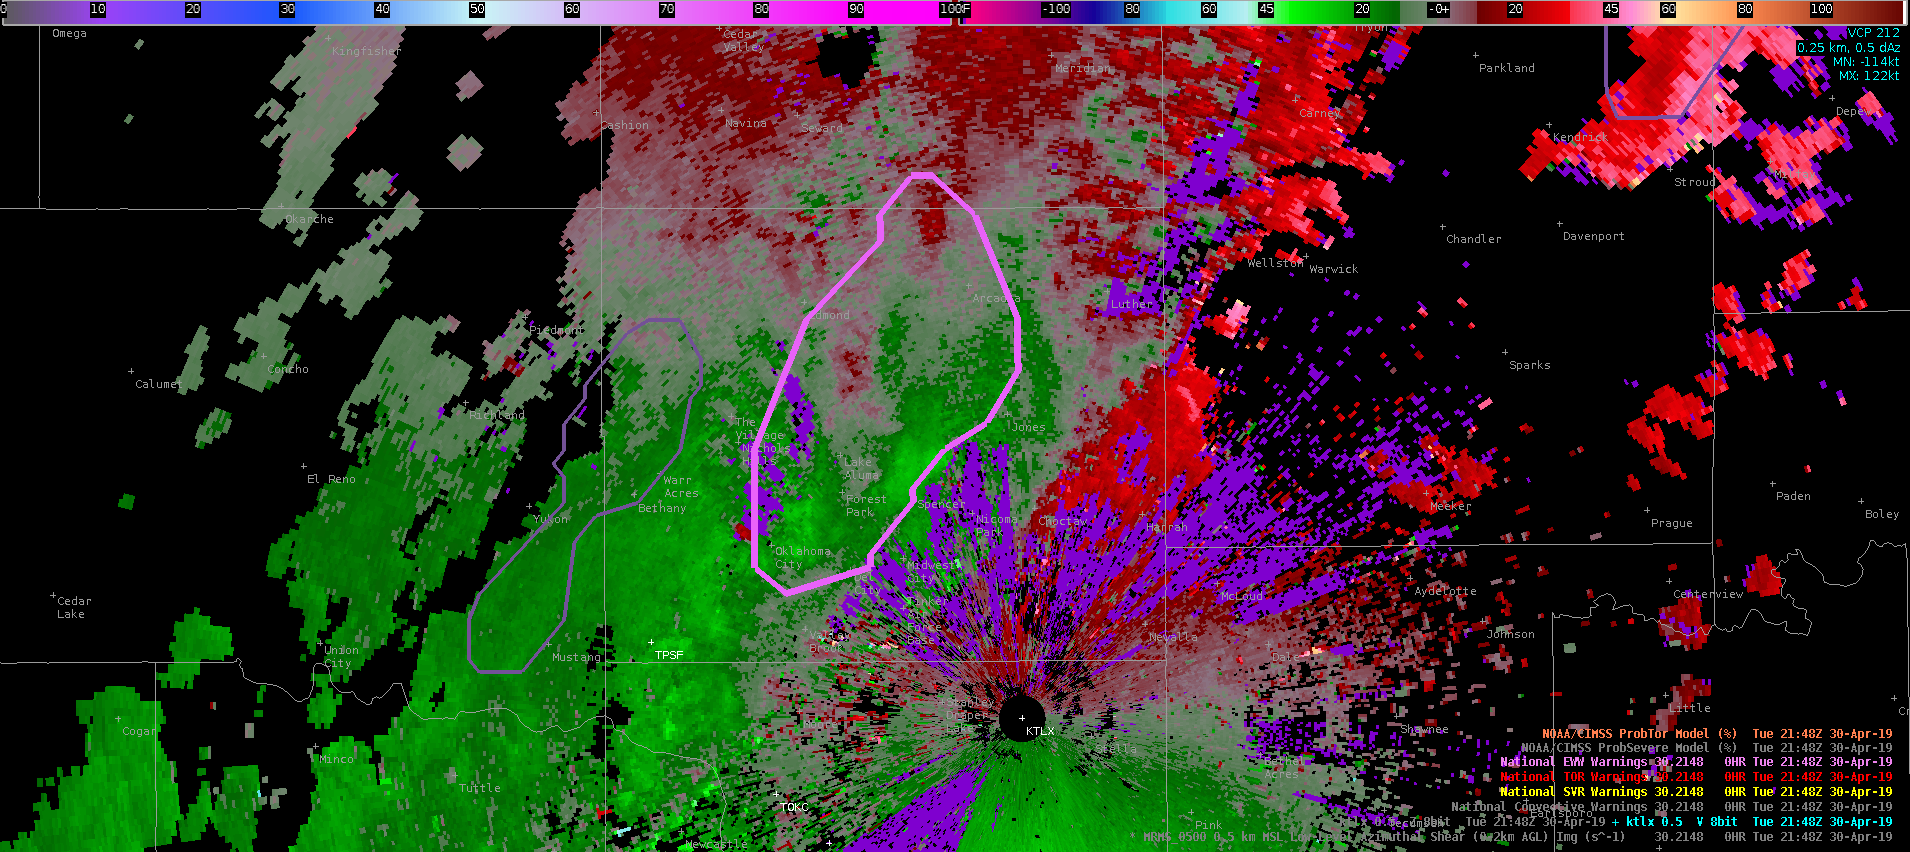
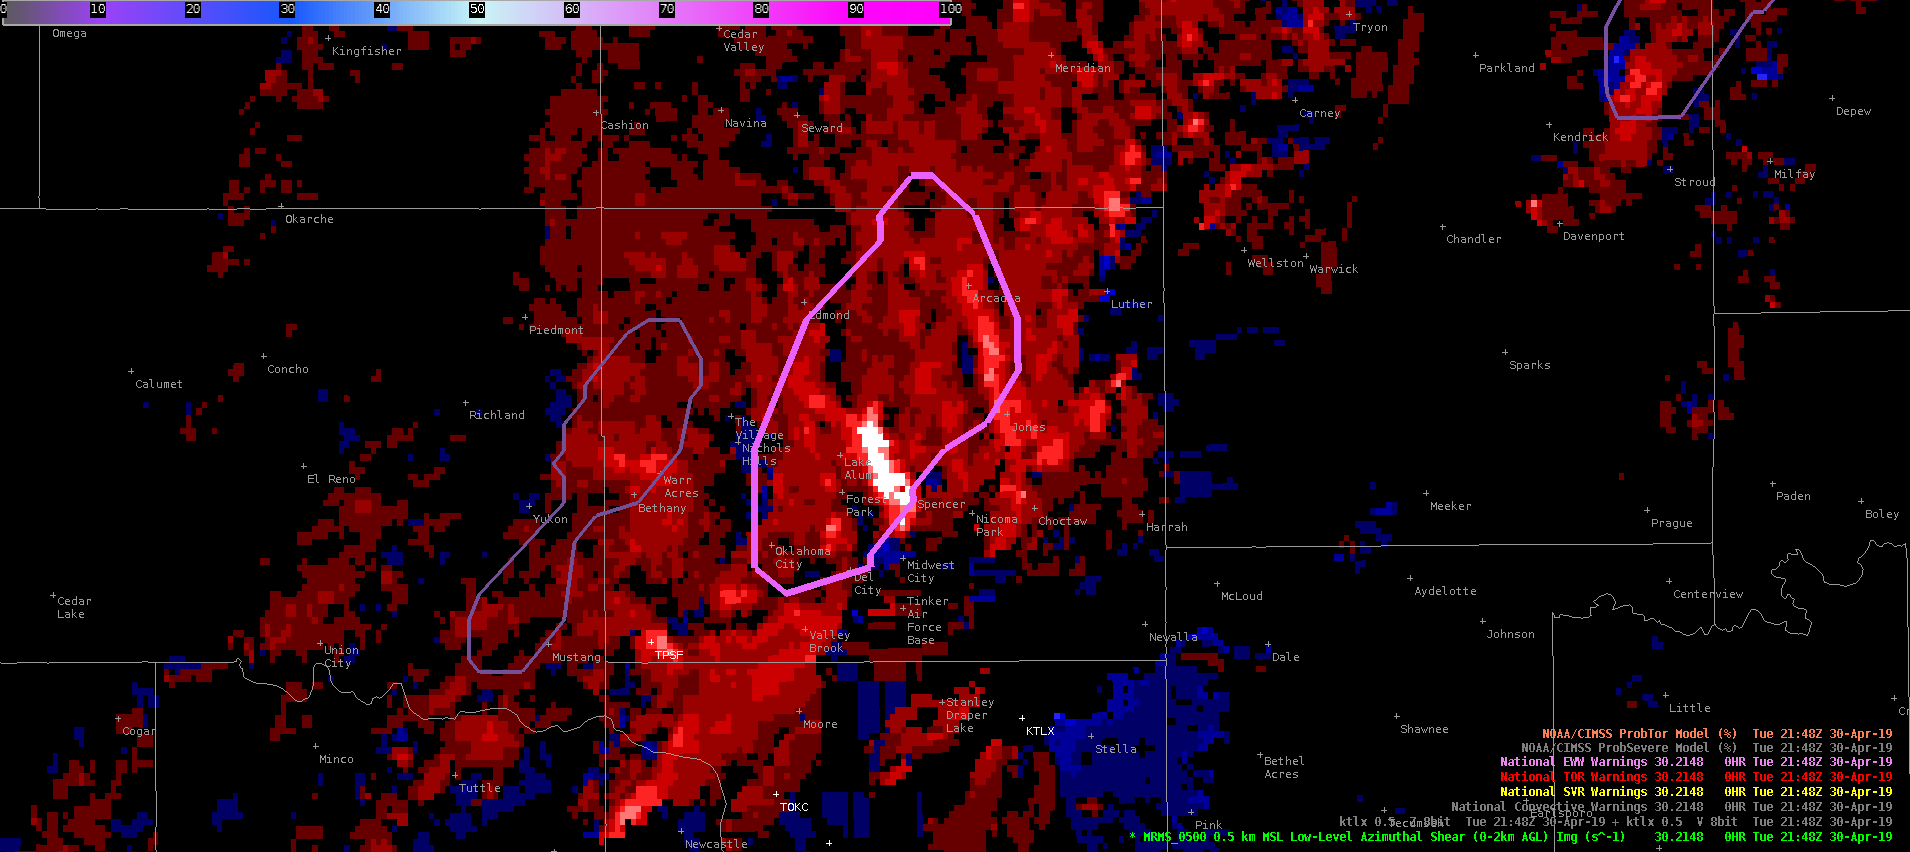
Here’s another example where a casual look at ProbTor might cause some confusion. Flow parallel to the boundary across the OKC metro eventually won out and the semi-discrete cells merged into a messy, slow-moving mess shortly before 22z. At 2148z, ProbTor peaked at 74% for the mass of convection just NE of OKC. However, KTLX velocity showed no immediate areas of concern. The answer to the high ProbTor was found in the 0-2km merged AzShear product. AzShear showed an enhanced area of shear to the NE of OKC near Spencer with generally convergent and broad flow. This is a good example of how ProbTor can be useful in operations: it quickly highlights areas for further investigation that can either be confirmed or thrown out with a very quick interrogation of the base data. In this case, ProbTor worked well, it was just biased by the abnormal/noisy AzShear data.
–Stanley Cupp
2148z KTLX base refl (top), base velocity (middle), and 0-2km AzShear (bottom) with 74% ProbTor contour overlaid on each
Here a strengthening southern supercell invaded the personal space of its “more aged” northern neighbor. The merger did not change the ProbTor values of the original, stronger storm (90%) but did eventually show a slightly lower value (87%) despite the southern storm becoming more intense in rotation. There were only subtle differences noted in the ingredients and nothing stood out as to why the Prob values dropped.
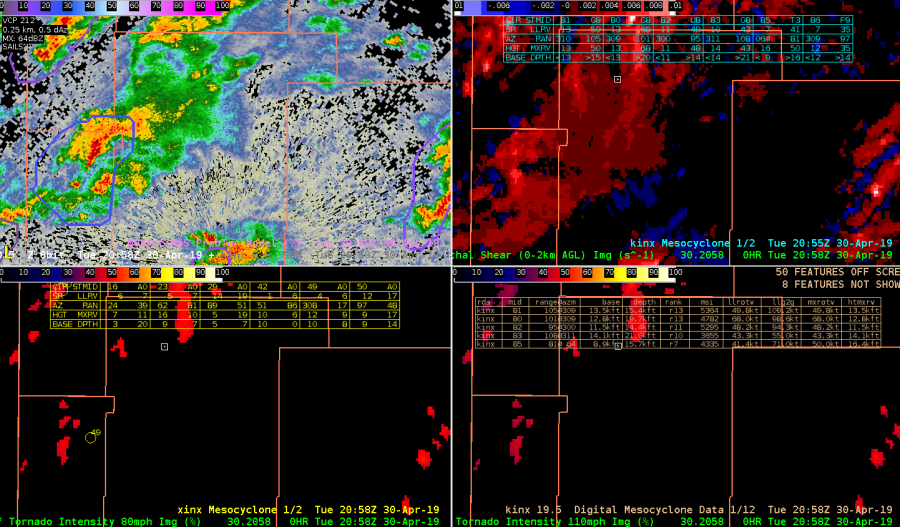
As for the new mesocyclone algorithm (xmda) the strength rank jumped to 25 (max value) at 23:32. It is difficult to follow the individual storms in the attribute table since they jump from page to page and are ordered by ID versus strength. Having the cell ID color coded at certain values (e.g. above 10 colored yellow, above 15 colored blue, etc.) would help more quickly discriminate the strongest mesocyclones, especially if you have to move to another page. ProbWind (lower right panel) continues to be very high for these supercells (consistently >90%) although no wind reports were received by SGF.
0-2km AzShear/ProbTor (UL), 3-6km AzShear/xmda (UR), HI/ProbHail (LL), Z/SRM/ProbWind (LR)
This rapidly developing supercell displayed a GLM lightning decrease as it intensified. This was a good example of optical attenuation due to an updraft core. ENTLN network is displayed, showing that there was a tremendous of CG and IC flashes despite low GLM values. Shown is the TOE product.
The same storm and lightning minimum shown in Event Density.
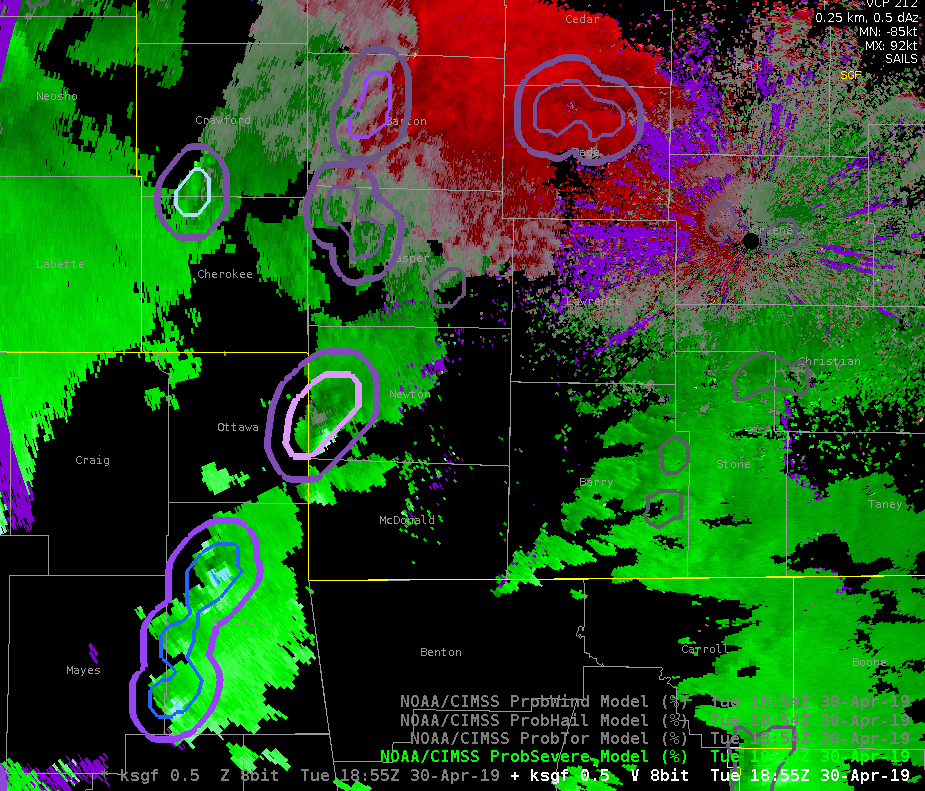
ProbTor was occasionally too aggressive. Only one of these storms was really concerning at this time given the environment and radar tilts further up in the volume. On a day like this, it would likely be prudent to increase the probtor threshold above 3%
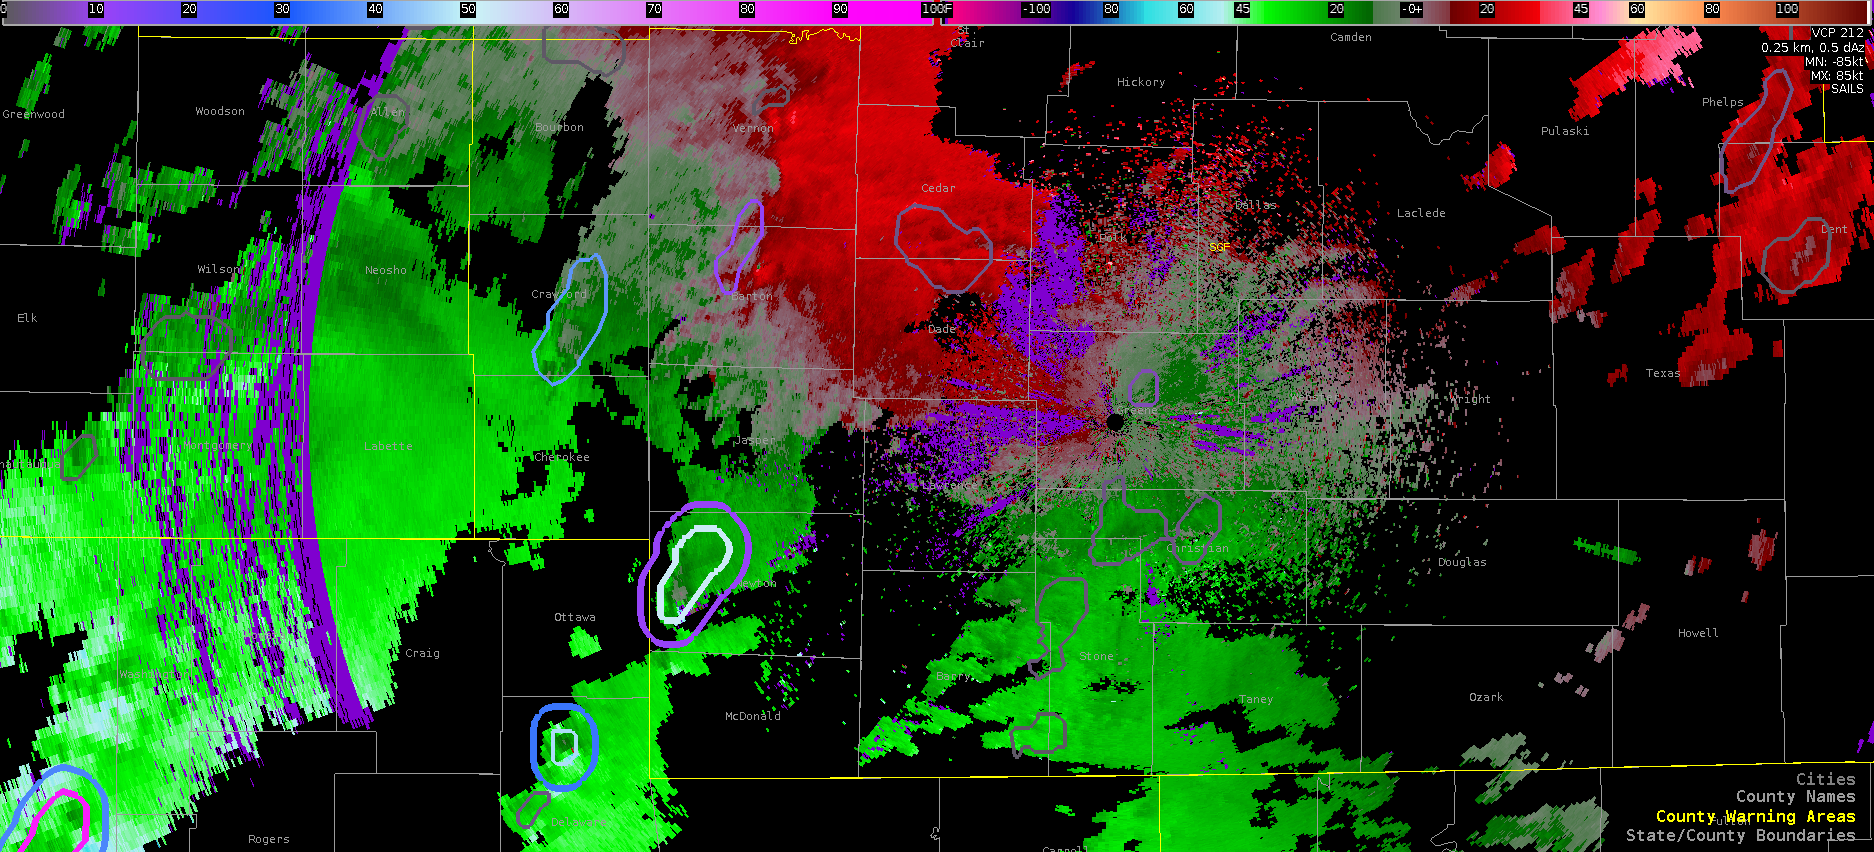
Prob Tor contours showing a new probtor threshold of 10% instead of 3%. This was edited on the fly in the localization file of the procedure itself. This view shows a less cluttered display given the amount of rotating storms this day.
Comparison of MDA products over a weak low topped supercell, as well as showing the probsevere contours. ProbTor was at 47% at the time, prompting the issuance of a Tor Warning.
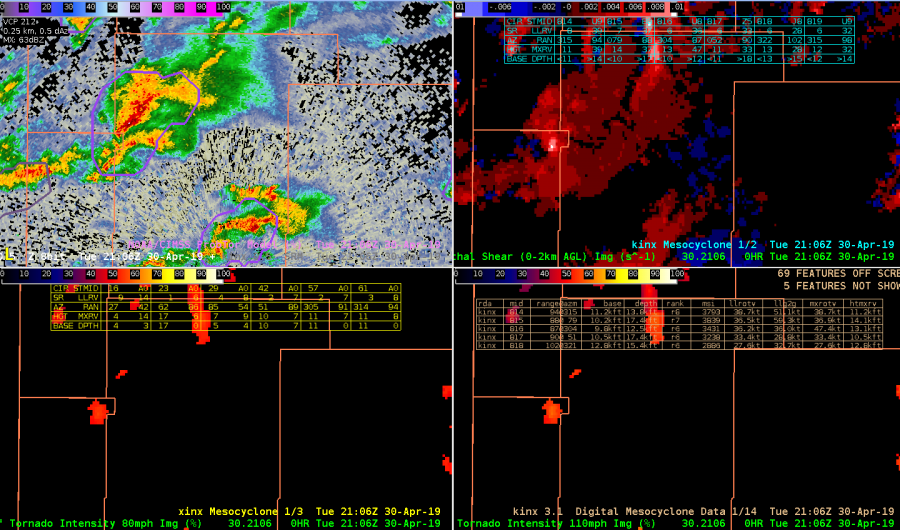
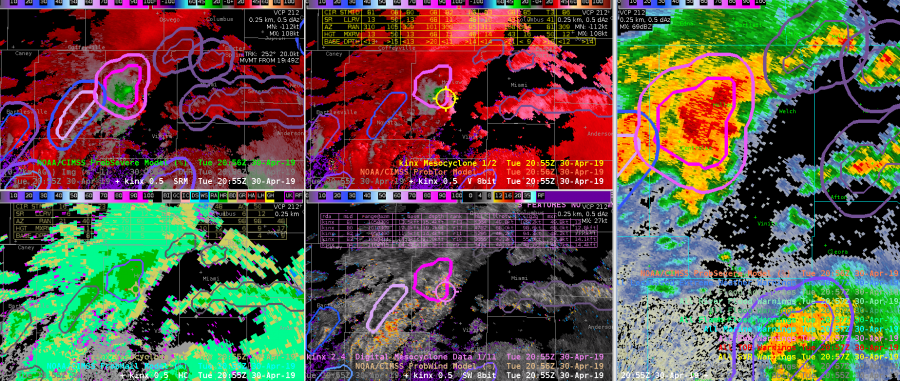
Gonna take a look at SC merger noting two small SC storms WNW of KINX radar @ 2058UTC. Prob TOR with these storms ~ 25% at this time with generally weak AzShear with stronger northern storm.
2106 UTC – just before storm merger see uptick in Azshear (0-2 km) with slight increase in CPTI products (50-52 %). DMD output not providing any useful information on these storms at this time probably. ProbTor ~ 10%
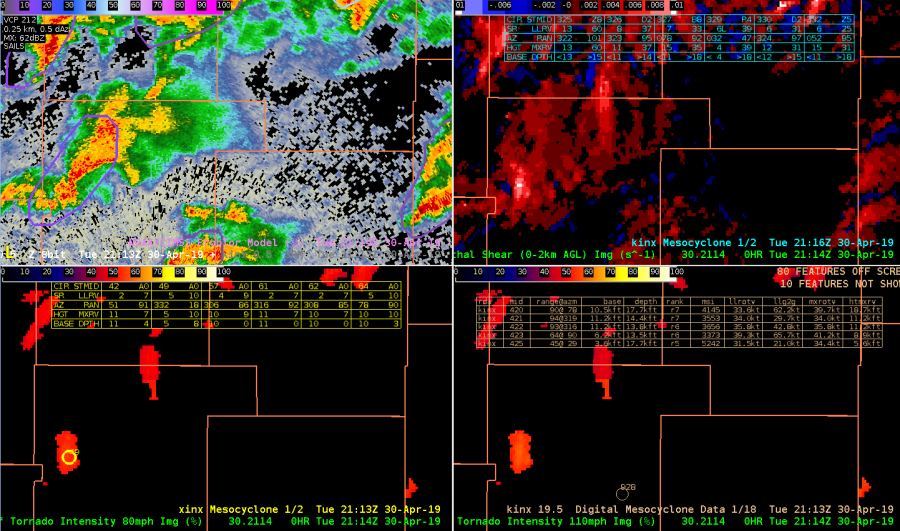
After merger @ 2114 UTC although not much change in AzShear, CPTI probabilities do increase some to 55 to 60%. Note that only the XDMD mesocylone algorithm displays a mesocyclone icon at this time while legacy DMD products do not.
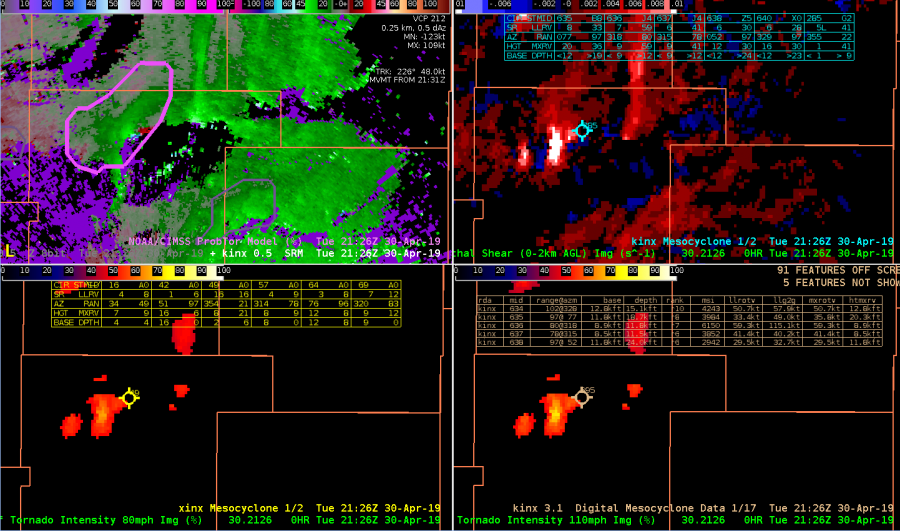
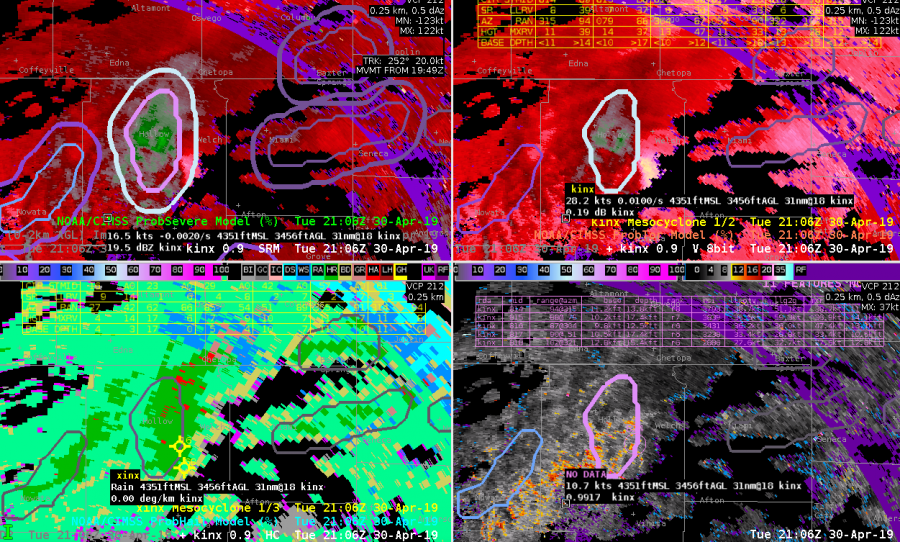
2126 UTC – ProbTor rapidly increased to 77% with marked increase in AzShear. CPTI products also near 70% (110 mph). Now all three DMD products display icon by this time. BUT the XDMD seemed to identify mesocyclone sooner than legacy products. This was encouraging.
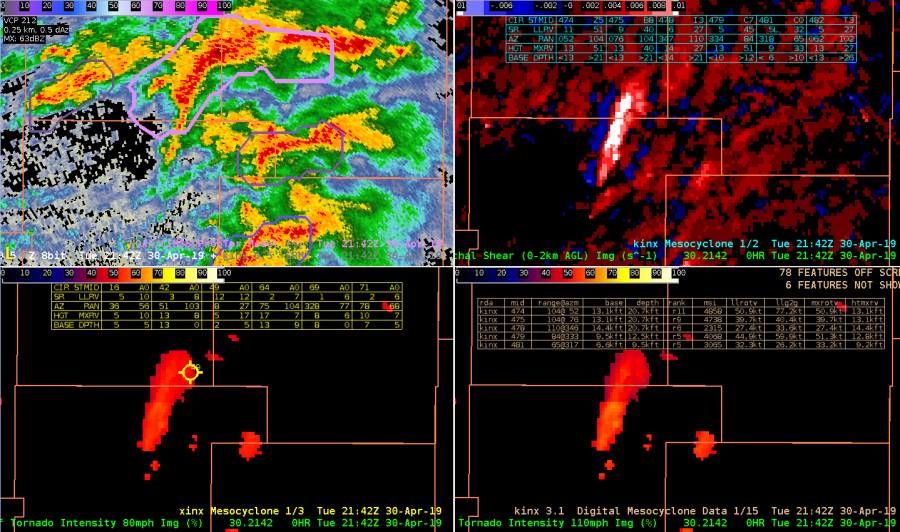
2142 UTC – looks like storm looses organization as inflow may have been disrupted. AZshear becomes elongated with CPTI values falling notably. Encouraging to note the character of AzShear (became elongated ) was consistent with the less organized storm (velocity structure). ProbTor falls to ~ 65%. Note the xDMD algorithm did still correctly identify shear couplet (SRM not shown) where legacy algorithm fails. XDMD performed much better and and had greater temporal continuity than legacy product in this example. In this more complex storm interaction example appeared XDMD was able to better identify and retain areas of shear/rotation compared to legacy.
-Quik TWIP
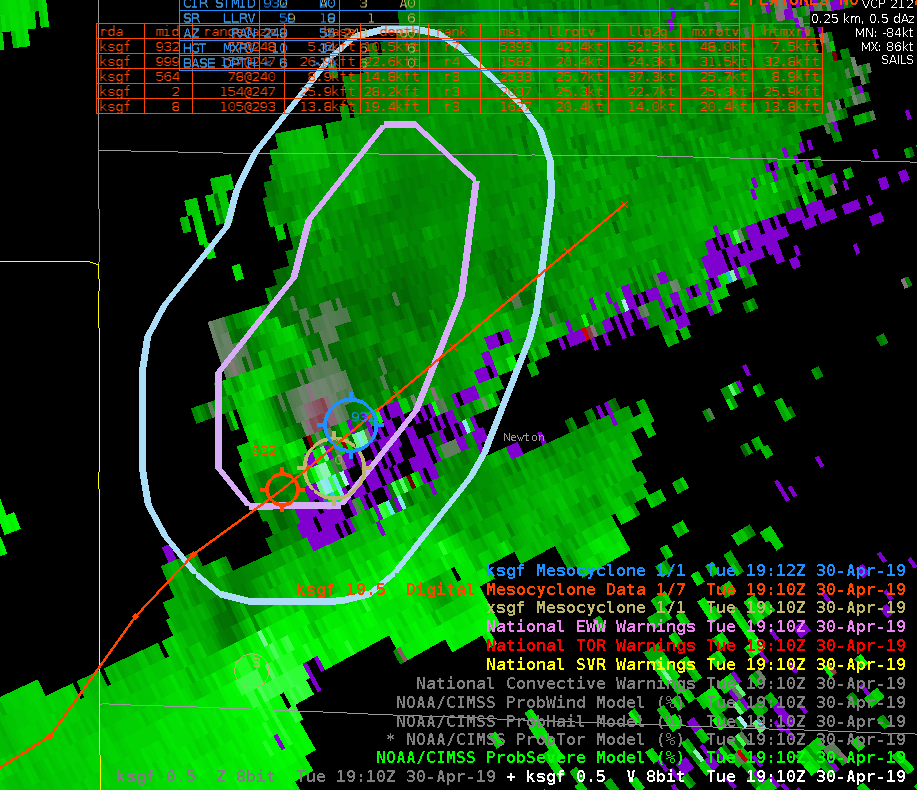
It can be a bit hard to see from the color scale, but take a look at the bottom left screen. The NMDA is shown there. One thing that I have noticed about it is it was able to better track the Mesocylone compared with the normal one. However, I have not gotten to test this extensively yet.
Notice in the time-step below that the NMDA is the able to hold onto the mesocyclone when the normal one cannot.
South Beach
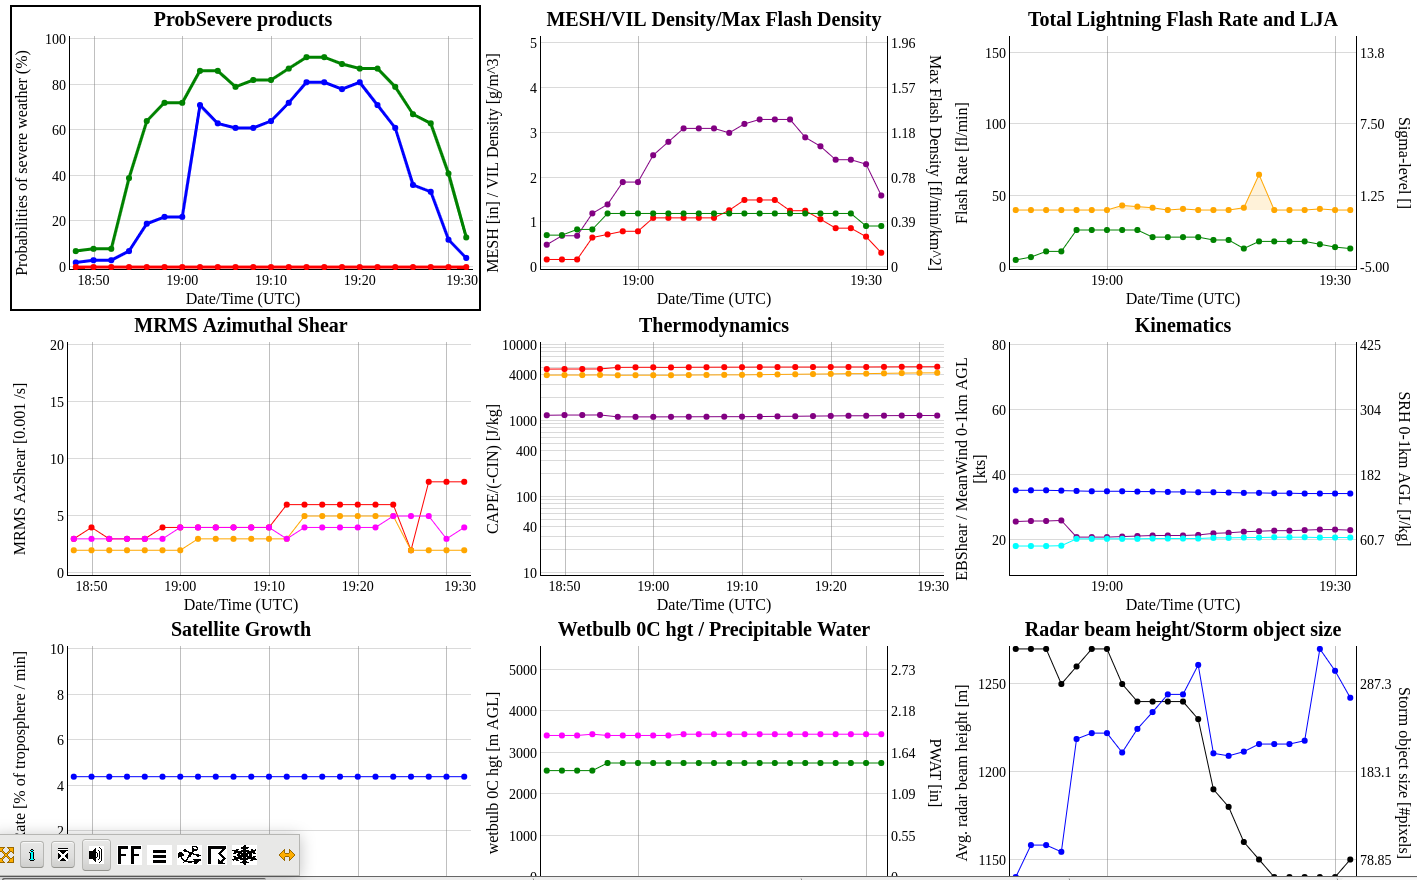
ProbSVR time series graphs with the online version continues to be one of my favorite for tracking trends. Uncertain how to display this cleanly in AWIPS II? – Jake Johnson