
 Graph of probsevere for splitting supercell discussed in earlier blog entries. These graphs are extremely useful to forecasters looking for trend analysis.
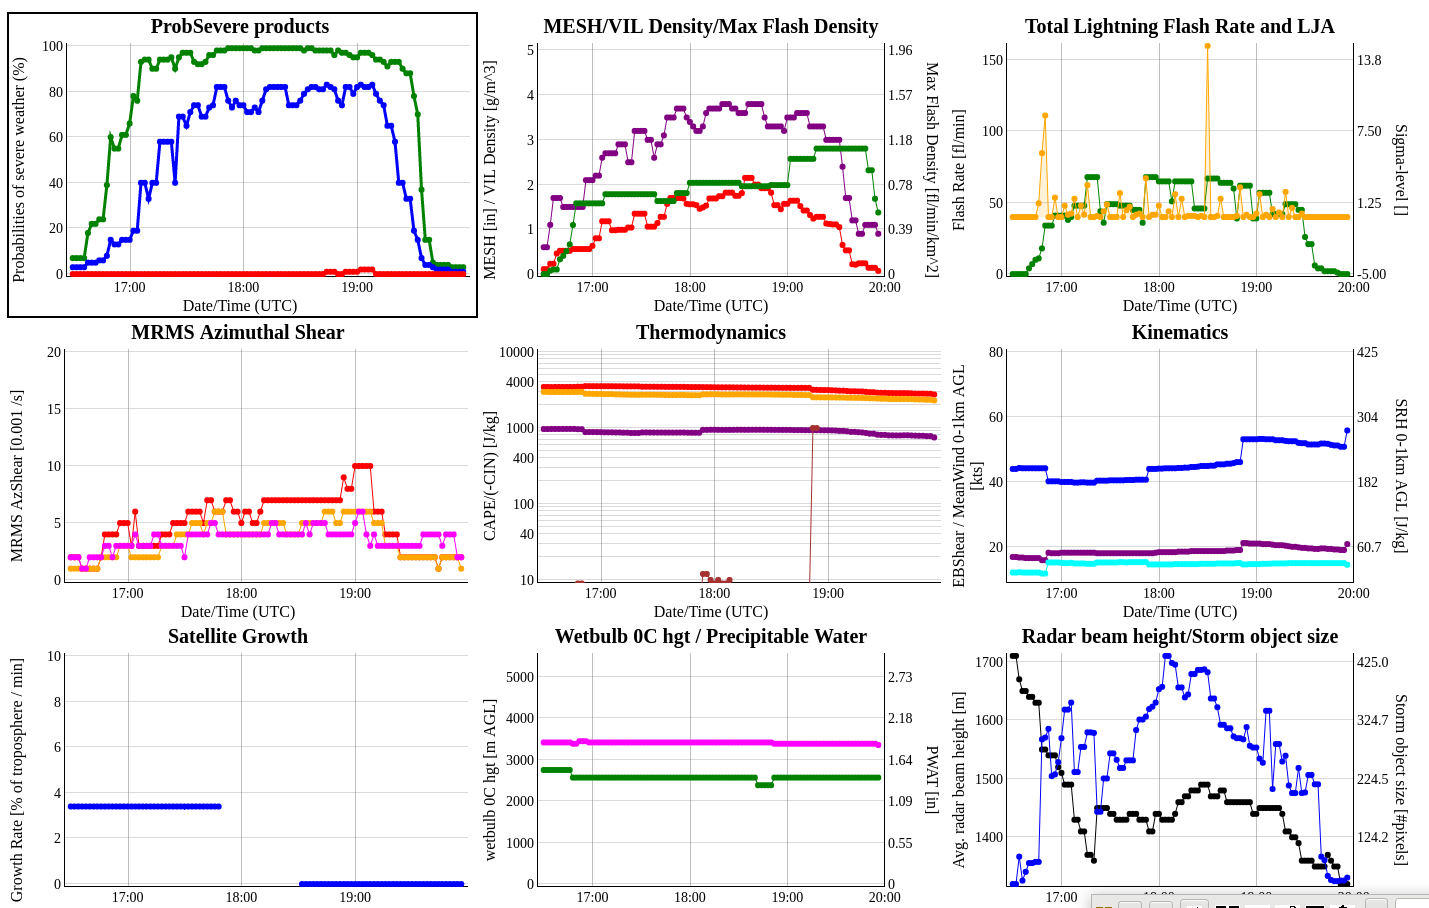
Possibly even more important could be their use in post-event analysis. For example, plotting lines on these graphs when LSRs came in, when tornadoes occurred, can give forecasters an idea of what the trends were showing in MRMS at the time of the impacts. The RealEarth viewer appears to allow you to view these graphs from object IDs back about 24 hours, however only the object ID shapefiles are available before that in time. It would be very useful for forecasters to have access to these time series plots for post event analysis – perhaps consider making them available for any object IDs up to a week old?
-Dusty