Another Marginal Day in the HWT

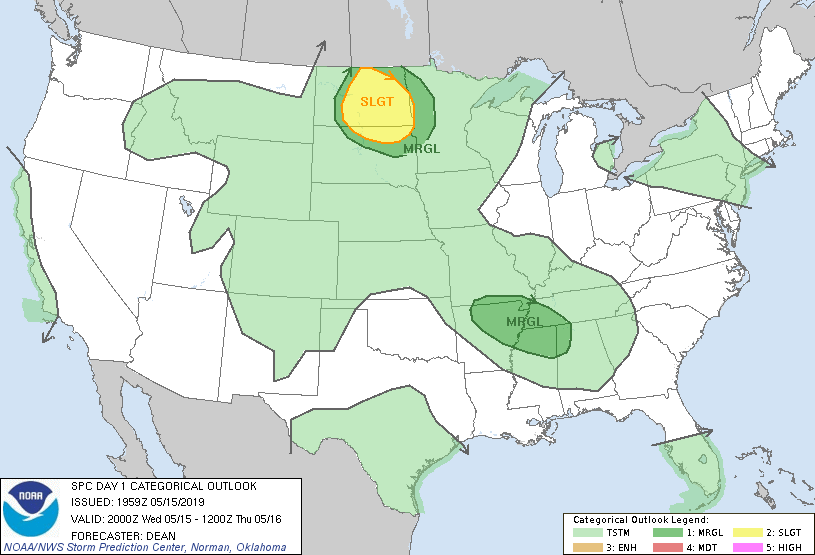
Continuing the theme of the week, today figures to be another day with few storms across the country producing some severe reports. Today we are operating across the slight risk area in North Dakota in the Bismark and Grand Forks CWAs where convection should initiate across central North Dakota this afternoon and into the evening. A third group will also be operating in the Memphis CWA looking for redevelopment behind a morning MCS along a trailing outflow boundary which could produce some marginally severe hail and wind across northeast Arkansas and into western Tennessee.
-Michael
Tags: None

Single Radar Az Shear Long Case

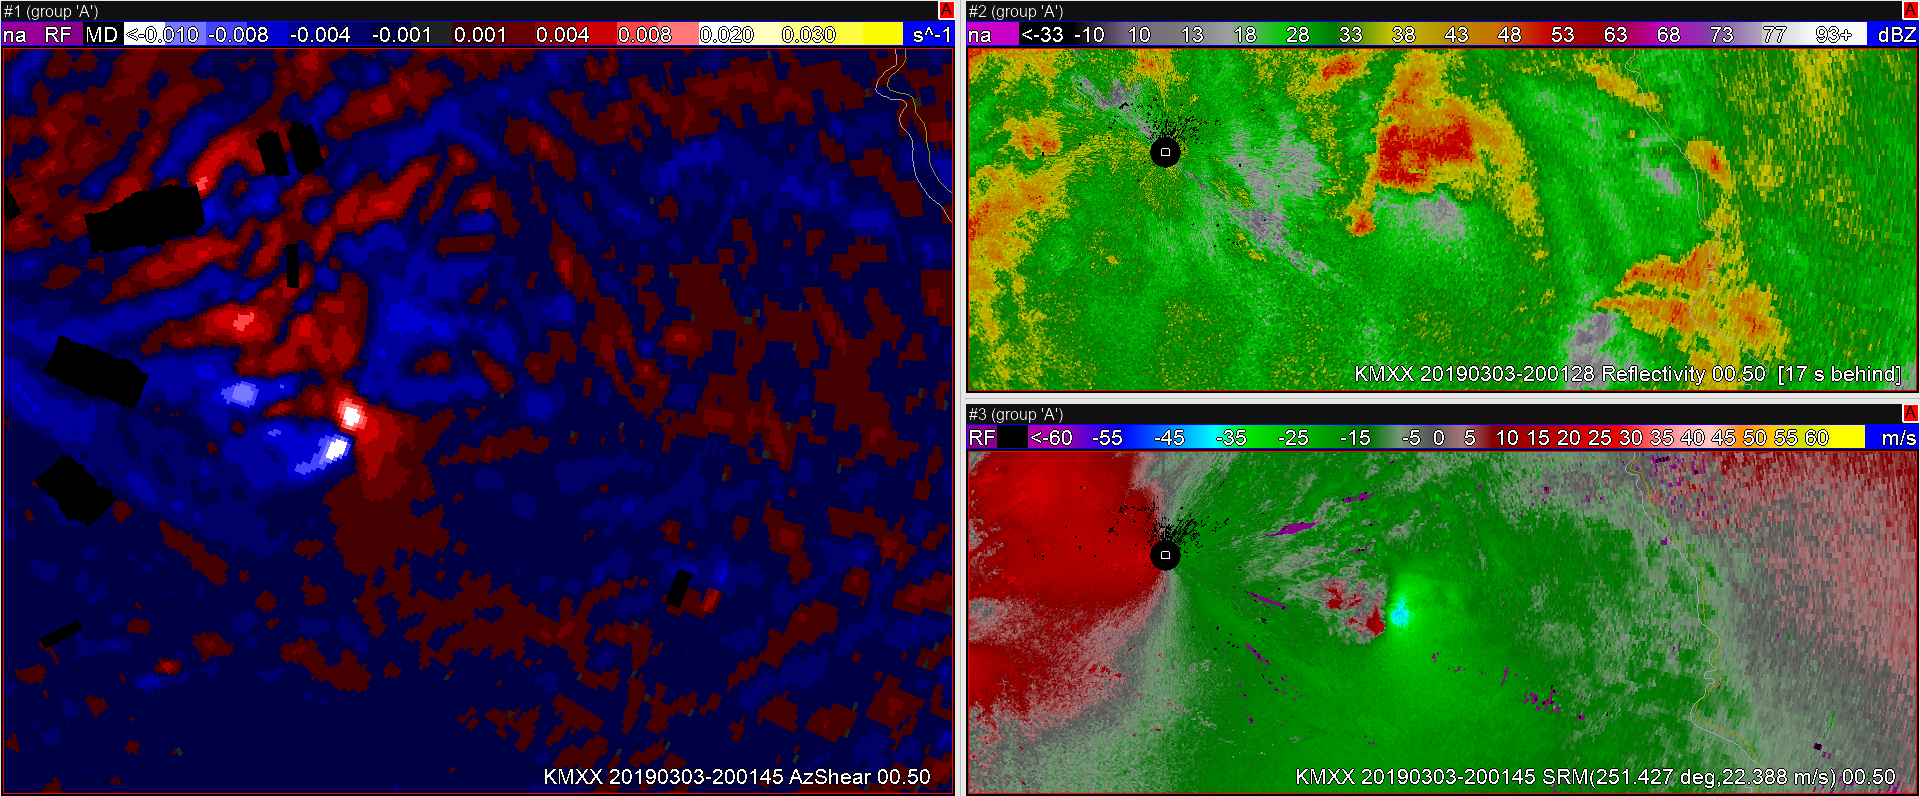
Just before tornado formation (as in just before CC hole develops) on leading discrete supercell, Az Shear product quickly ramps up in values and would be useful in getting warning forecaster attention that there is a strengthening low-level circulation there.


Stepping back and looking at the squall line, the Az Shear product quickly allows the warning forecaster to visualize the s curvature in the squall line, and quickly isolate the central segment of the squall line that is becoming more favorably oriented with the environmental shear. Here I was able to more quickly focus attention on the segment of the line that would go on to produce a tornado.


A couple of scans later, the AzShear quickly trended up before true gate-to-gate couples appeared in the velocity product. This would help the warning forecaster get a jump on the areas of tornado formation.


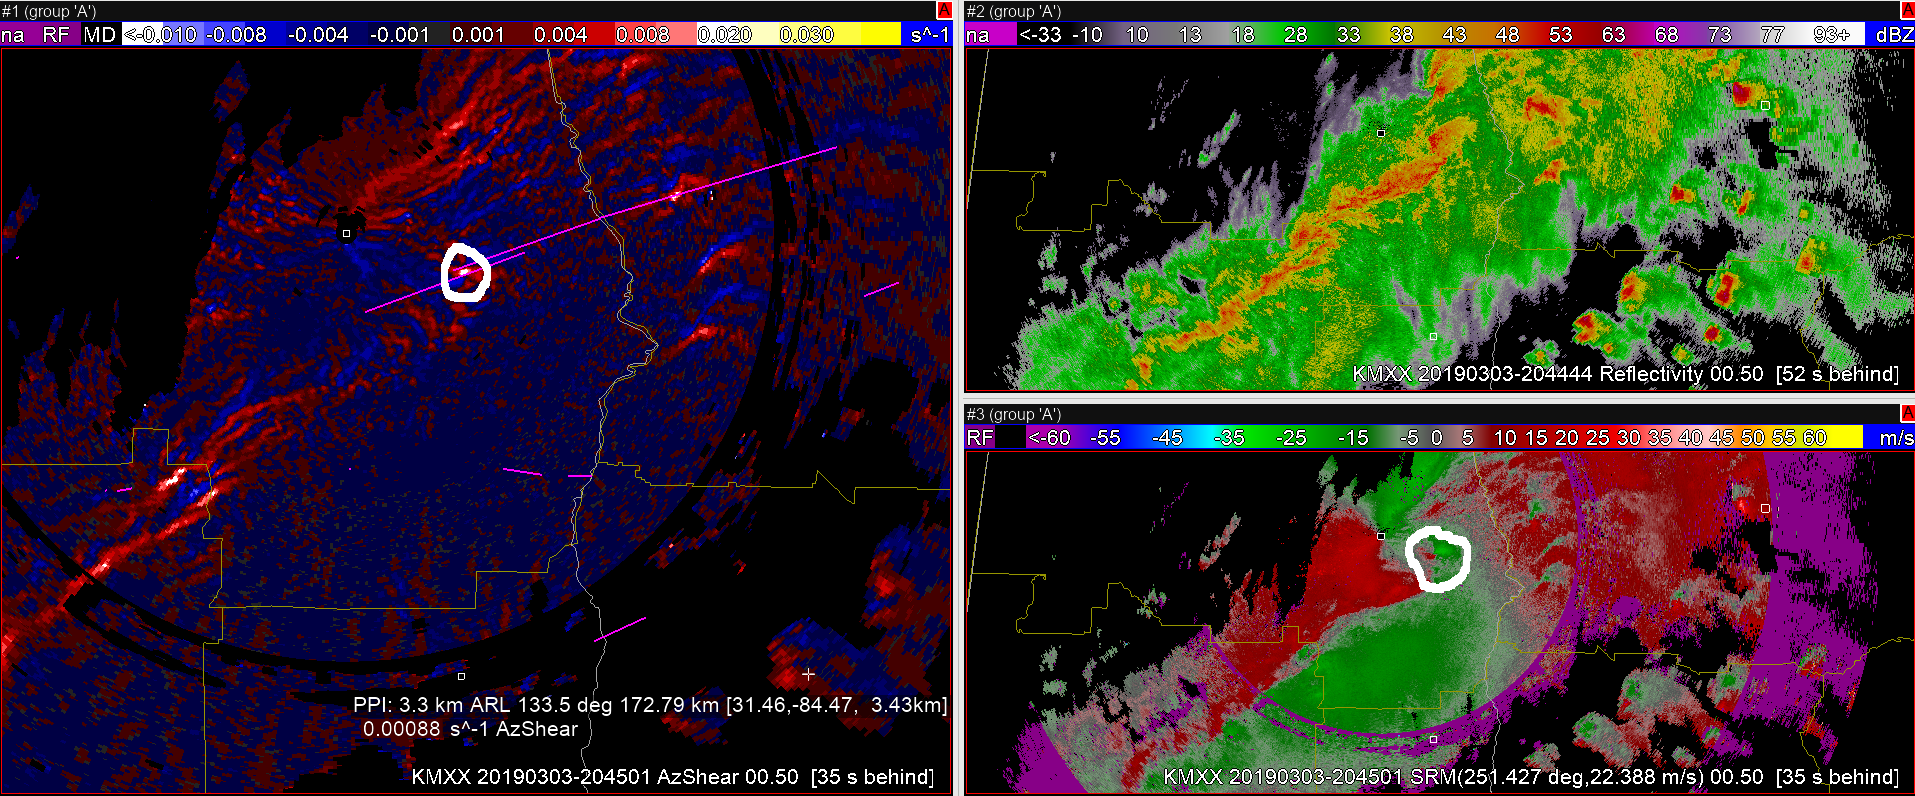
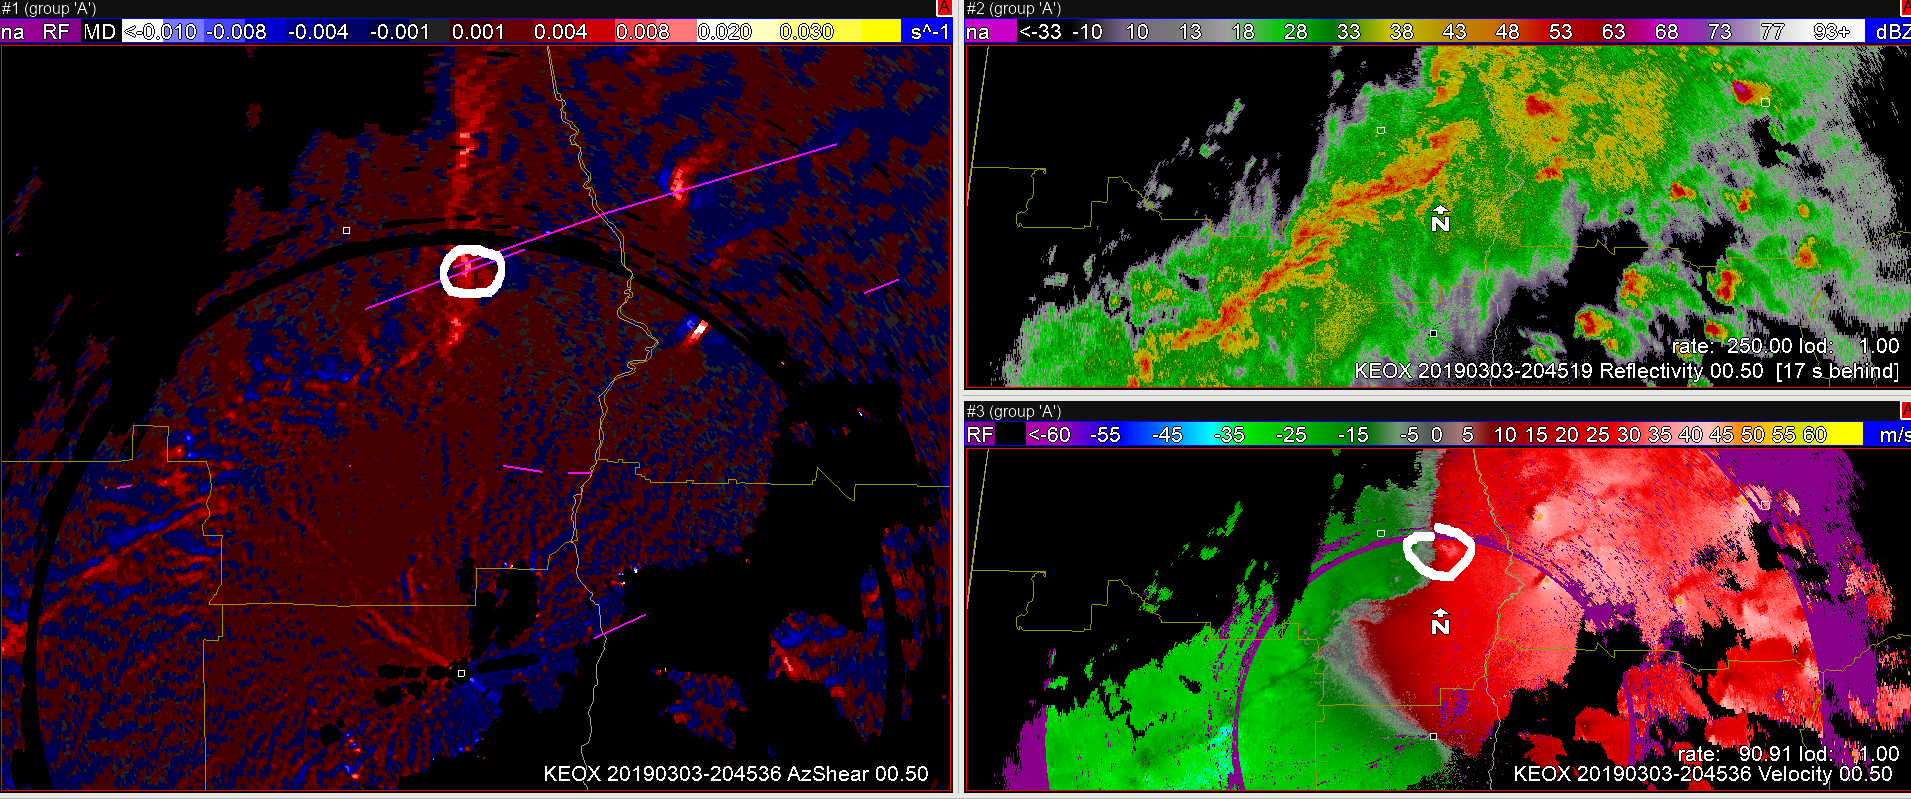
Viewing angle and distance from the radar definitely important. In the images below MXX is much closer to a QLCS tornado and viewing from behind the line. While EOX is south of the line looking down the length of the line, and viewing from a greater distance. Here the low-level QLCS circulation is much more evident in MXX, while it gets lost on EOX. The area of interest is marked by the white circle on each image.


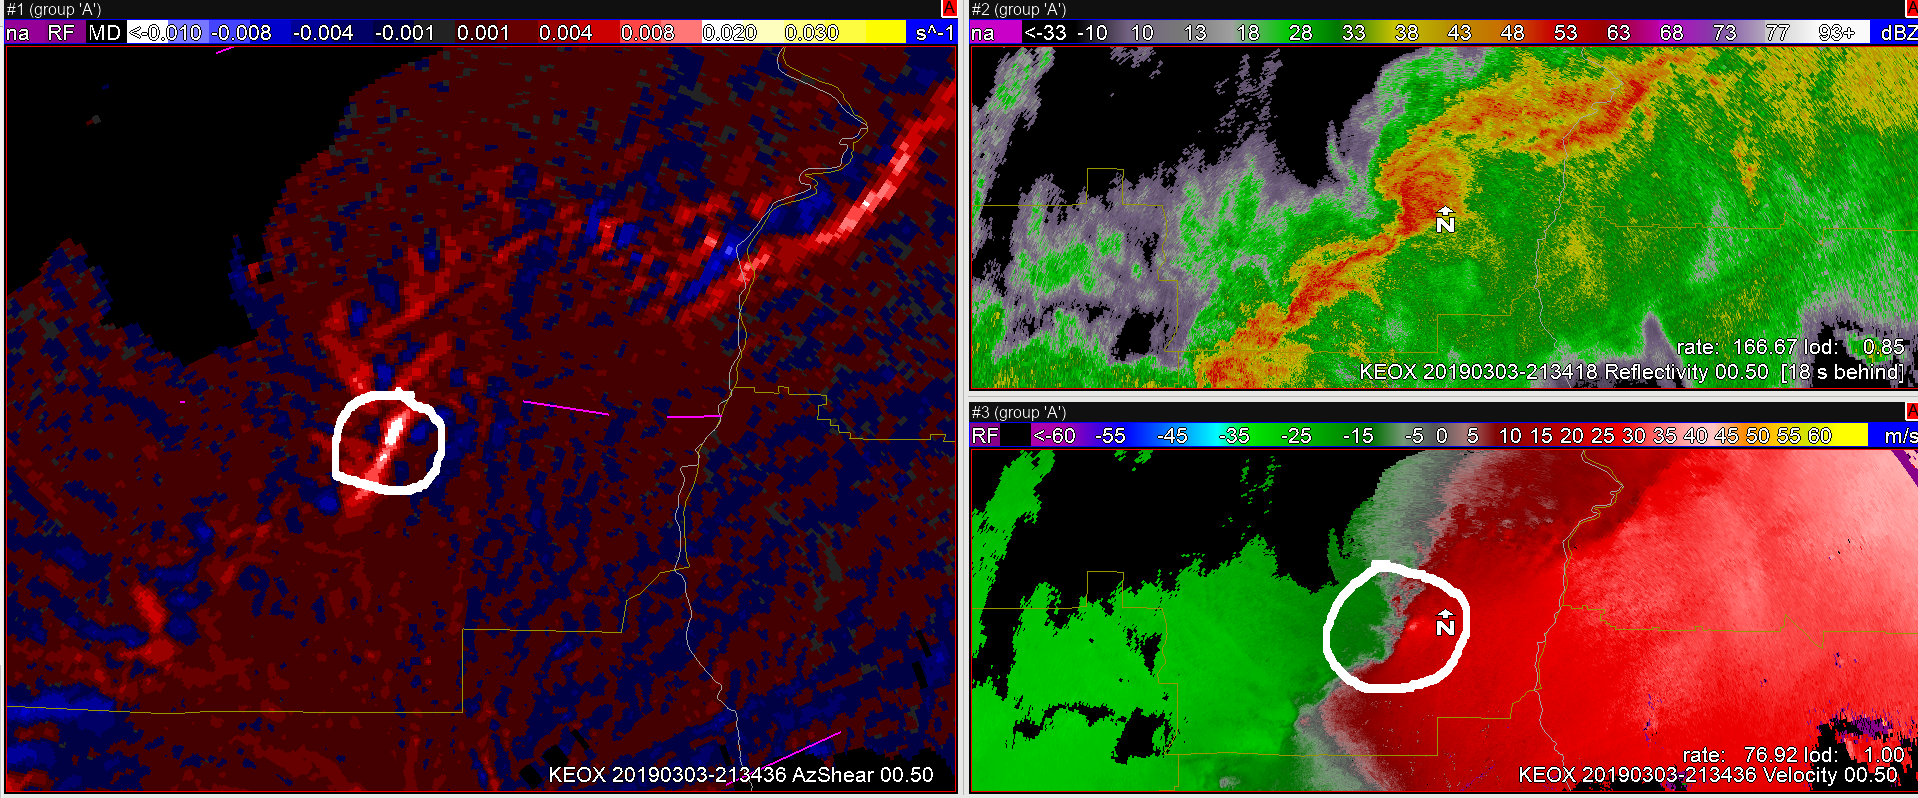
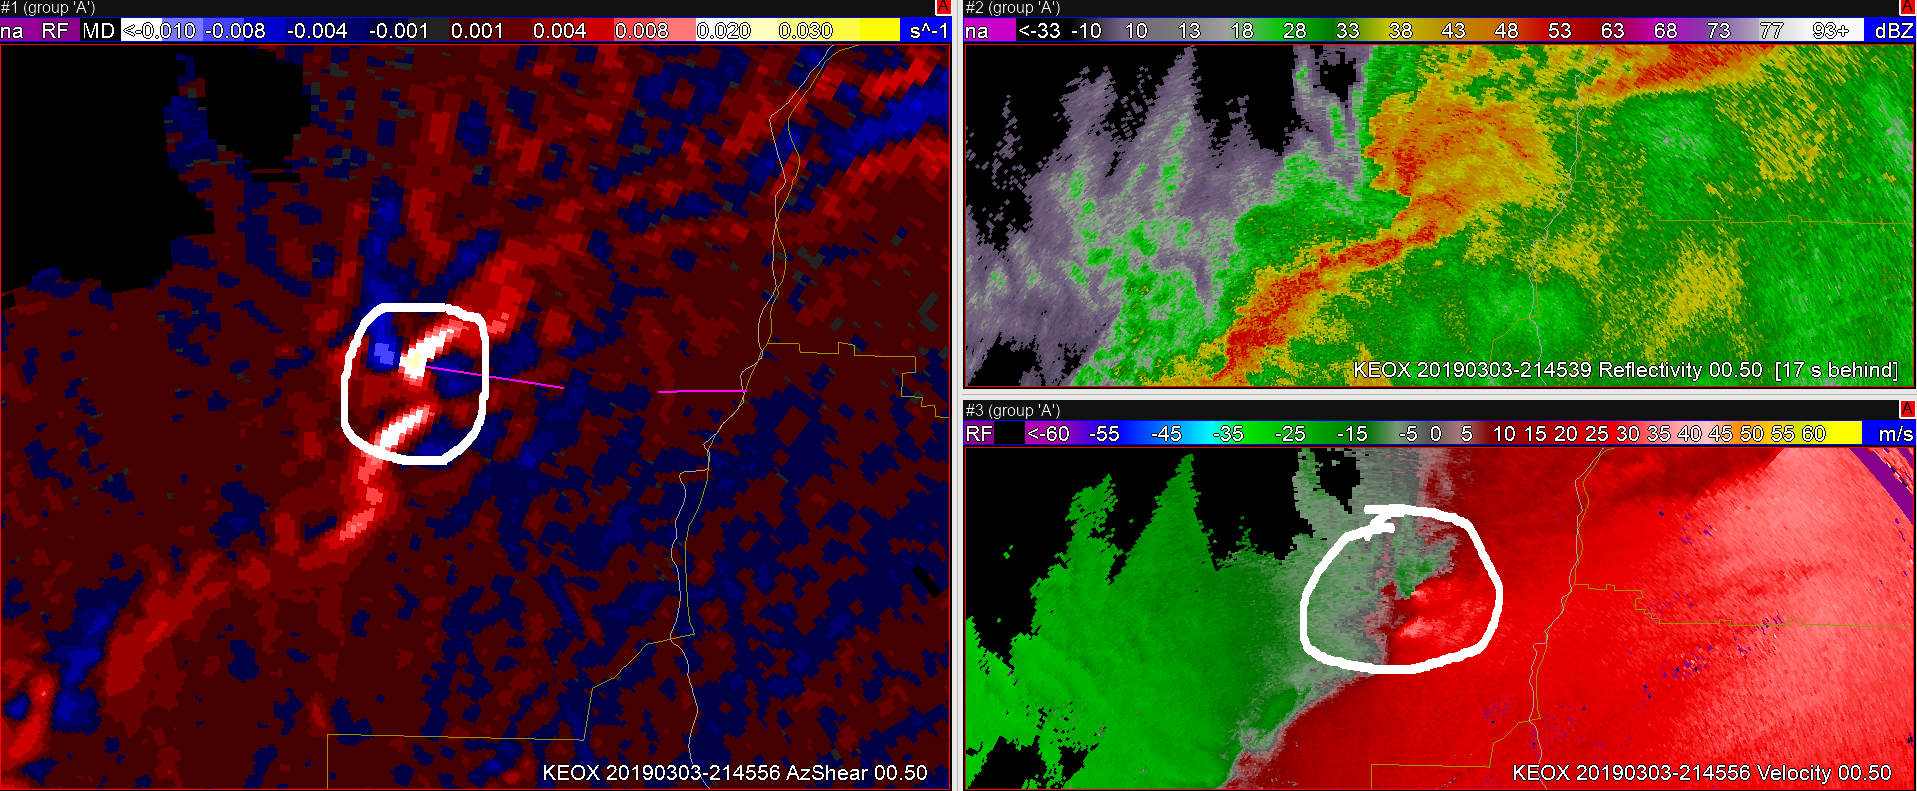
Felt the main benefit of this product may be for QLCS tornadoes, and could extend warning lead time. In the example below, a mesovortex along the line is more easily identified by viewing the AzShear product over the raw velocity data. This will allow the warning forecaster to more quickly identify the important areas along the line that will need monitoring. By expanding the color table at the top end of the color curve, it was easier to monitor the trends in the strength of the circulation. This combination could allow the warning forecaster to more quickly identify a circulation and start drawing up a warning while monitoring the trend of that circulation as input to the warning decision. Overall feel this could really help forecasters extend warning lead times on QLCS tornadoes by a couple of volume scans. This is a huge help as these tornadoes are already the hardest to warn on with lead time.

— warmbias —

Orca Likes His AzShear

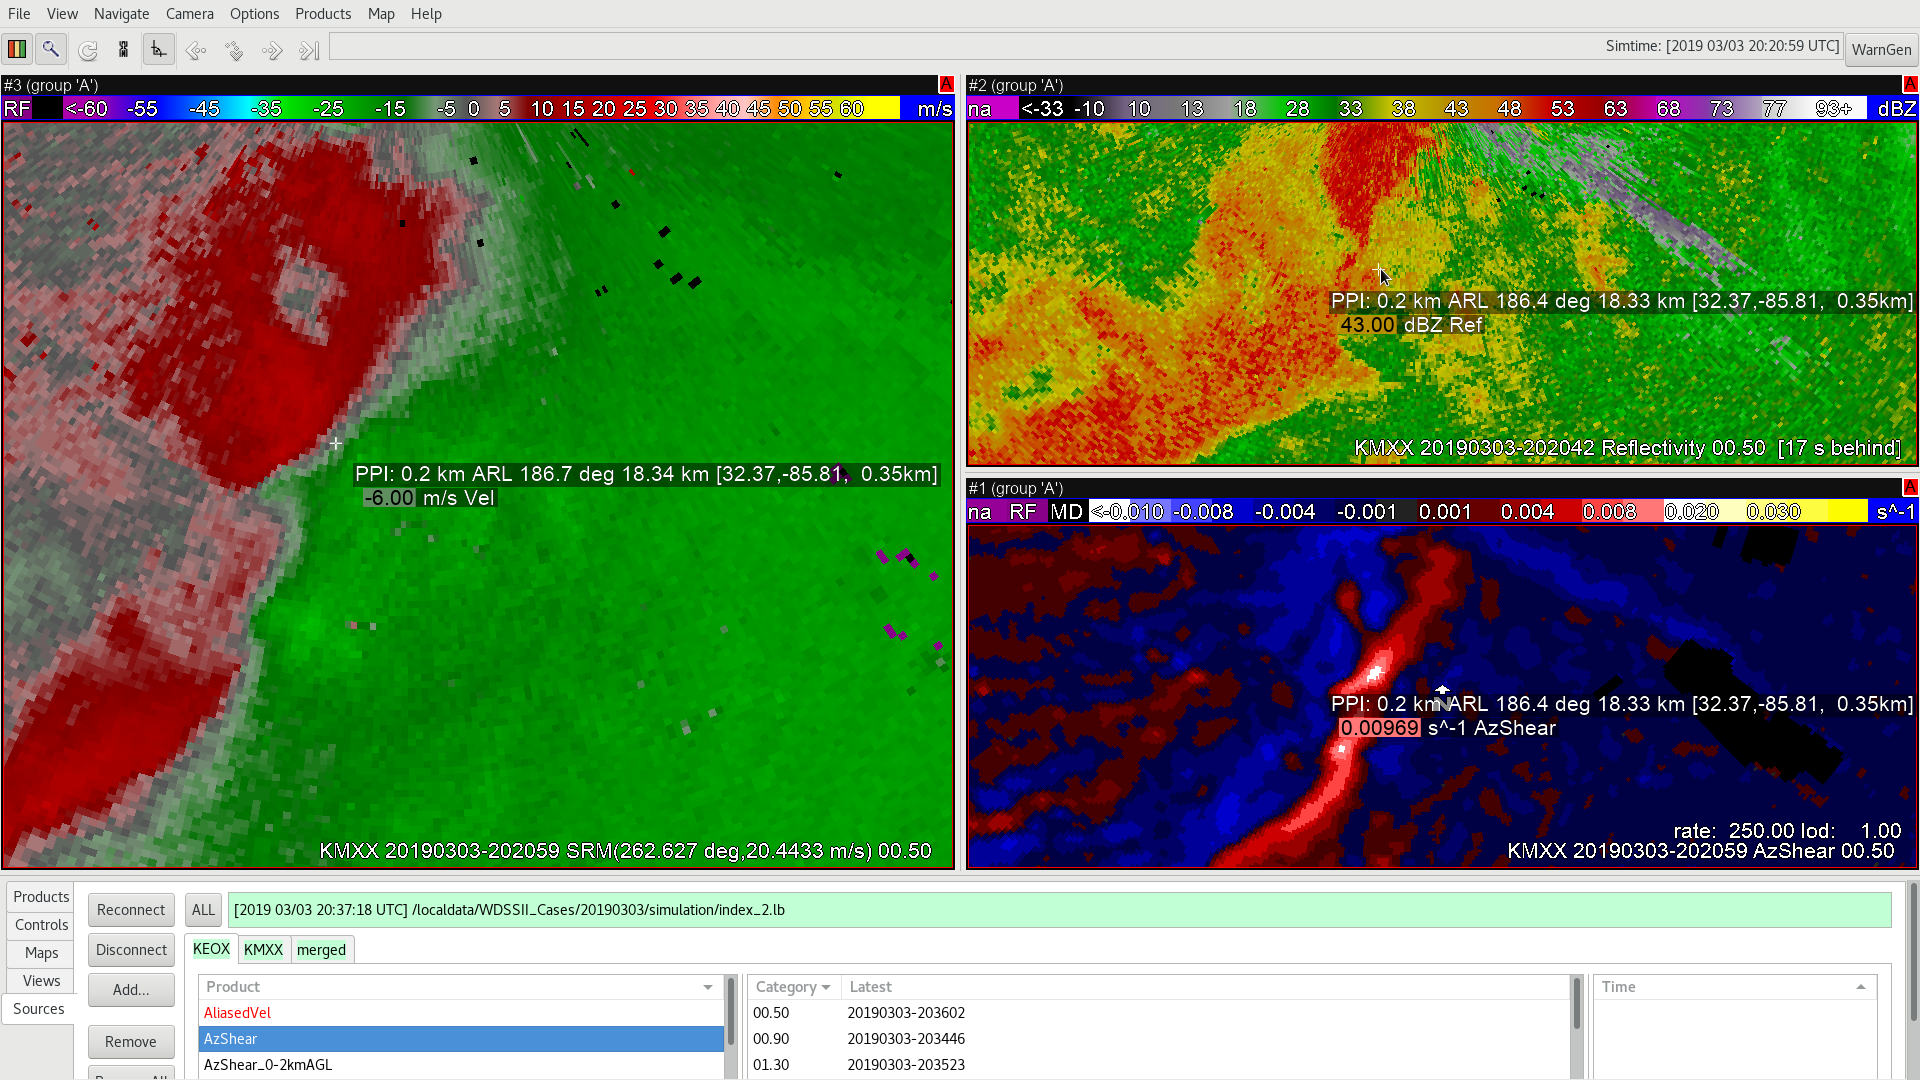
On MXX the Hook, Strong MESO, and TVS from 1950-2008, with the cell heading N of Phenix City,  the products  lined up really well with AzShear and added confidence in locating TVS and projecting track.  After 2008z on MXX new color scheme proved itself viable, highlighting the top end of the scales.

@2020z On MCV to S of MXX radar the forming TVS was caught about one-two VS earlier on AZ Shear than the Vel displayed any strong couplet

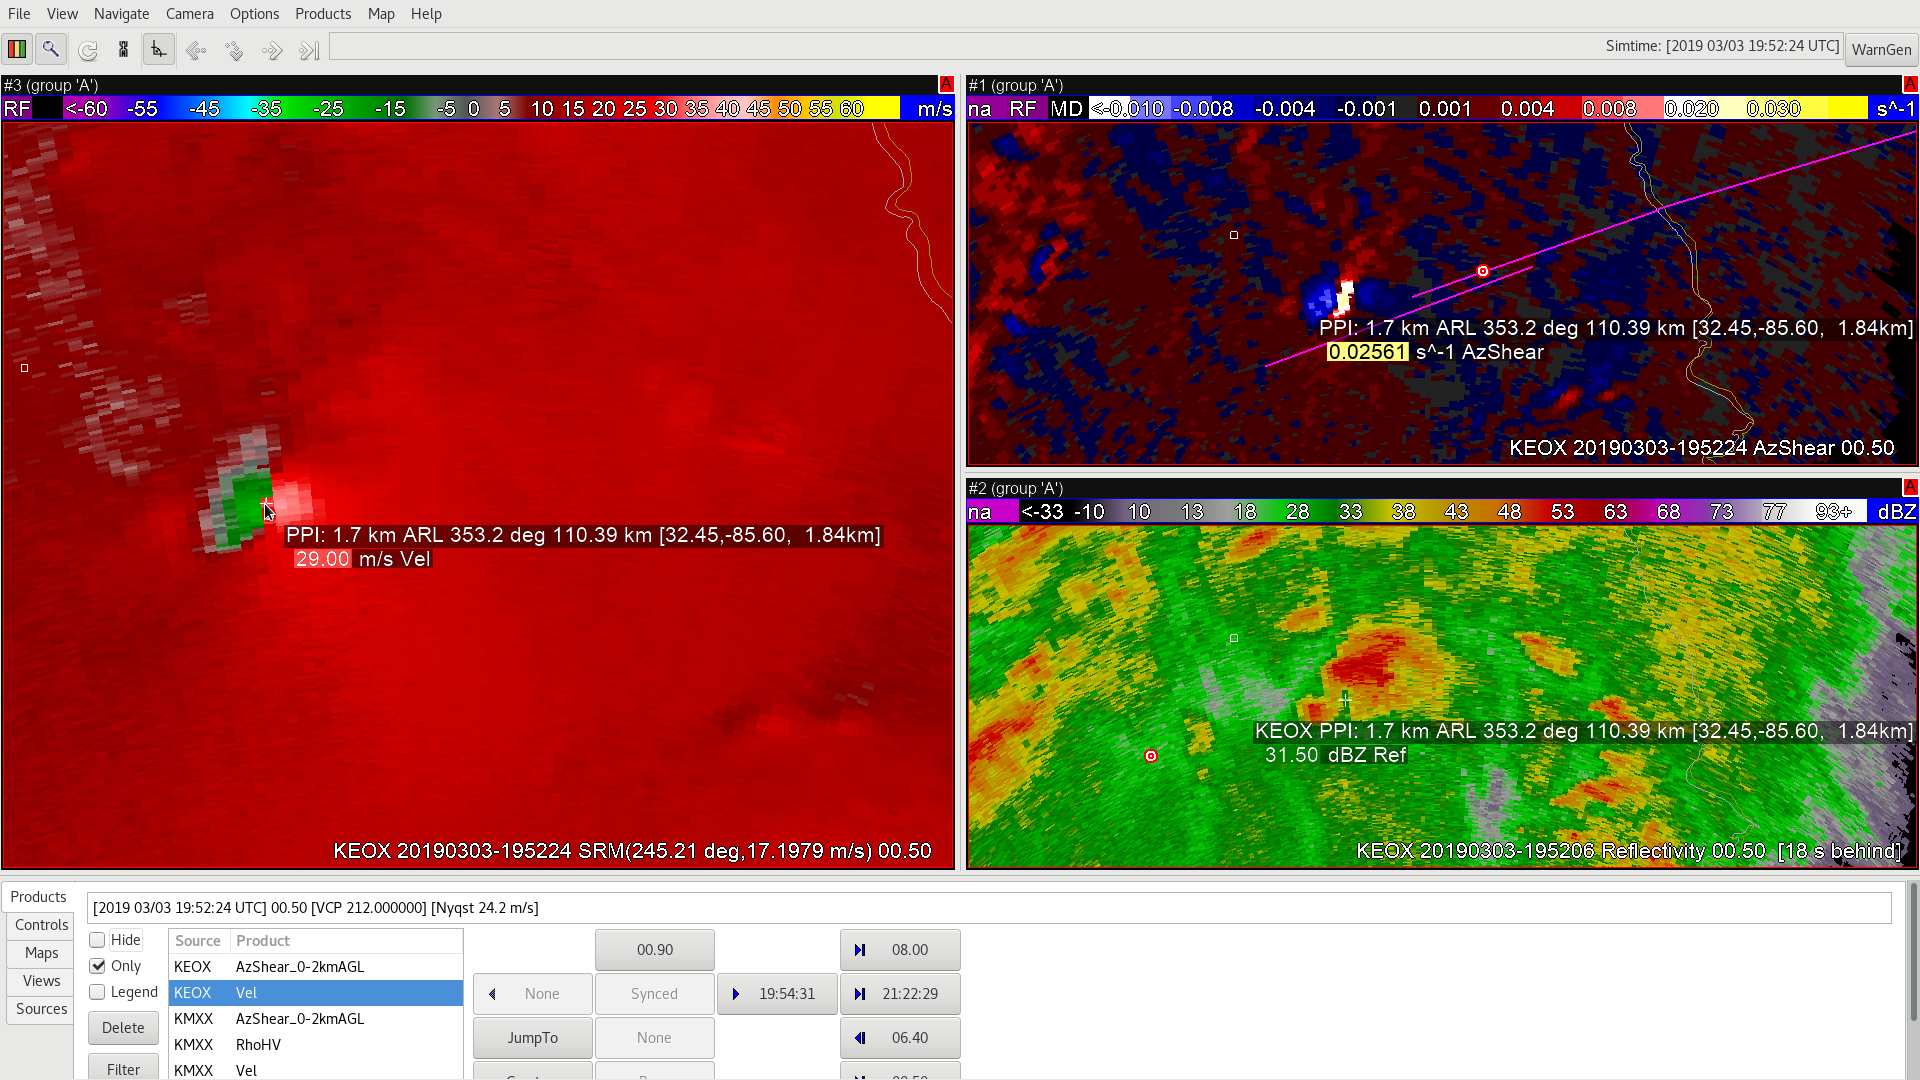
~ 2000z On a discrete cell ahead of the LEWP, AZ Shear had similarly stellar performance from EOX radar and high-end values lined up well with Hook, G-G shear and the tornado track

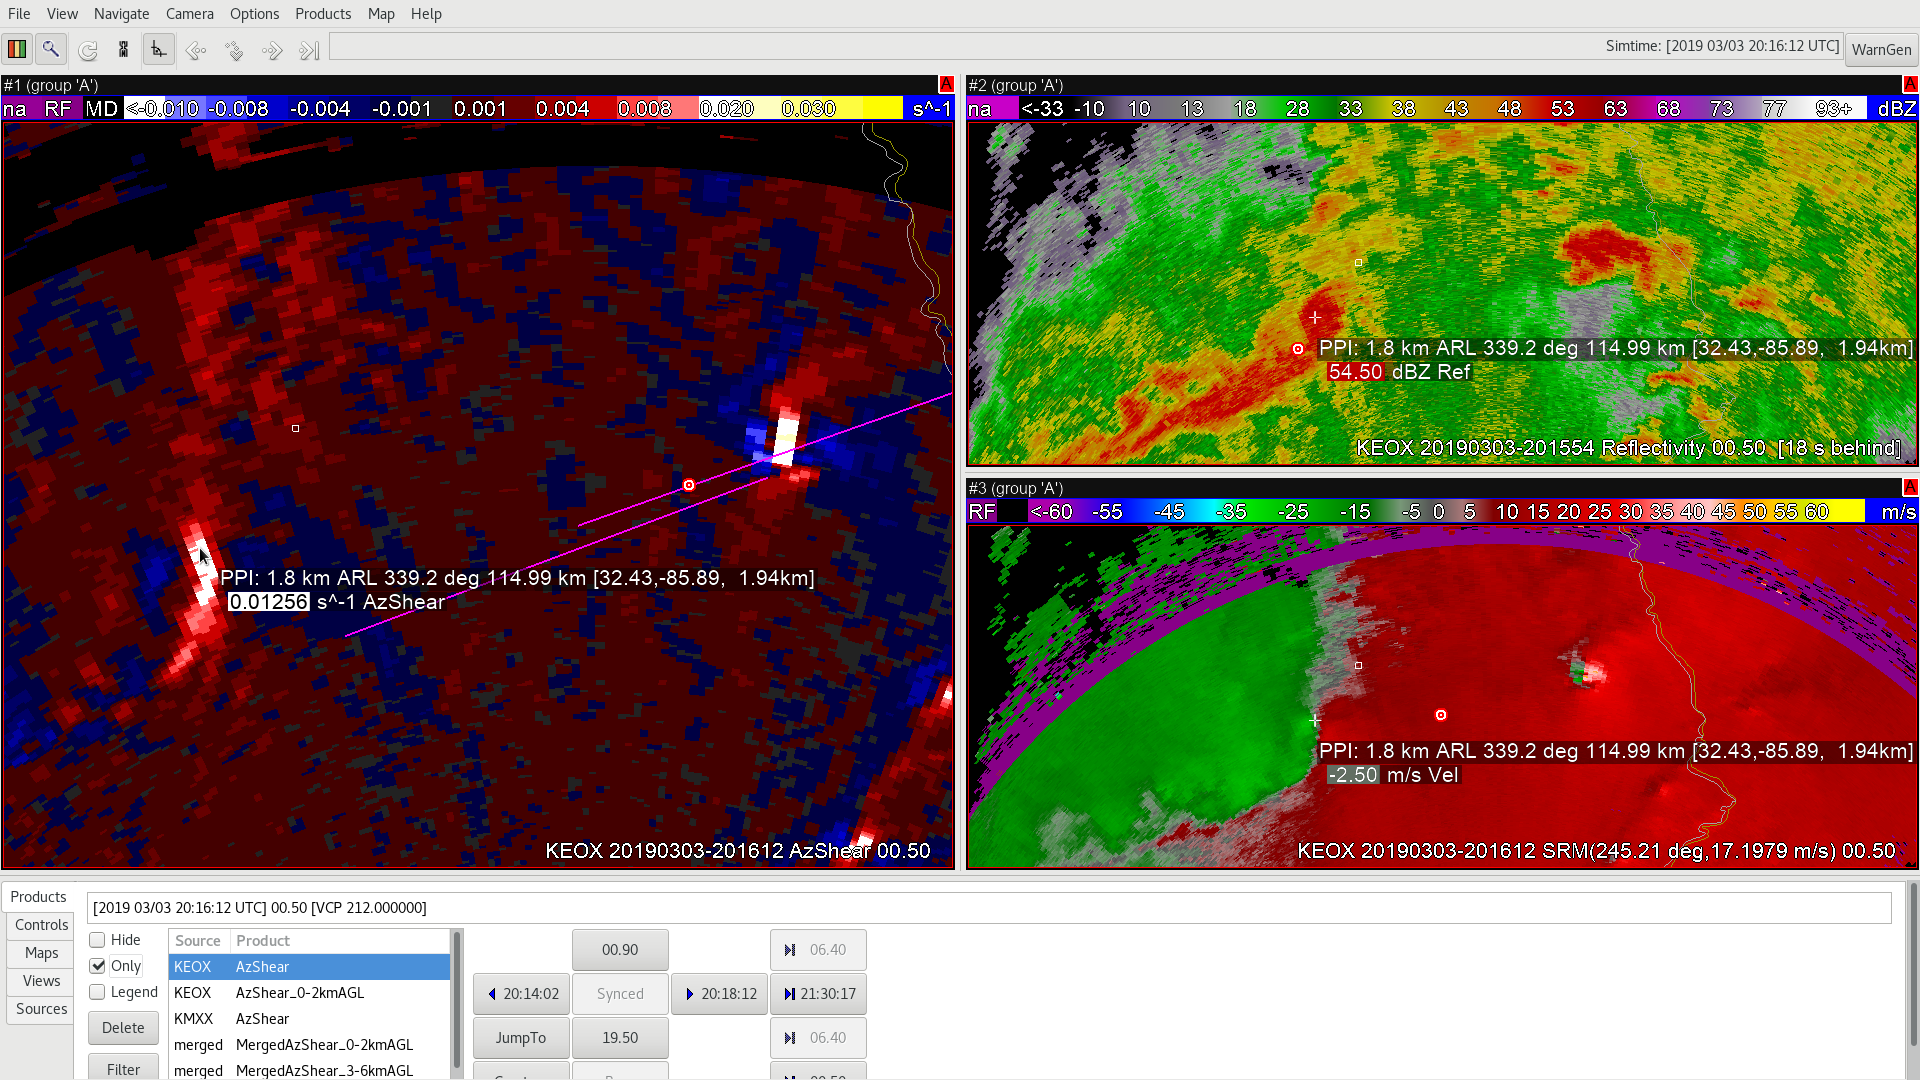
From the EOX radar the in the QLCS ~ 2016z, the AZShear did really well spotting the shear 3-4 Volume Scans prior to any exaggerated Ref/Vel signatures, this was impressive

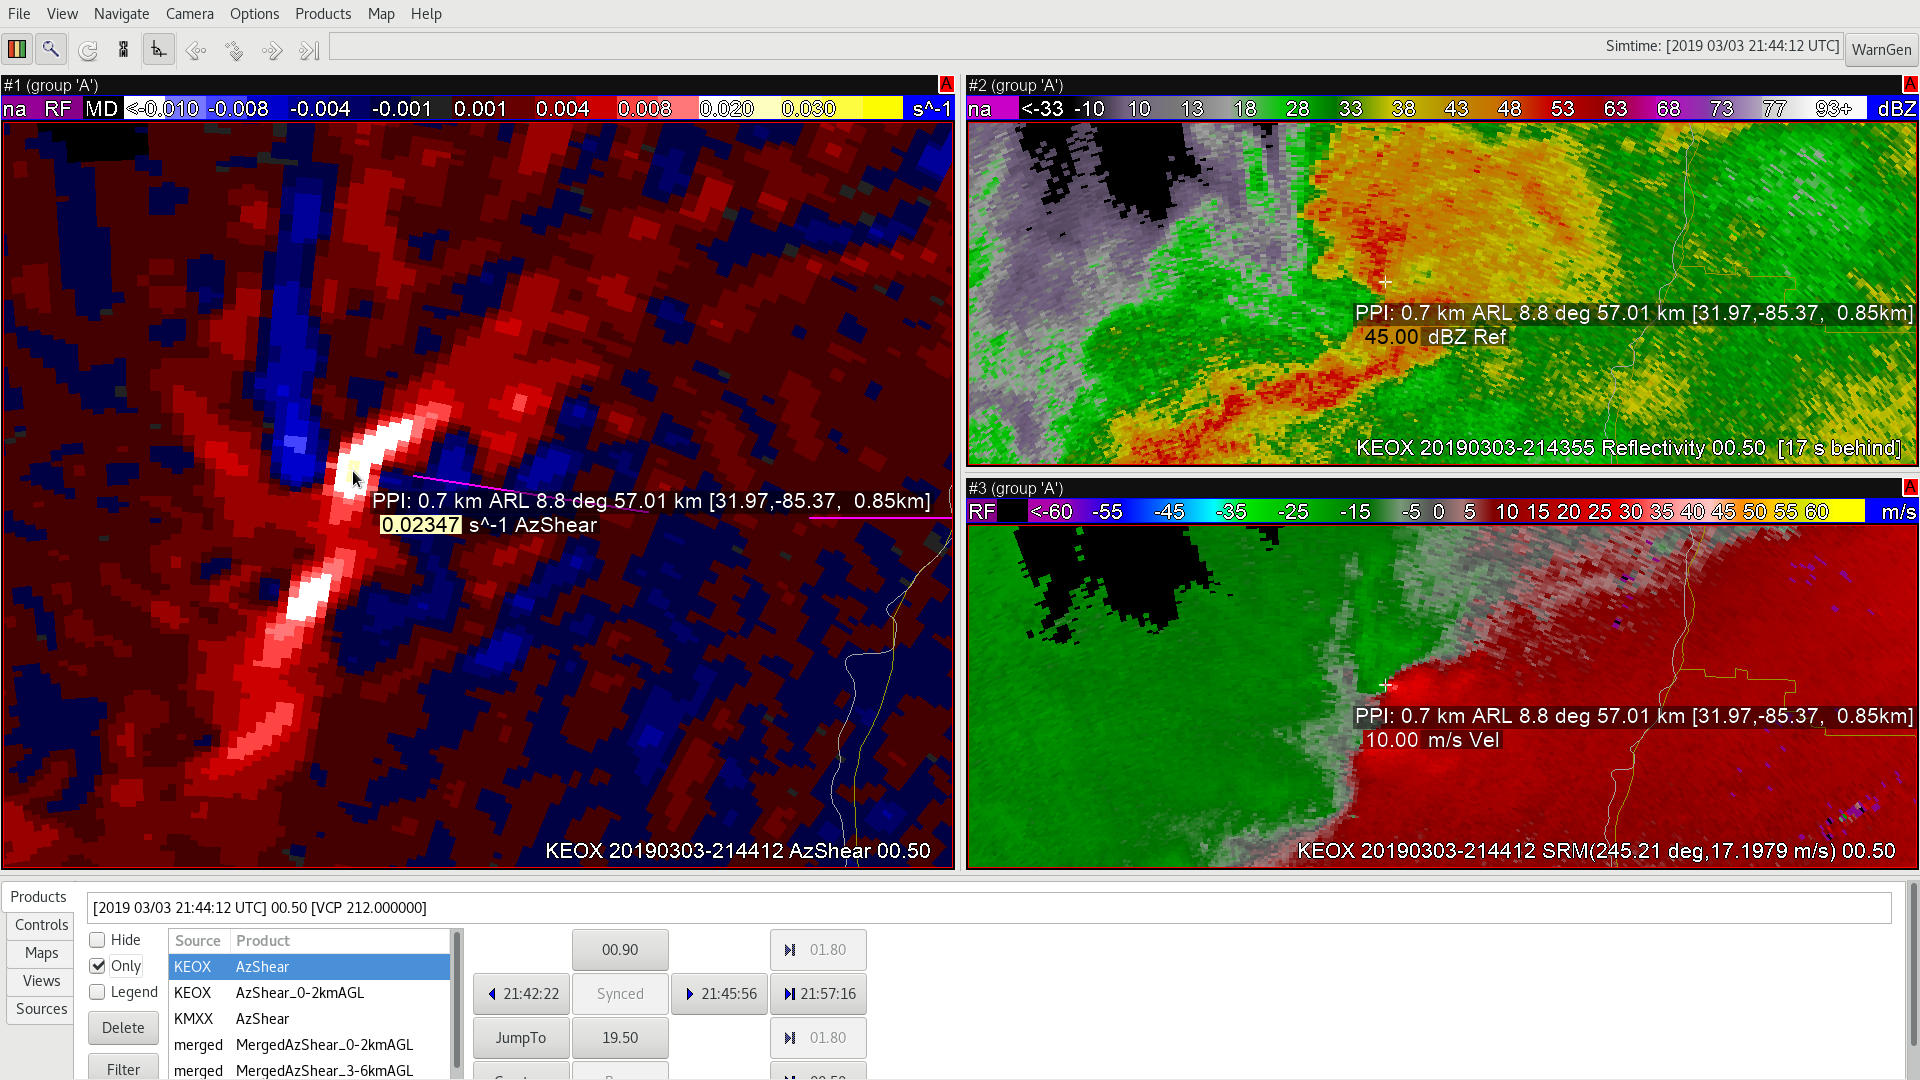
Another score for AZShear on QLCS FC track ~ 2140, several Volume Scans prior to touchdown, the new color table >.02 and no real definitive SRM or Reflectivity signature to help out!

I’d really like to see this product in the field, ASAP!!

Area Discussion Prior to Severe Wx Kickoff

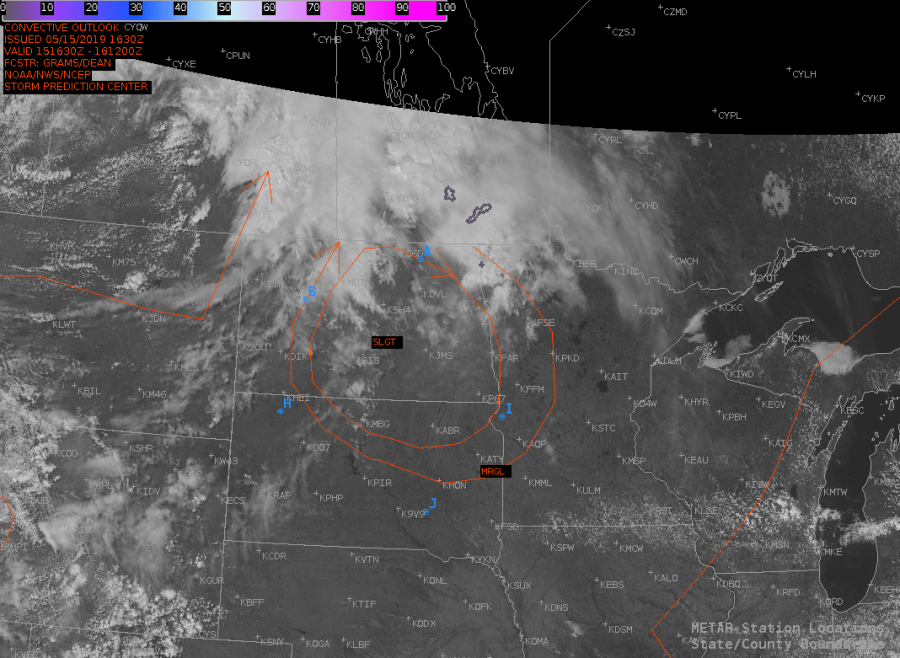
Area discussion for the Dakotas: Lower heights area located over western S Dakota and stacks from 700-500mb and will make its way easterly throughout the day. 850mb winds from the south at 30Kts.

METSAT shows low/mid clouds moving into ND from the west with clearing over the center of the states where wx is expected. Upstream surface observations support this clearing as they show dry air advecting into the area from the south.

Radar shows weak convective activity to the north moving into Canada. Models and the SREF are in agreement that the majority of thunderstorm development happen around 1-3z.

Merged TPW Composite total PW values over the center of the N/S Dakota states where convection is expected according to SPC outlook is less than 1” with values between .80-.95” and AllSkyLAP 900mb PW is even lower at .30”.

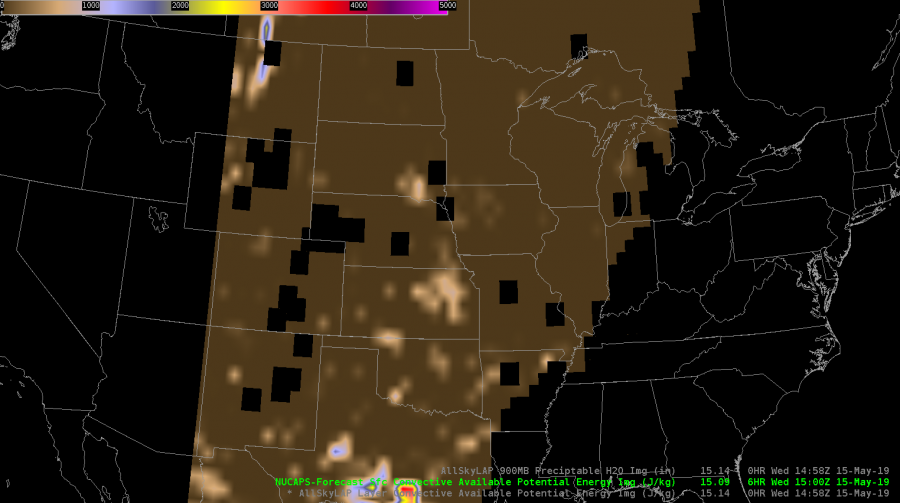
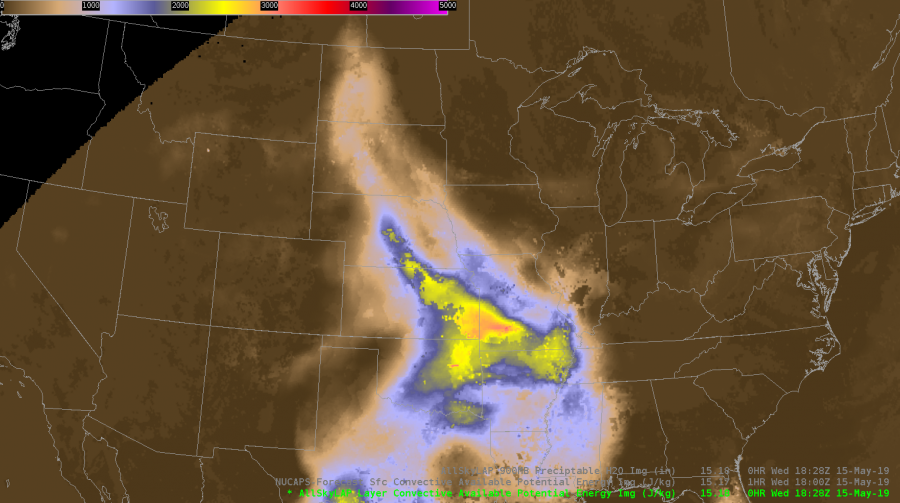
NUCAPS fcst Sfc CAPE overlay CAPE values range between 400-500/kg but there are quite a few gaps in coverage.

Meanwhile AllskyLAP CAPE shows 900-1500J/kg, and NAM models show extremely high CAPE values of 3000-4500J/kg.

Local TAFs show no thunderstorms or even rain while the SPC continues to carry SLGT over the Dakotas. It’ll be interesting to see how this scenario plays out as the day progresses.

–DESMOND–

ProbSevere

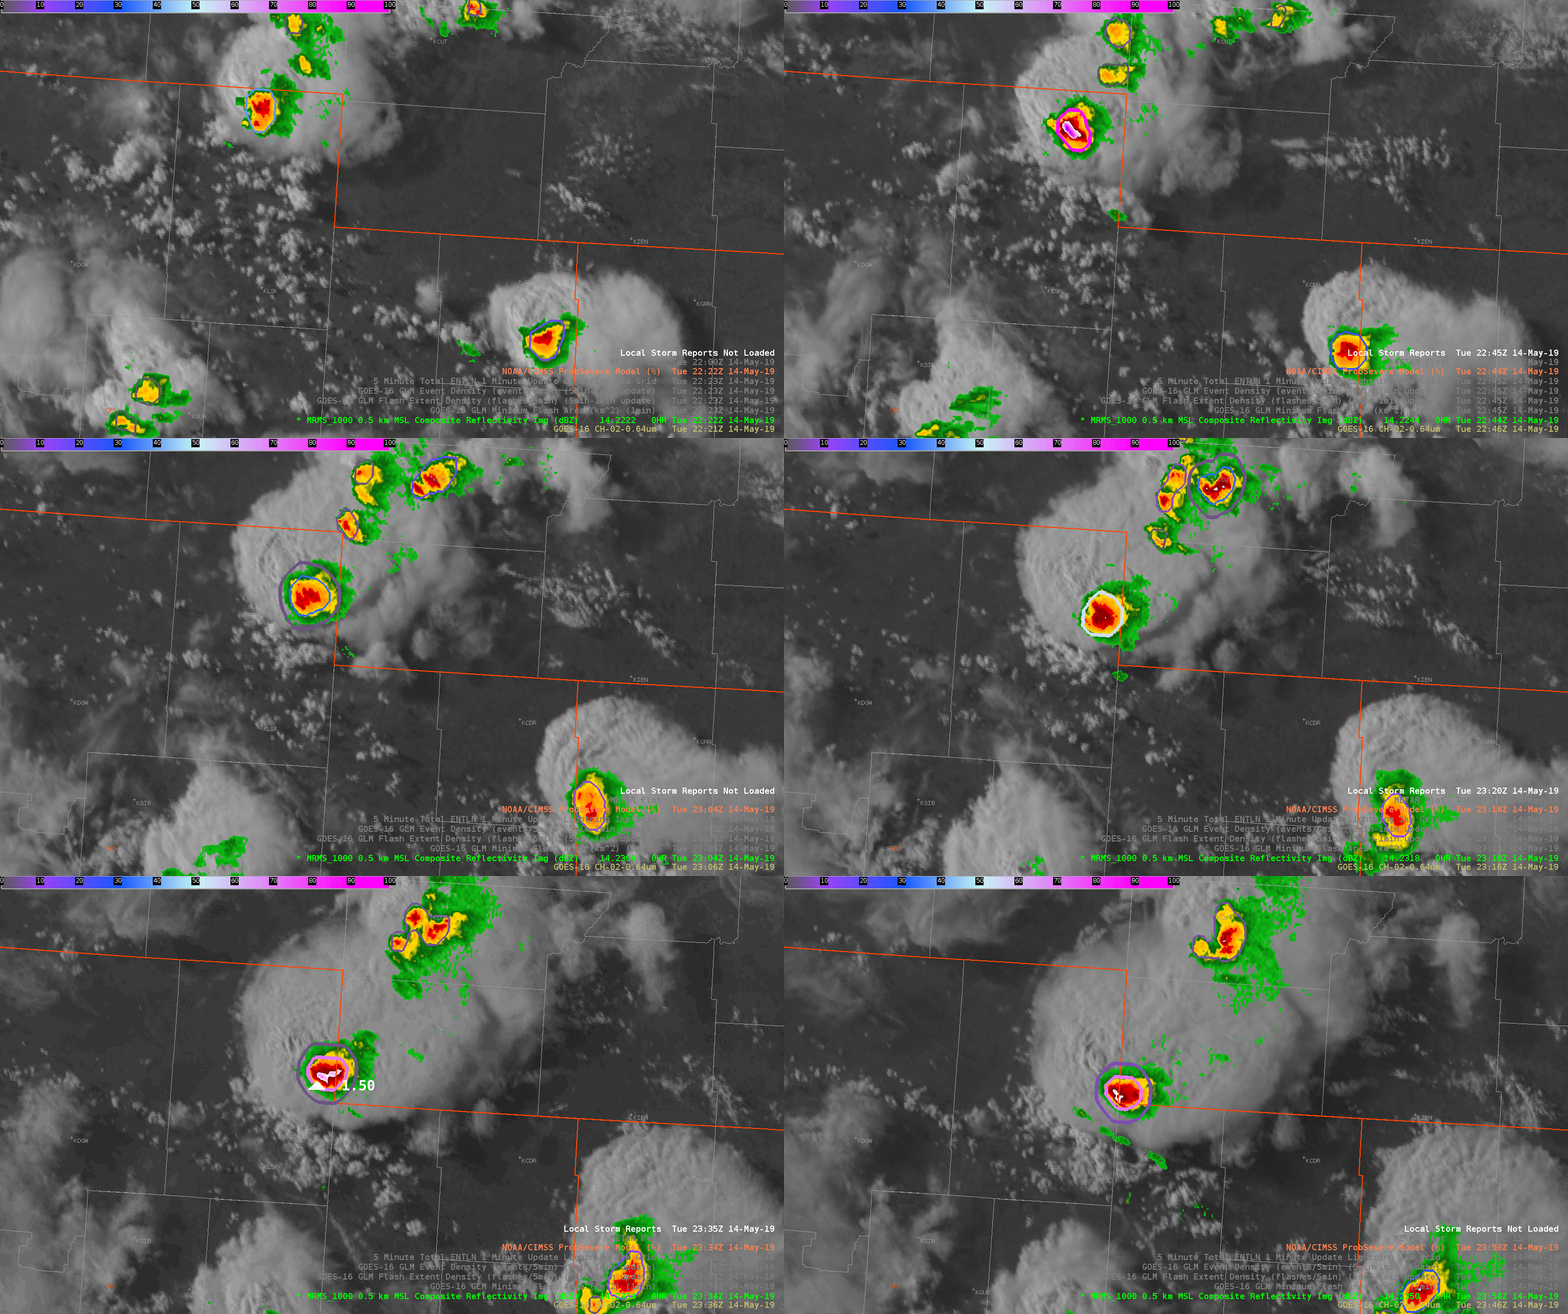
Overall impressed with the performance of Prob Severe today. Quick way to distinguish between weak/strong/severe storms. In this example from the high plains of Wyoming, there was an organized storm that Prob Hail spiked to 90% about an hour before the 1.5″ hail report, and remained at elevated to 75% at the time of the hail report. Don’t mind the low (3%) threshold for the ProbTor outline, as it is an easy way to keep that important piece of information quickly viewable by the warning forecaster.

— warmbias —

Mexican Severe Storm

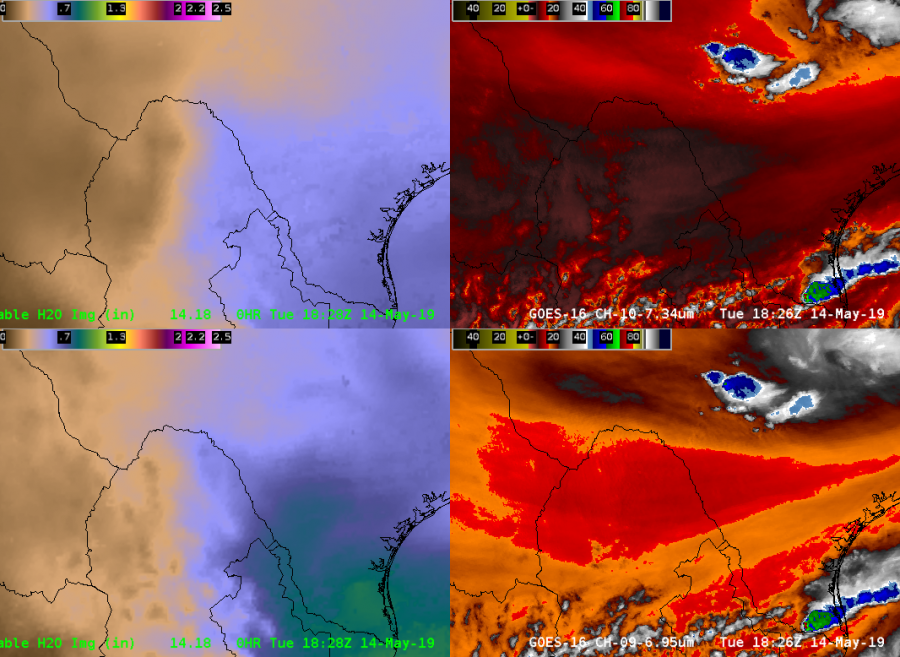
A strong low level moisture gradient showed up on the Sfc- 0.9sigma AllSkyLAP image early in the afternoon south of the Big Bend region in Mexico. This could serve as an initiating boundary later in the afternoon.

Low Level AllSkyLAP and Low Level IR/WV top, mid level AllSkyLAP and IR/WV bottom

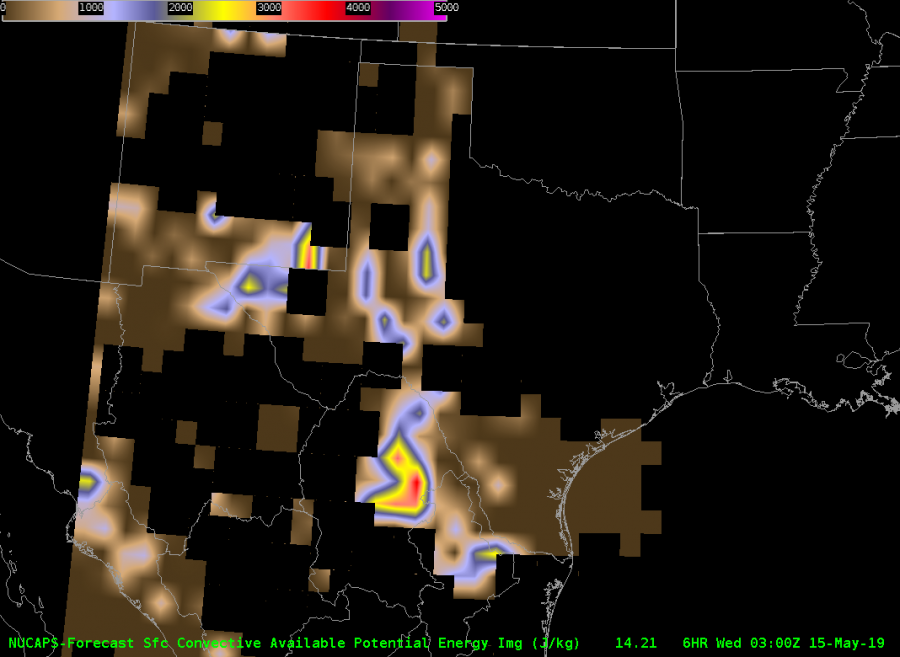
A look at the NUCAPS Forecast CAPE from the ~21Z pass showed over 3000 J/KG of CAPE at the 03Z Forecast hour. Earlier forecast hours (00-02Z) were missing data, however, if you interpolated between available data points, it seemed as though there was a maxima of CAPE in the area. It was noted that a storm developed around 21Z.

NUCAPS Forecast 03Z Forecast

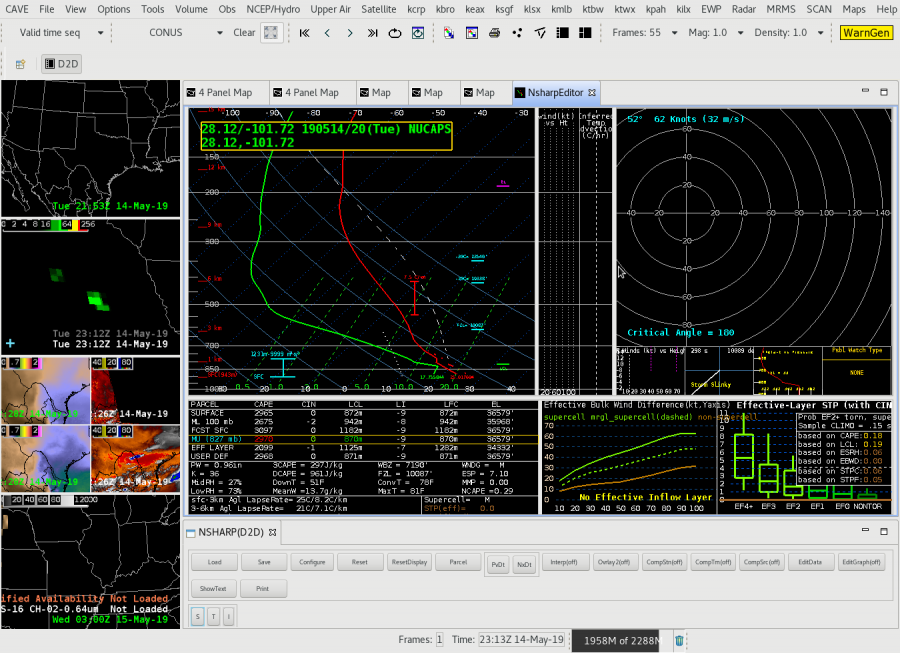
To gain more detail, I clicked on a NUCAPS modified sounding east of the low level moisture gradient in the vicinity of the storm. It’s clear this is a very unstable sounding, capable of producing (at least) large hail. This clued me  in on how fast the storm could become severe. Certainly would not have had a special 19-20Z sounding in this area without NUCAPS and would have solely relied on model forecast soundings.

NUCAPS sounding from Mexico ahead of low level moisture gradient at 20Z

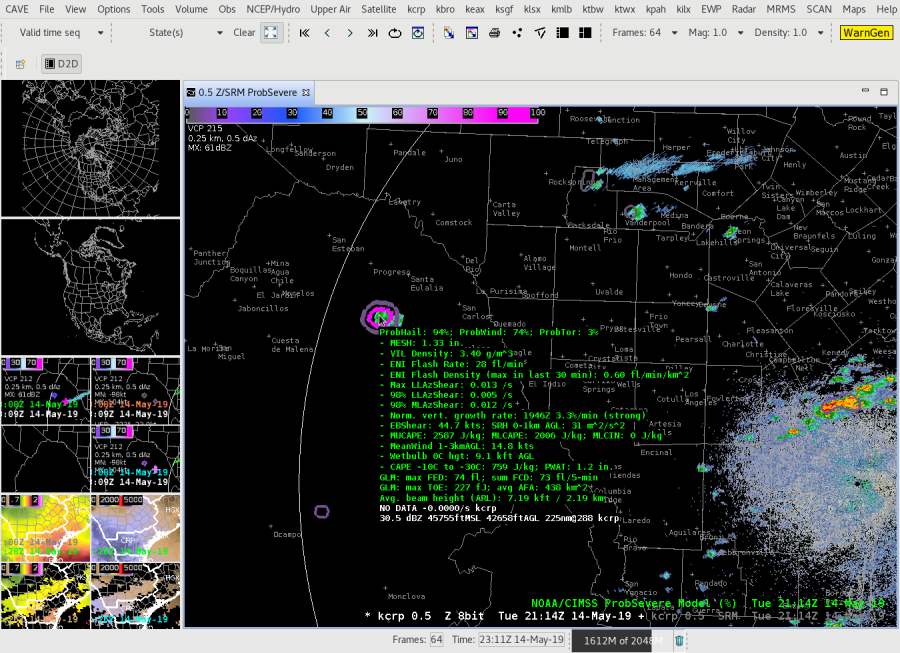
Even though it is far away from the KCRP radar, prob severe quickly showed the developing storm ramp up and have very high severe hail (and wind) probabilities (roughly within 15 minutes of initiation). If the NUCAPS forecast is right, this storm would likely continue into the evening given the abundant instability.

Prob Severe from KCRP looking in Mexico

-Tempest Sooner

Reiterating the use of GLM over open water

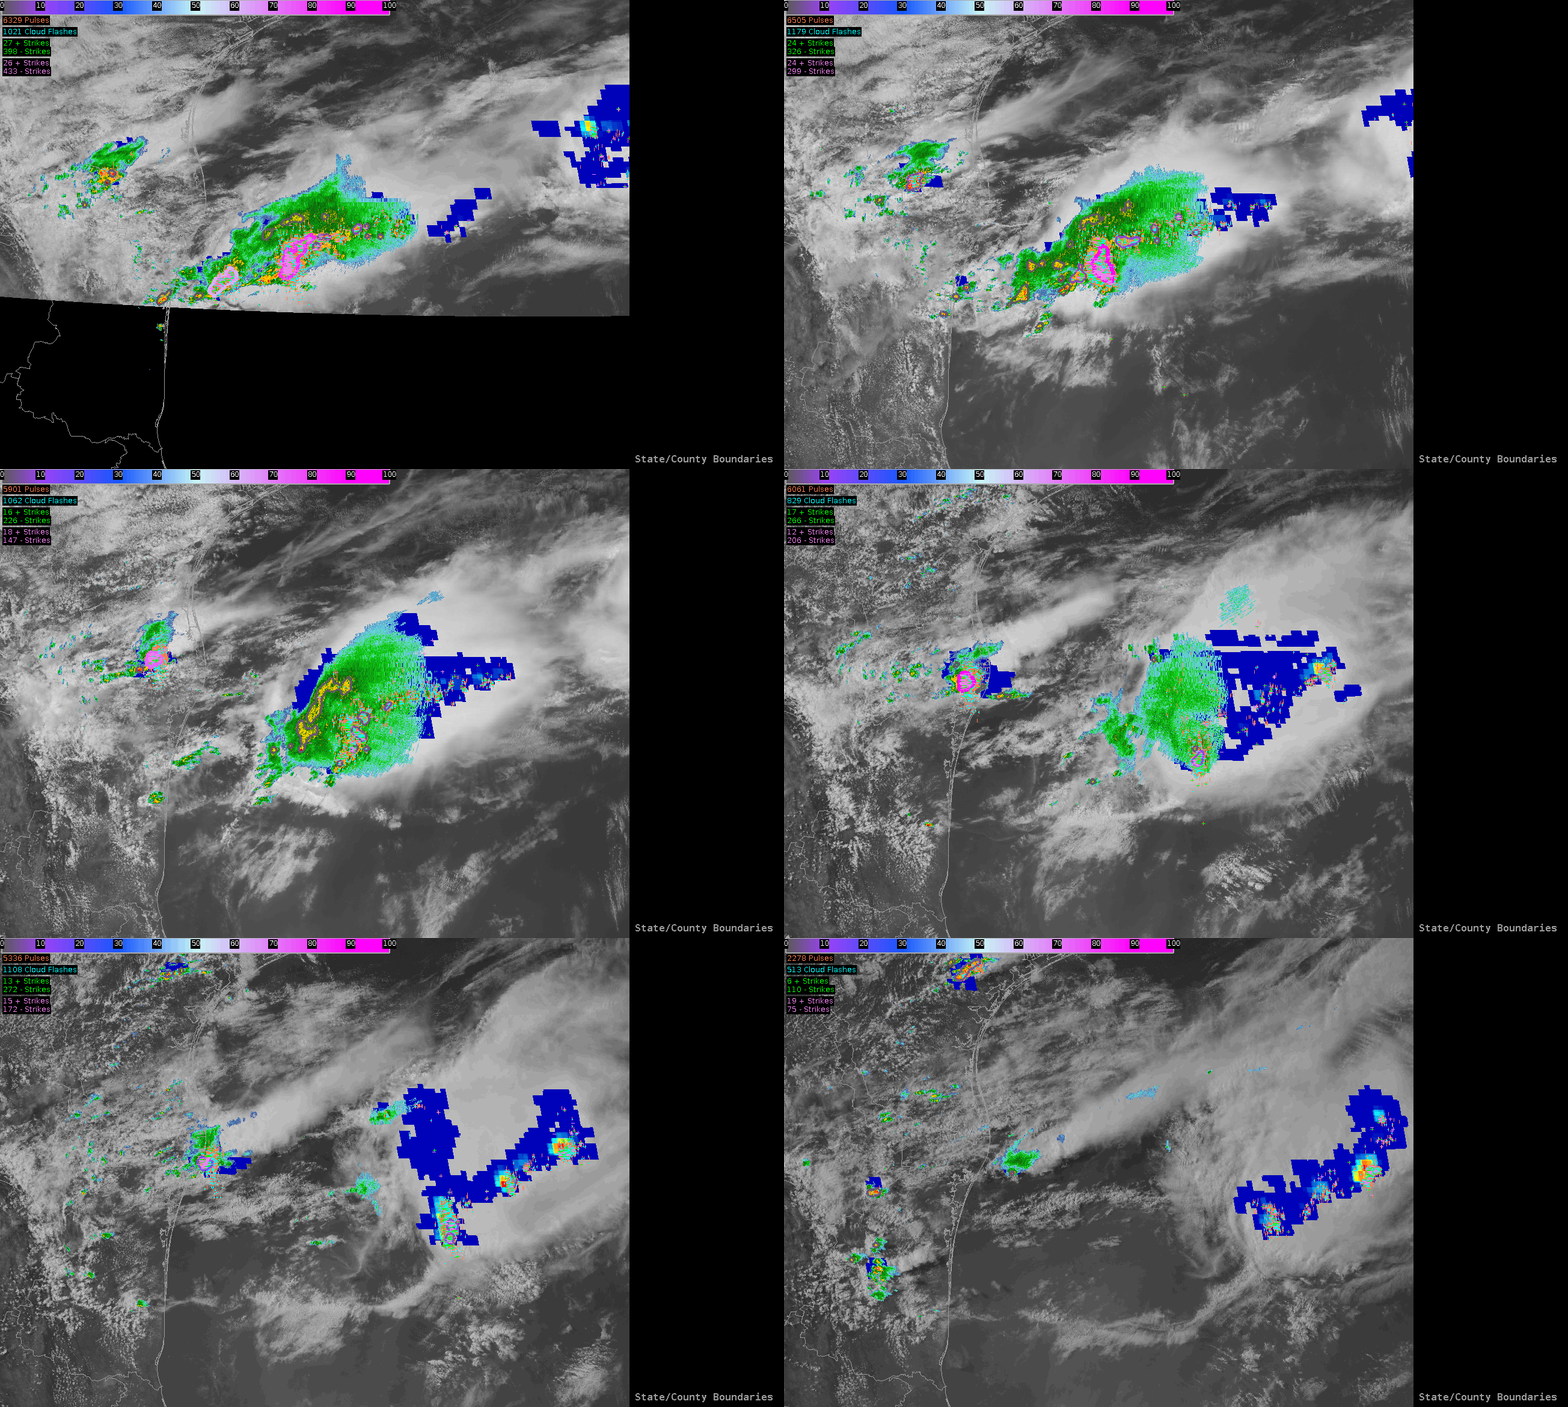
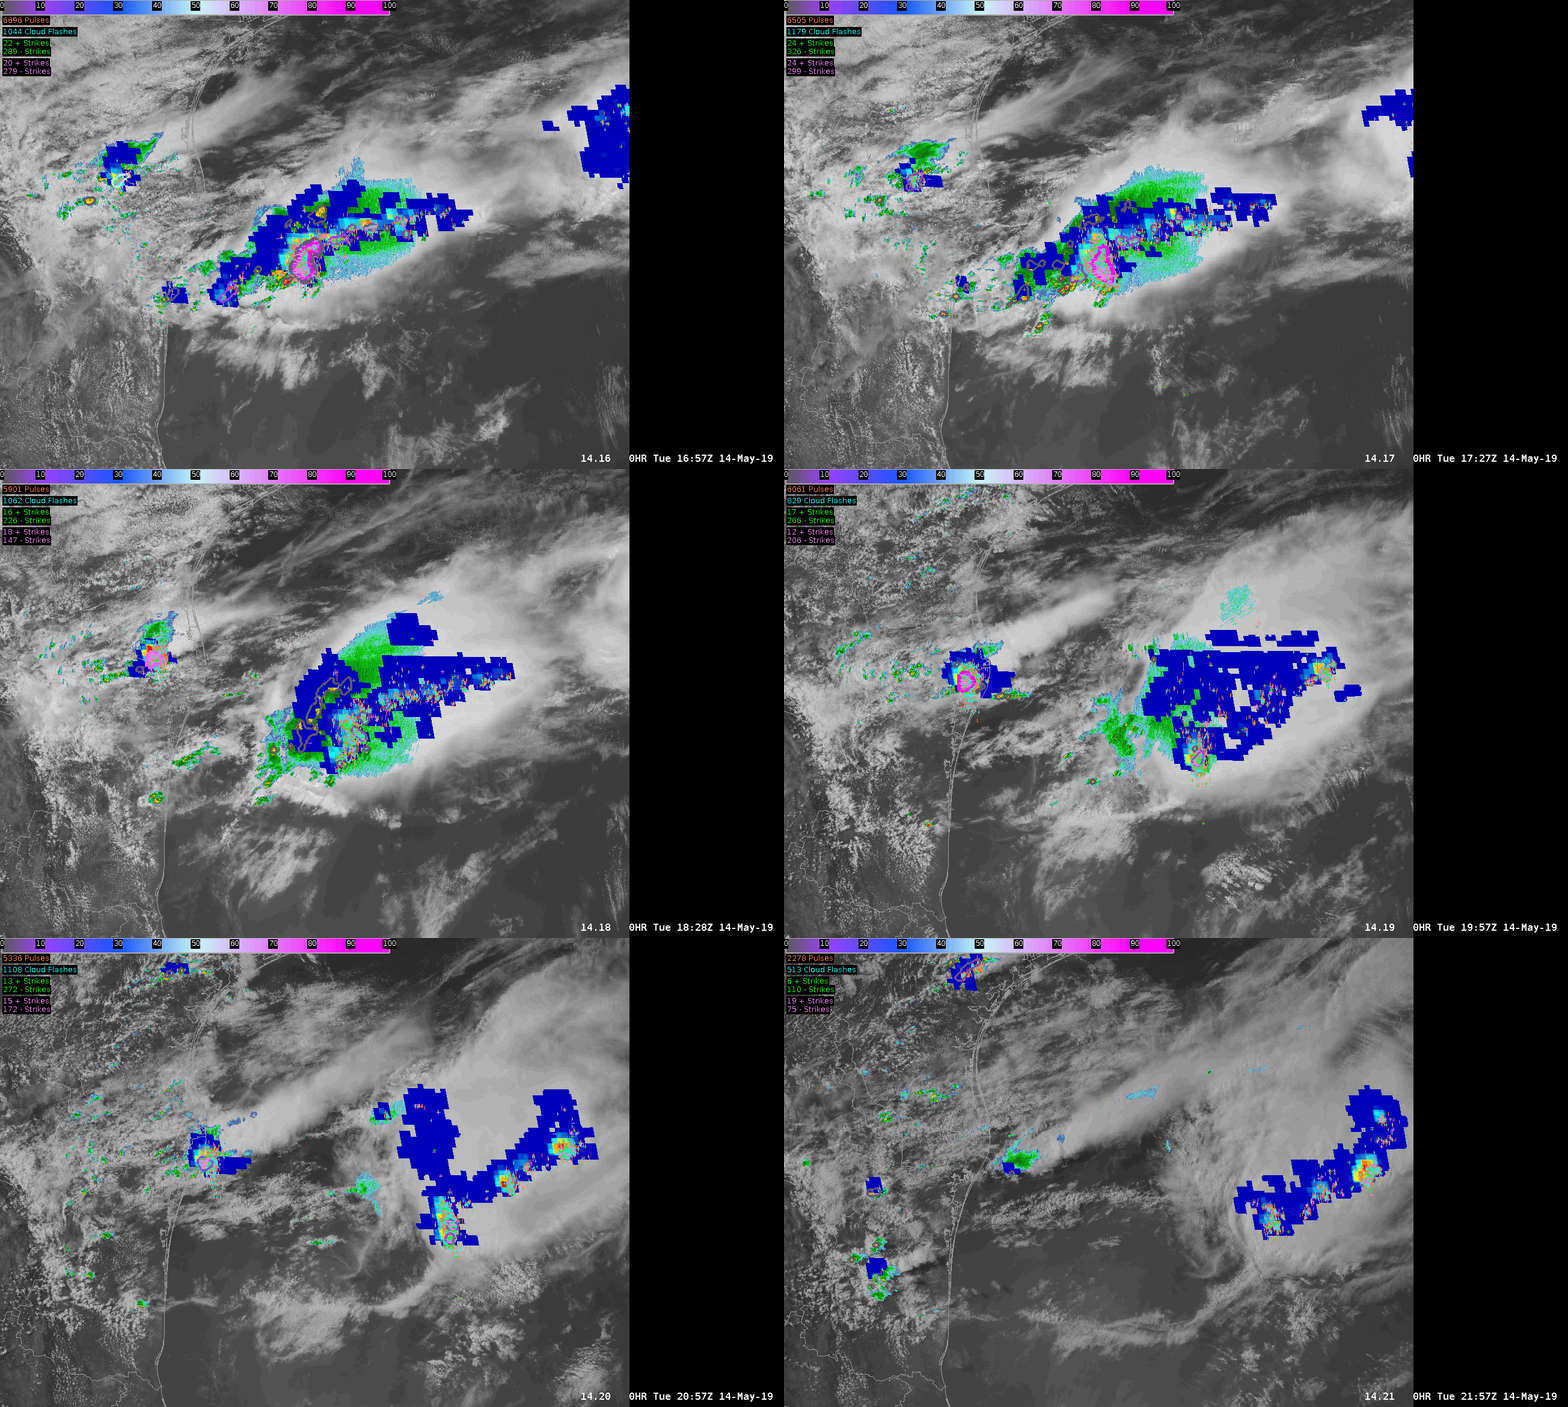
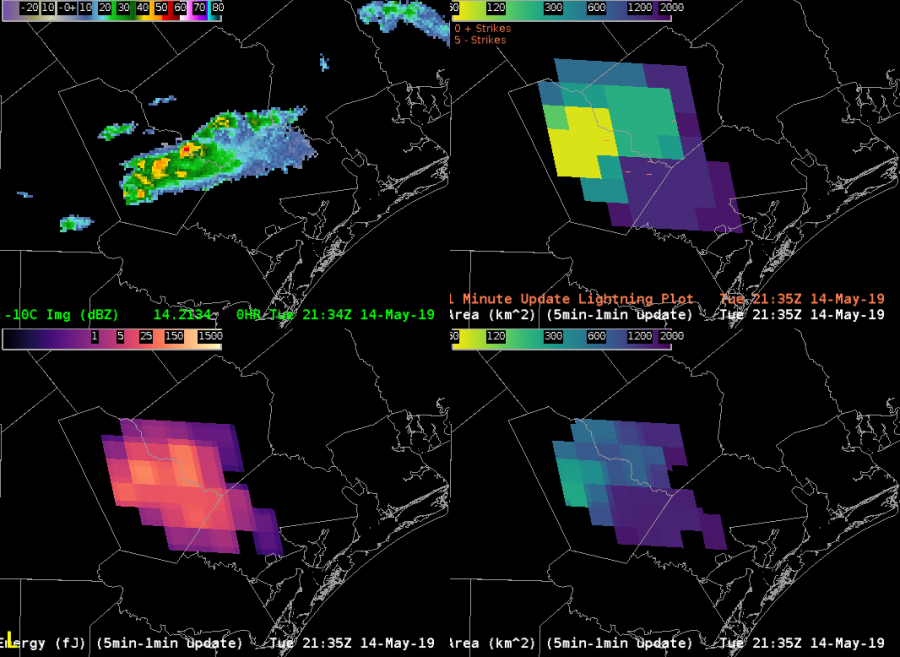
A great example of GLM usability is over the Gulf of Mexico (or any open bodies of water) where radar coverage and ENTI lightning sources diminish. Here’s an example of how a system moves eastward over the Gulf: radar disappears, but GLM (and some NLDN/ENTI) lightning data still lets you know where the strongest storm updrafts are located. Not only that, but the spatial extent of lightning is better known now that you have GLM alone. Below is displaying radar and satellite with FED GLM data, and NLDN/ENTI lightning detection. ProbSevere also becomes less relevant. The separate updrafts are easily distinguishable toward the end of the animation using FED.

Next animation is the same, but with FED on top of radar making it easier to see its evolution and usability:


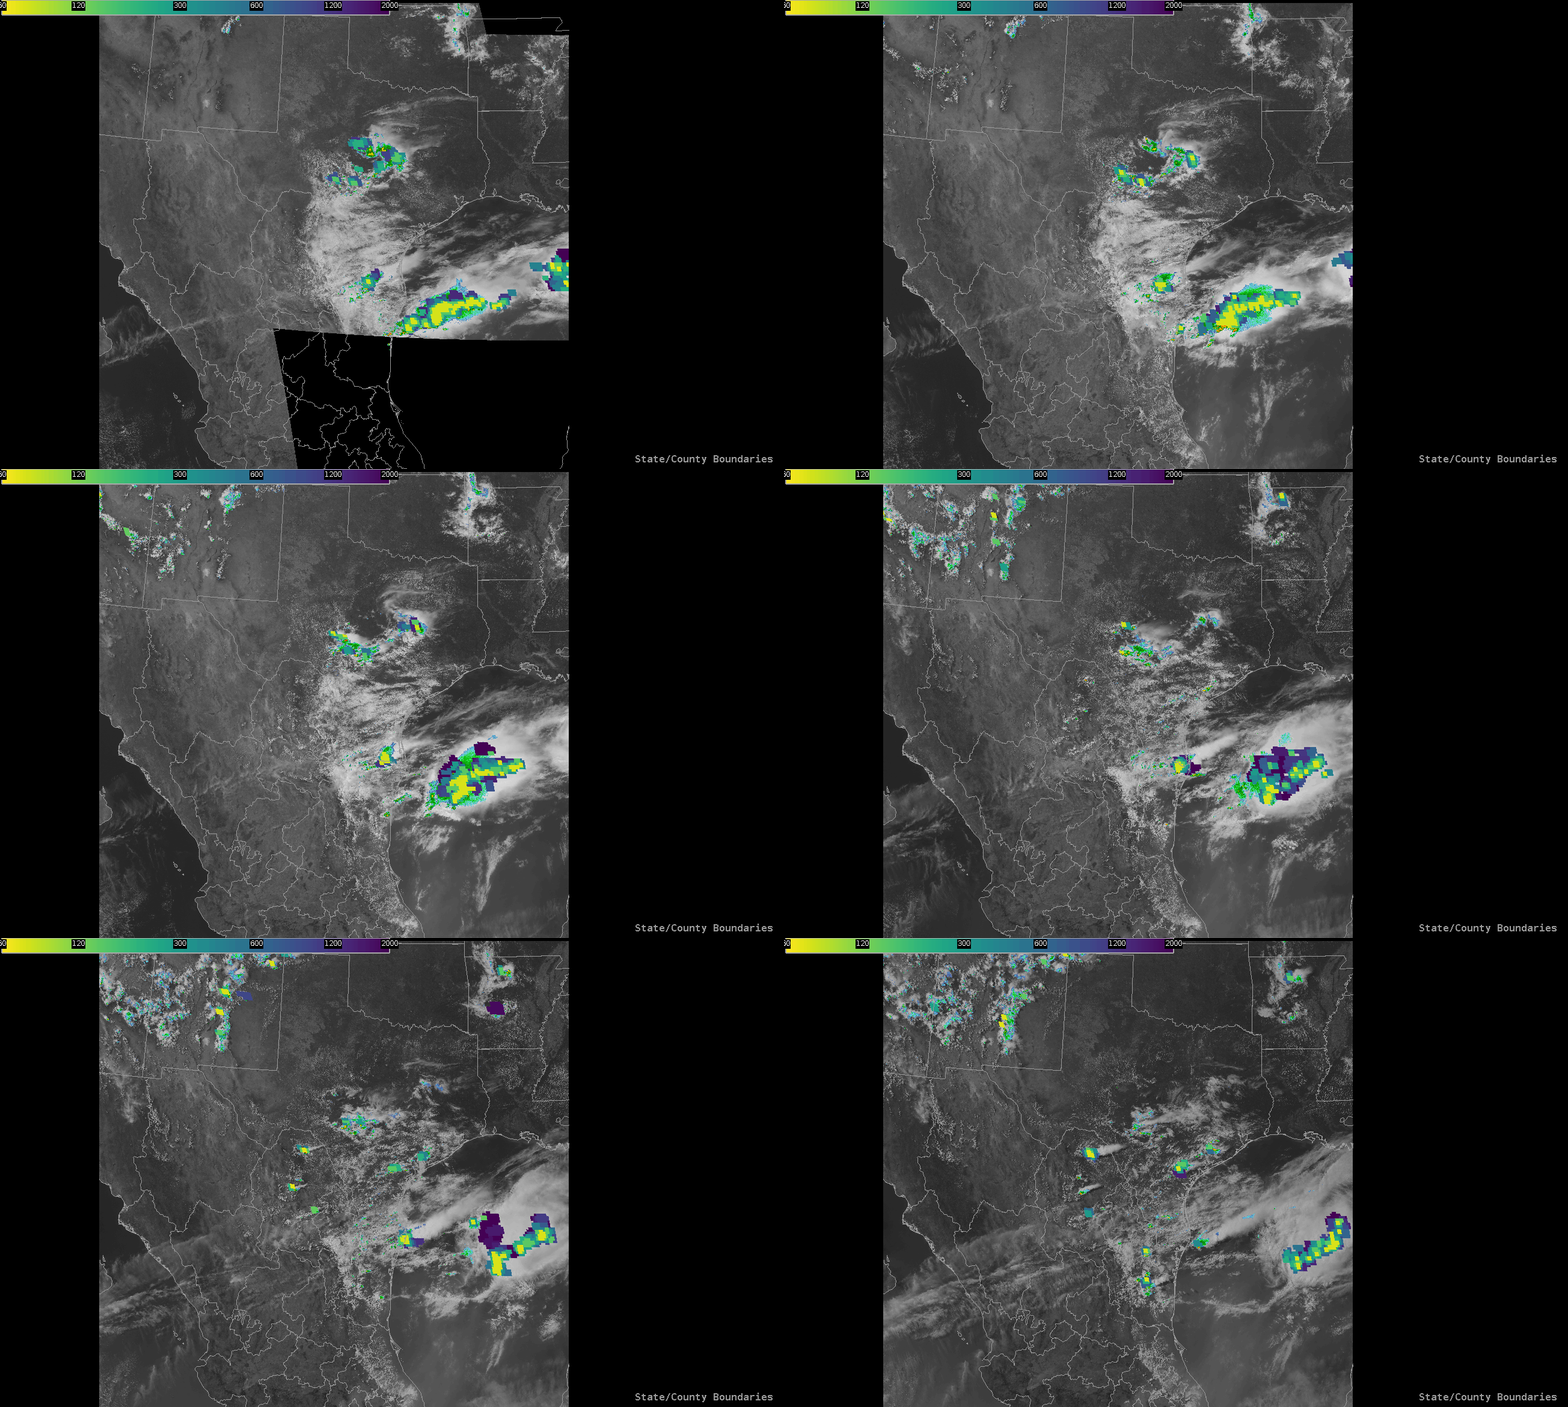
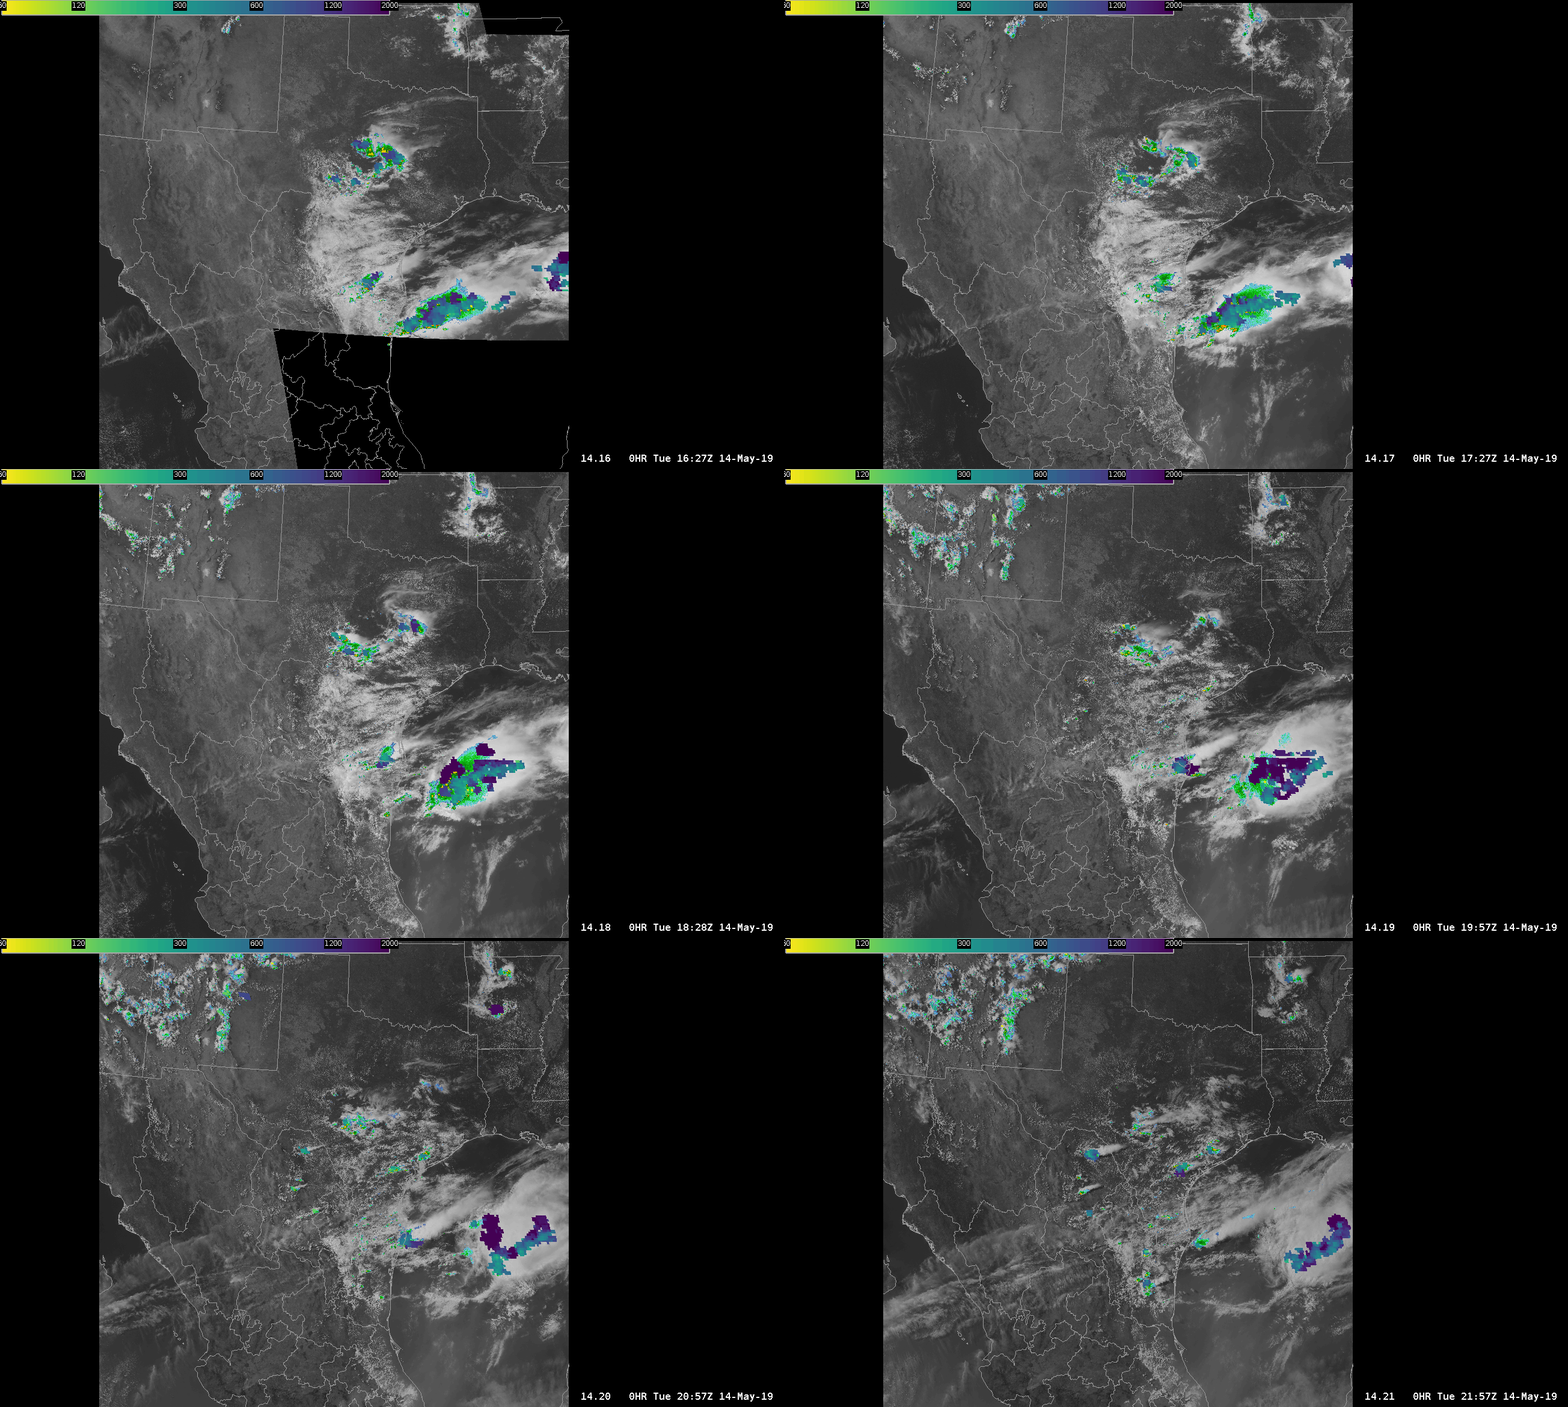
Now with the same scenario, comparing the Minimum Flash Area (MFA) GLM product with the Average Flash Area (AFA) GLM product, it is MUCH easier to differentiate new convection with the MFA product. Notice all of the yellow spots in NM and Mexico that make it easily detectable with the human eye as you watch your SA monitor. This may be a product of color scale for the AFA, but this tells me that the MFA would be more useful in convective initiation. I have not gotten much value out of the AFA  as I would with just simply using the FED (Flash Extend Density GLM product) or TOE (Total Optical Energy). -shearluck

TOP IMAGE: MFA       ;     BOTTOM IMAGE: AFA

GLM Weak Convection

On a day with weak convection, it was interesting to watch the Minimum Flash Area and how it related to storm structure. As expected closer to the updraft, smaller flashes were noted, but there is clearly a larger flash that extends out into the anvil area. This is quite the distance from the core of the storms, and thus would have impacts on DSS based services and potential lightning strikes to outdoor events.

Reflectivity, Minimum Flash Area, Average Flash Area, TOE clockwise from top left.

Day 2 Blog According to Orca

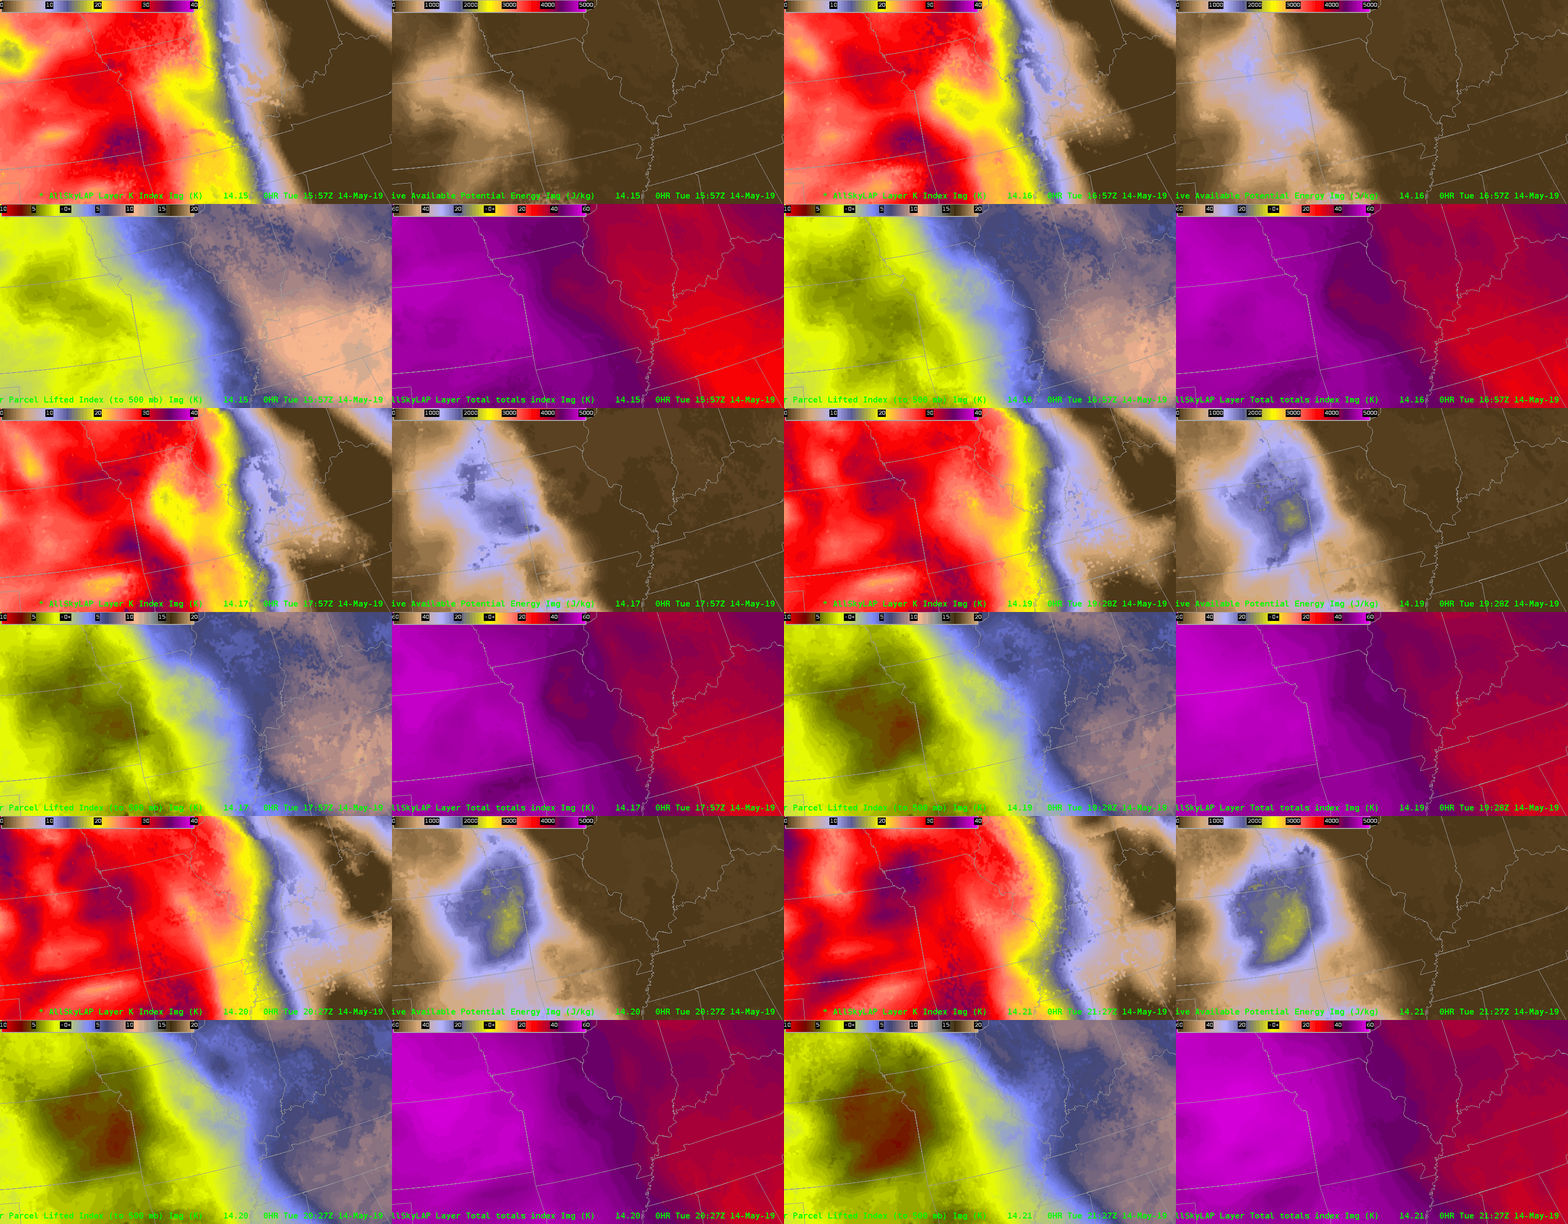
Conditions across MO today are relatively quiet for this time of day.  LAP stability indices are getting elevated (CAPE 2100, TT mid-50s, LIs -6 ish, K 32-35) but the bulls-eye for that  is remaining in eastern KS.   H7-H5 LR remain 6-7 thru midnight, after which will be  appchng 8 thru mid-morn across west central MO.  This is a result of genesis of a shallow SFC Low in West Central MO in early morning hours that drifts across MO thru EOP.   So still forecasting early evening, ISOLD TS across the  MO during that time as TT, LI and CAPE indices are elevated then as well.  VWP indicating weak LL shear at this time.  All thing considered, severe threat is low thru EOP. 

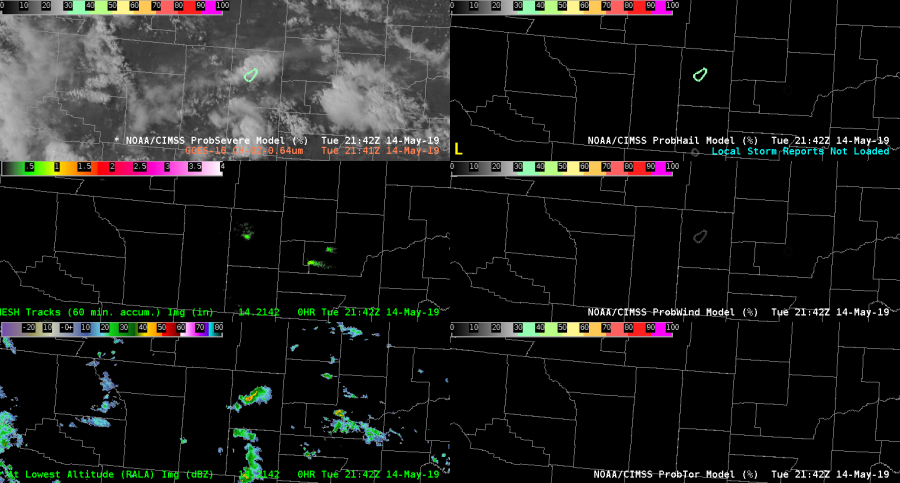
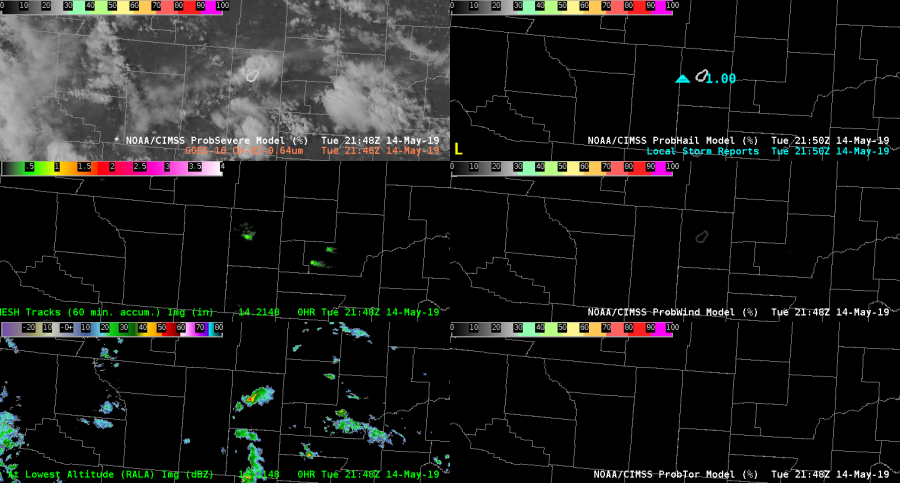
Separating threats in D2D with ProbSevere2

It’s nice to break out ProbHail, ProbWind, and ProbTor as separate displays (right hand column below) – something that is not even possible with the ProbSevere v2 placefiles.

ProbHail was the greatest threat (far upper left panels), topping out around 33%, and culminating in a quarter size hail report (below, upper right). It’s been pointed out that ProbSevere has been much harder to calibrate out west where there are fewer reports and thermodynamics are different. So, it’s really all about trends instead of quantities.

#MarfaFront