ProbTor Too High

Watching a supercell near Bismarck…

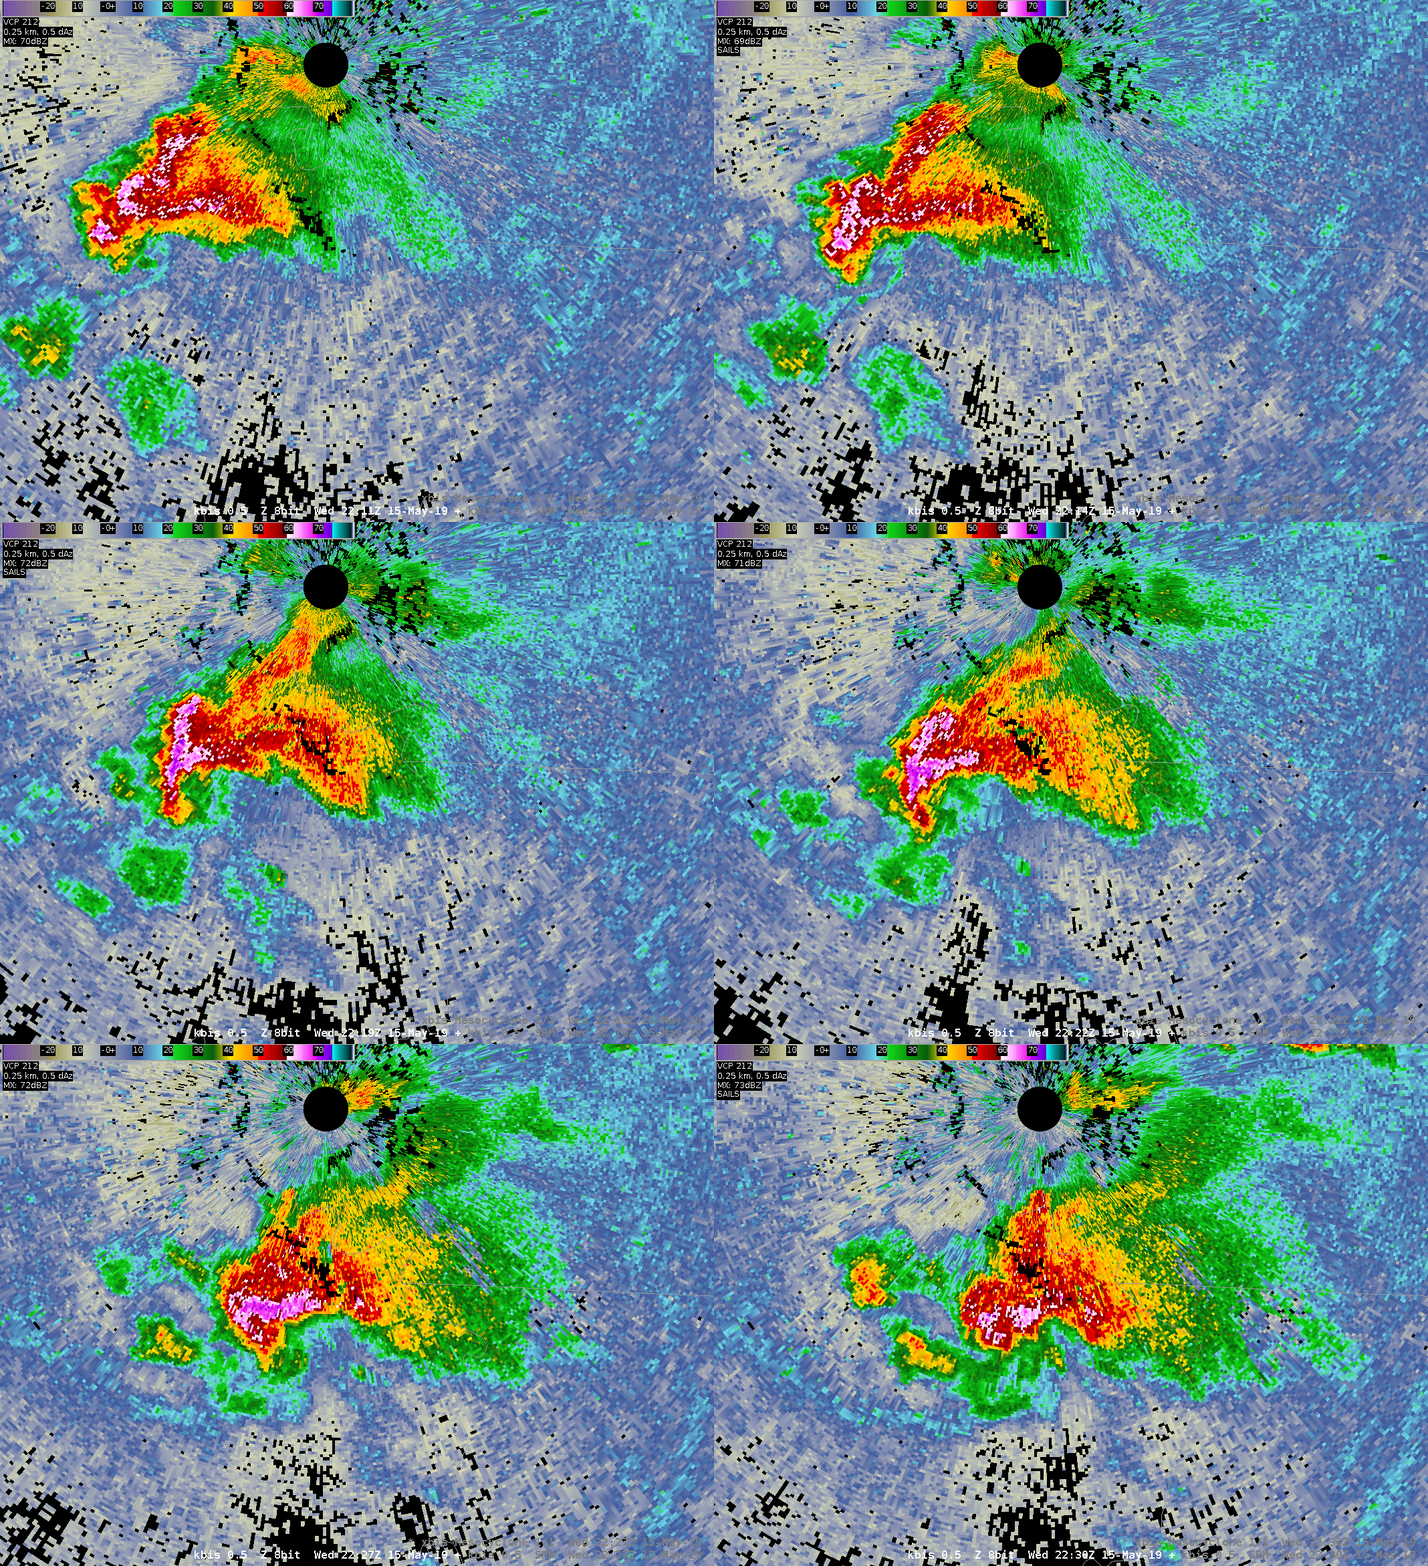
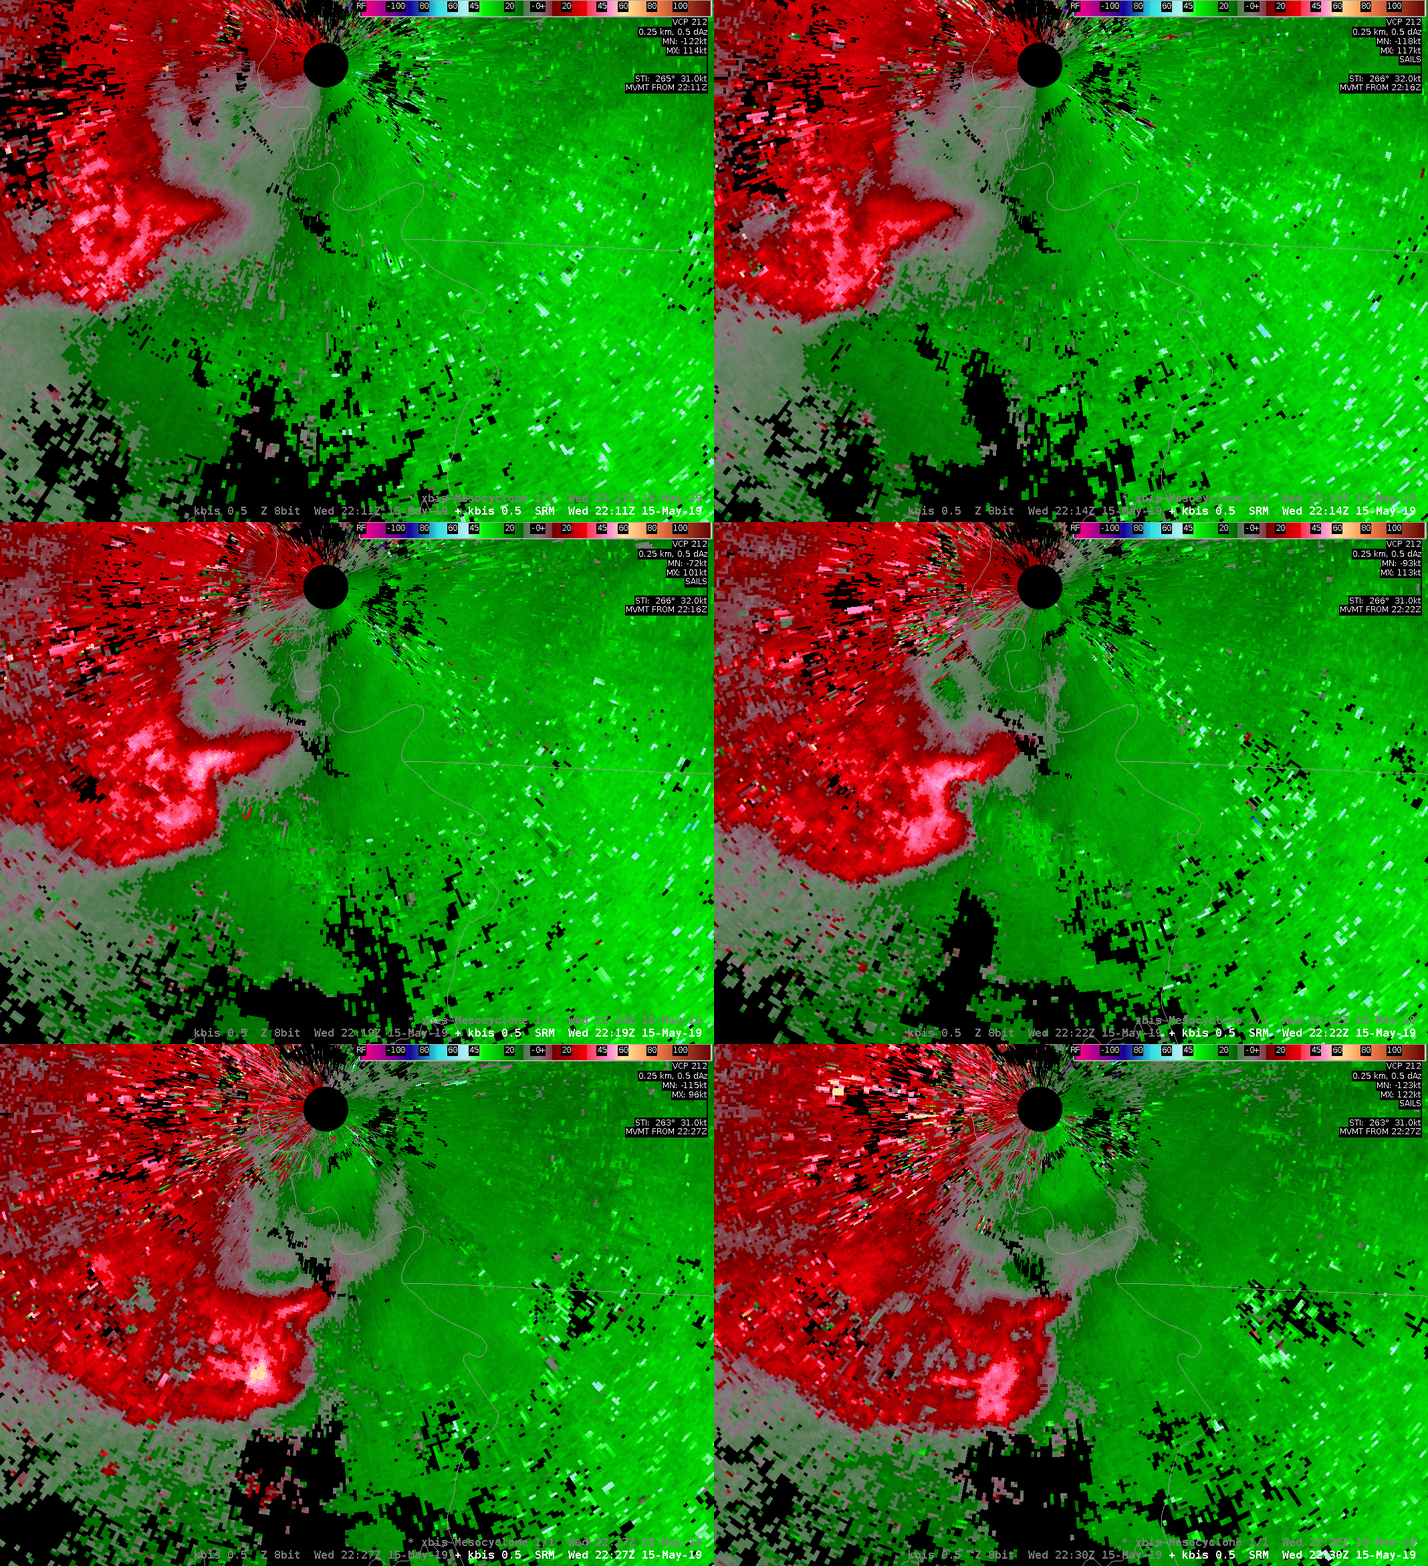
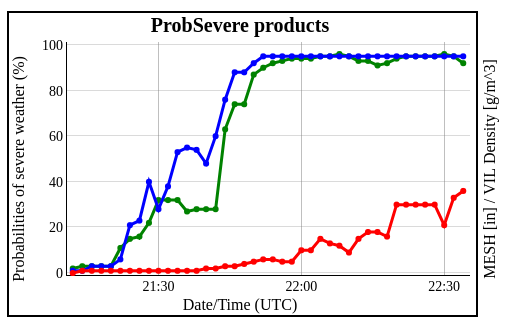
It was clear from the hail core aloft that this was severe. However, it was obvious around 2152Z that the RFD gusted out as was seen on reflectivity initially, and then later on the velocity images as the winds became less perpendicular to the beam. However, ProbTor continued to carry high probabilities, and even increased when it was clear on the velocity images there was no tornado threat.  ProbTor was only keying on the outflow boundary.  MRMS Rotation Tracks were also showing a swath of higher values along the outflow boundary.

Reflectivity Loop
SRM Loop
ProbSevere Time Series

-Tempest Sooner

ProbSevere ProbTor gets tricked

Upper left: Orange ProbSevere with a green ring signifying escalated ProbTor
Bottom right: Low Level Rotation tracks with green ProbTor Object associated with the green ring at upper left.
Lower Left: KBIS base velocity.

Key things to notice above – a spurious looking inbound maximum to the northwest of KBIS and a corresponding uptick in Low Level Rotation tracks in response to this shear zone that likely is just an artifact of sampling near the ground.  Below, we see ProbTor climbing to over 40% (red trace).  Be careful with ProbTor when the storm is close to a radar.

Suggestion: Instead of 0-2km, perhaps Low Level Rotation Track should be capped at the estimated LCL AGL.

#MarfaFront

Lightning observed but no GLM

ProbSevere gives every indication of a severe storm over Morton County, ND (see ProbSevere read out below).  The Earth Networks lightning suggests there of 52 fl/min but GLM FED gives 0 fl, TOE 0 fJ, and AFA 0 km^2.  The two depictions below show those three GLM fields with the MRMS 1 km reflectivity.  Perhaps there is an issue with viewing angle at this northern latitude. – Jonathan Wynn Smith (ESSIC/UMD)

ProbHail: 93%; ProbWind: 95%; ProbTor: 5%
– MESH: 1.83 in.
– VIL Density: 3.20 g/m^3
– ENI Flash Rate: 52 fl/min
– ENI Flash Density (max in last 30 min): 0.89 fl/min/km^2
– Max LLAzShear: 0.007 /s
– 98% LLAzShear: 0.006 /s
– 98% MLAzShear: 0.008 /s
– Norm. vert. growth rate: 2101Z 1.3%/min (weak)
– EBShear: 38.0 kts; SRH 0-1km AGL: 155 m^2/s^2
– MUCAPE: 2925 J/kg; MLCAPE: 1657 J/kg; MLCIN: -36 J/kg
– MeanWind 1-3kmAGL: 26.4 kts
– Wetbulb 0C hgt: 9.0 kft AGL
– CAPE -10C to -30C: 546 J/kg; PWAT: 1.3 in.
GLM: max FED: 0 fl; sum FCD: 0 fl/5-min
GLM: max TOE: 0 fJ; avg AFA: 0 km^2
Avg. beam height (ARL): 1.28 kft / 0.39 km
Object ID: 273531
PS: 98

GLM – Apparent Poor FED Detection

GLM Flash Extent Density product seems to have poor detection from both GOES 16/17 in the high plains. Perhaps this is related to the greater viewing angle due to latitude and being farther on the periphery.  In this example, a very strong supercell was noted to have high total flash density values on ENTLN, while the GLM FED was very unimpressive. It was picking up on some flashes, but not enough to help the storm stand out from a lightning perspective. This could have negative impact on warning forecasters trying to use FED to identify stronger cells from a situational awareness perspective.


— warmbias —

AllSky – Buyer Beware

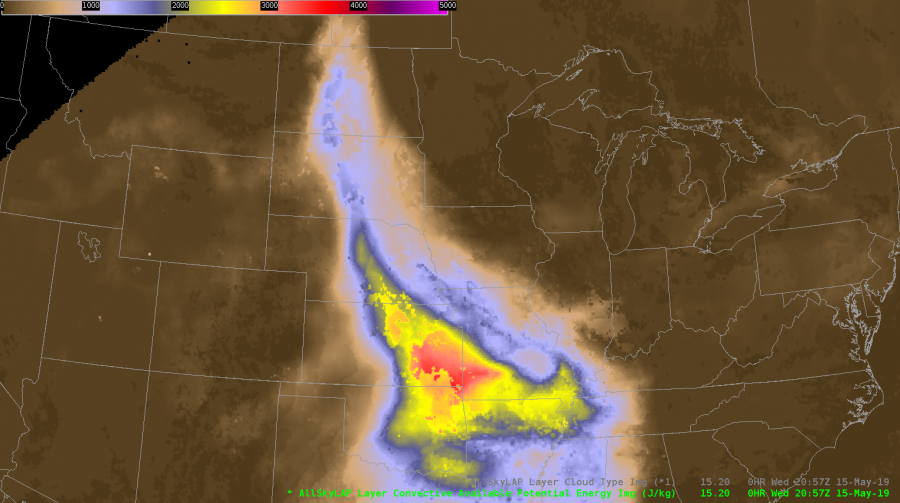
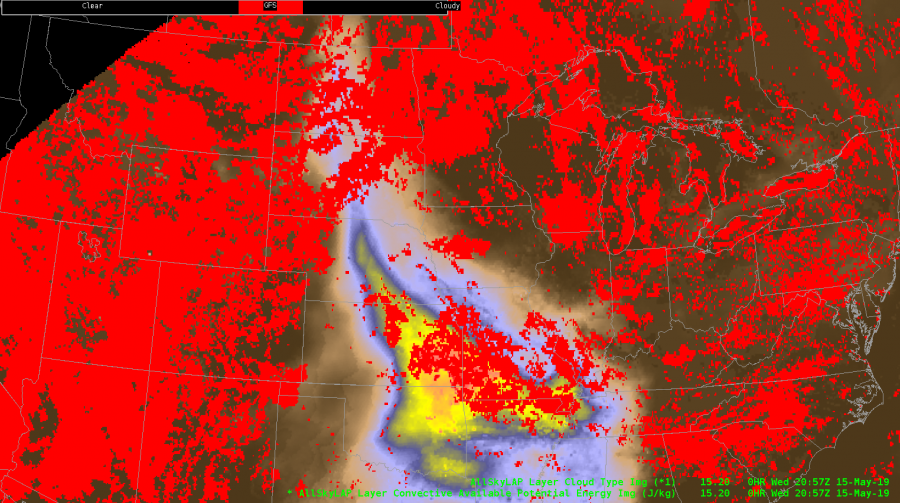
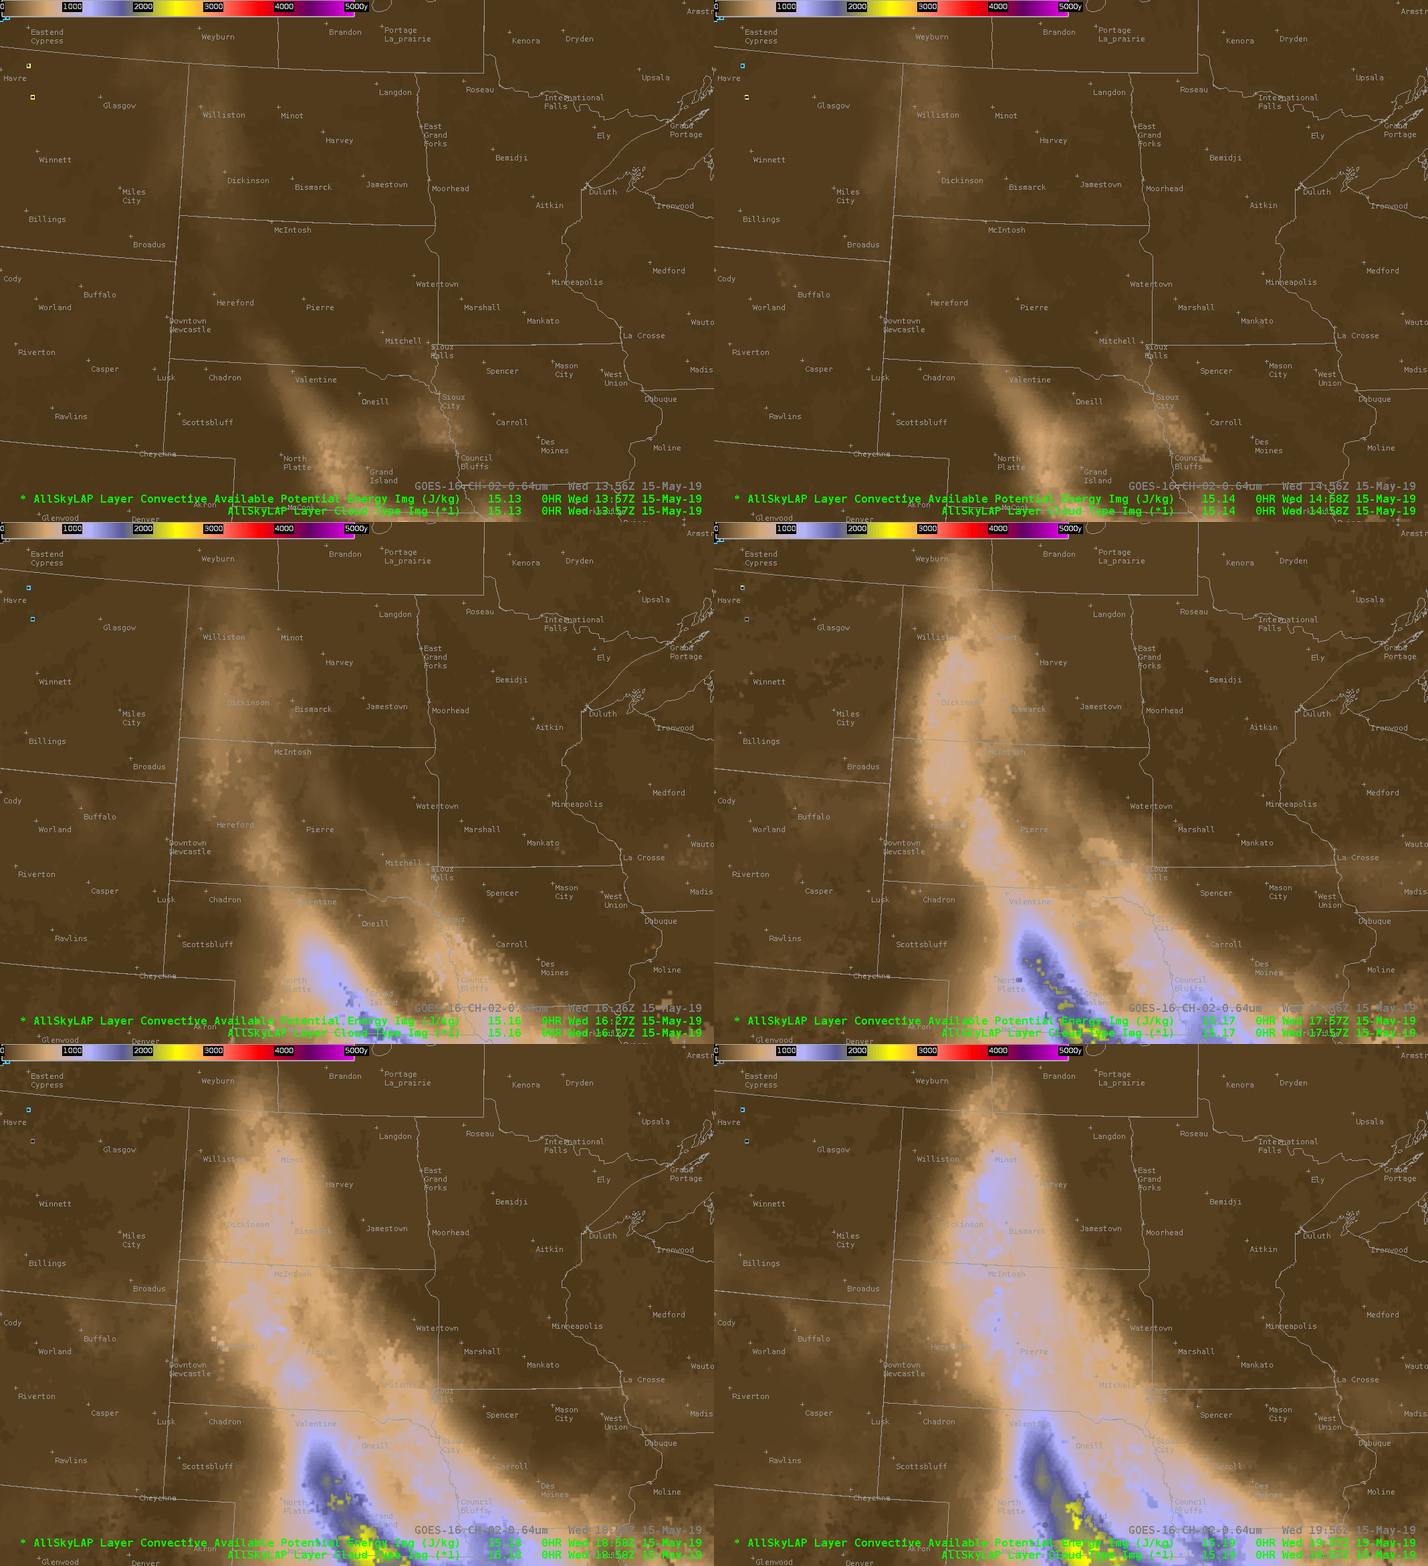
All Sky Layer Cape looking funky with some discontinuities around KS? Why?

A quick look at the Data Type product (below) shows only GFS being used in these suspect areas. Major caveat emptor!

All right, time to look at storms around Bismark.

#MarfaFront

ProbSevere Potential Gotcha

A potential “gotcha” and/or training issue…

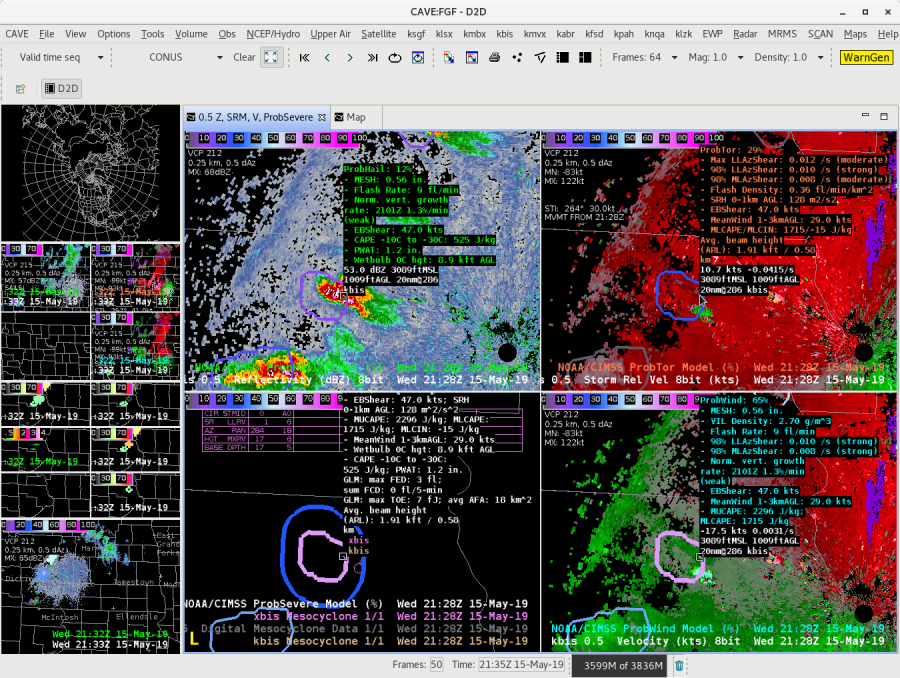
I initially loaded a 4-panel with 0.5 Reflectivity and ProbHail overlaid, 0.5 SRM and ProbTor overlaid, and 0.5 Vel and ProbWind overlaid, but I had not loaded the full ProbSevere Model in any of the 4 panels. I then noticed that there was a 29% ProbTor (which was erroneous with bad dealiasing), but my attention wasn’t called to it because the 2nd circle around the storm only appears on the full ProbSevere. It would seem like a good idea to either always have the full ProbSevere displayed or if folks prefer to load the threats separately, perhaps need to add a second circle around the ProbTor object.

ProbSevere 4 Panel – Upper Left: 0.5 Reflectivity + ProbHail, Upper Right: 0.5 SRM + ProbTor, Bottom Right: 0.5 Vel + ProbWind, Bottom Left: NMDA + ProbSevereModel

-Tempest Sooner

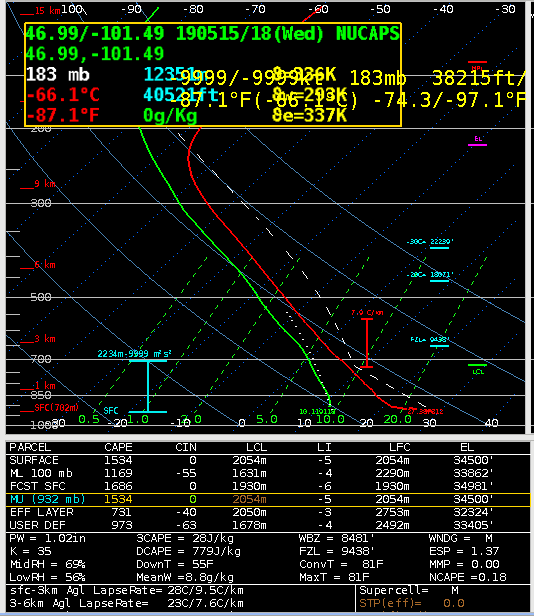
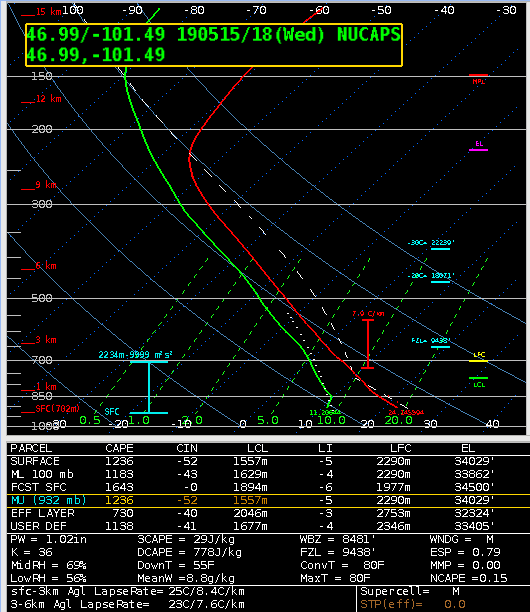
Differences between Observed Sounding and NUCAPS

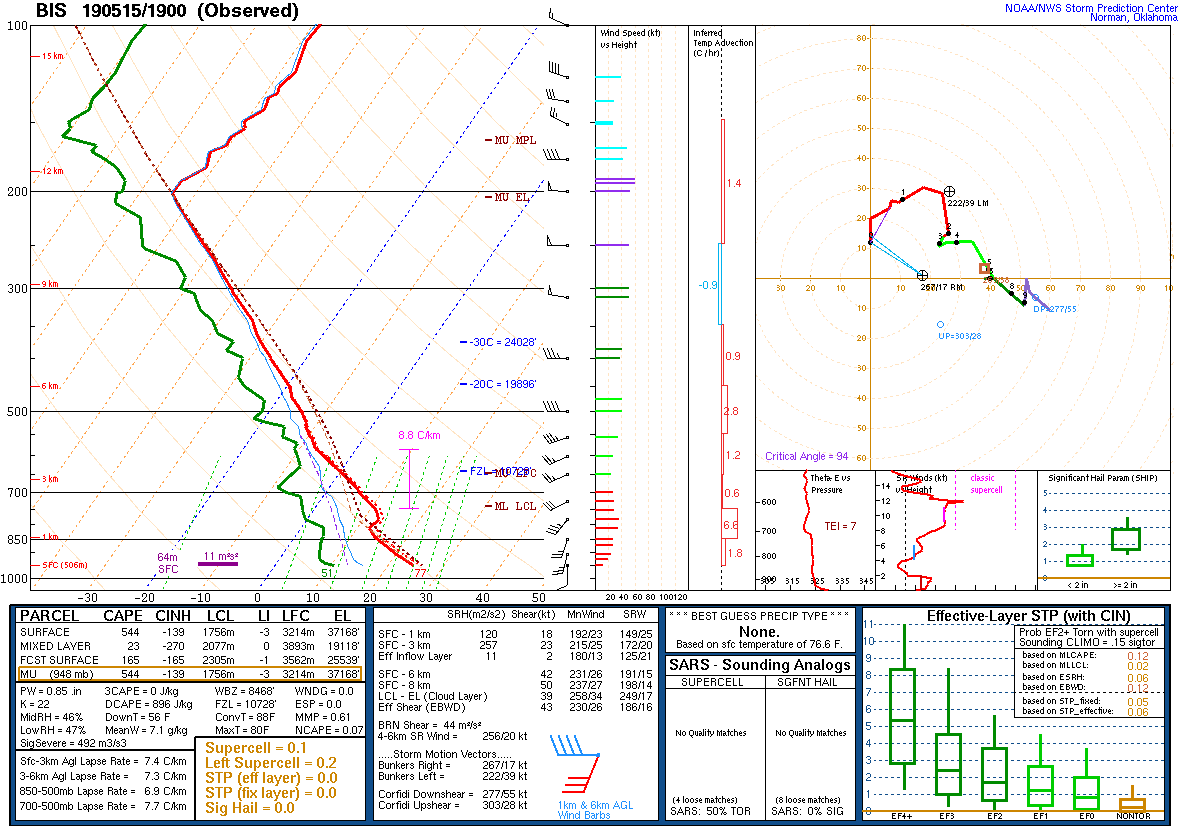
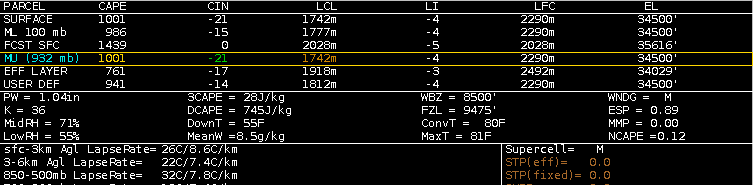
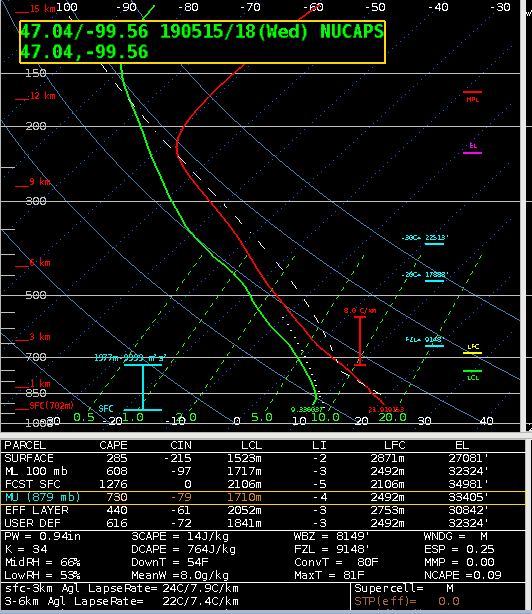
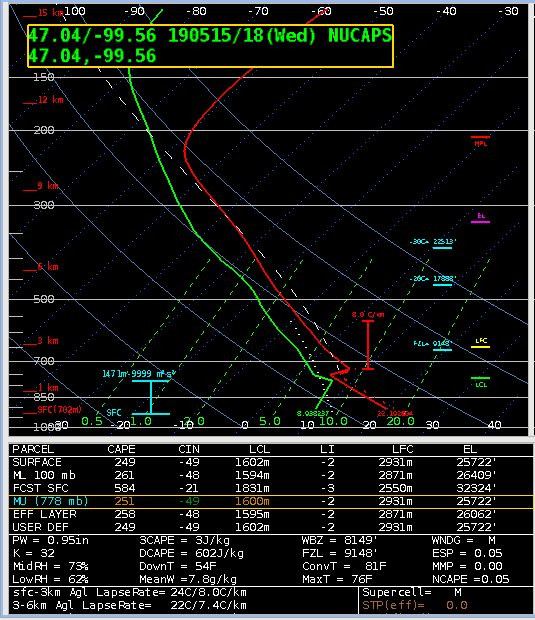
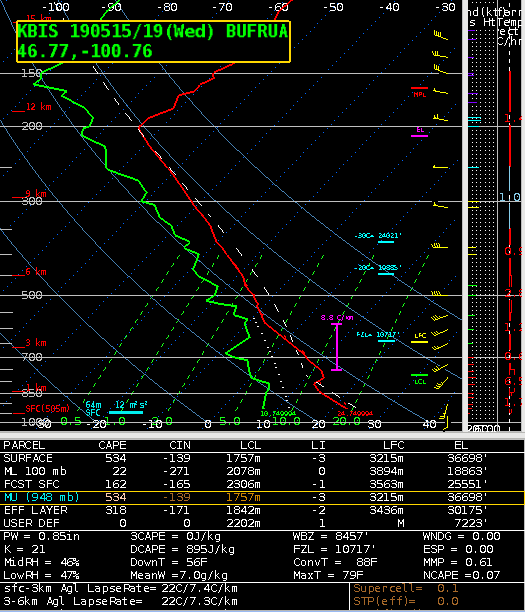
Compared KBIS observed 19z Skew-T to NUCAPS 20z Skew-T

Key points:
Lapse rate differences: Between 1-1.5C/km difference through all levels
SFC and MU CAPE was 500J/kg higher on the NUCAPS

Vertical profile is markedly different and is a much more saturated on the observed Skew-T

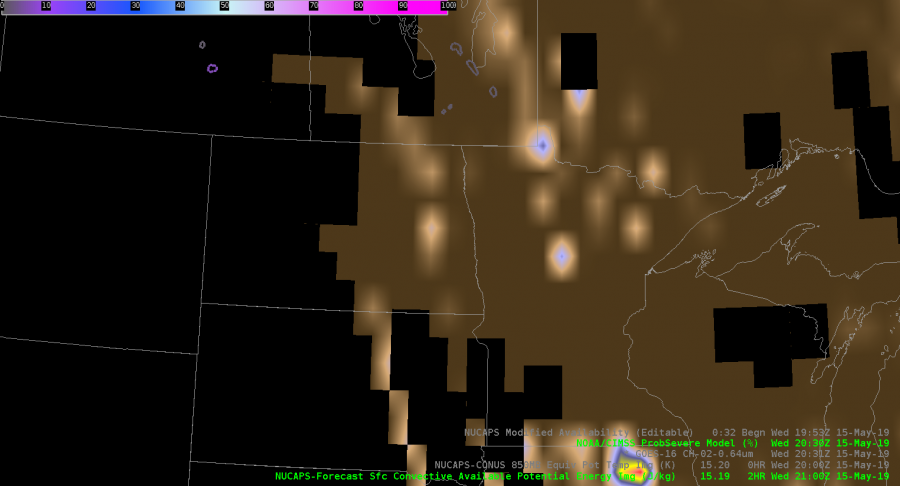
To further confuse matters the NUCAPS forecasted SFC CAPE values for the same location and time is 400J/kg…which is closer to the observed sounding than to the NUCAPS sounding.

—Desmond—

NUCAPS Gradients of CAPE

The 12Z Bismarck sounding was quite dry and and the surface observation at Bismarck was around 32F. Low level moisture has quickly rebounded this afternoon across central and western ND, however it remains dry across eastern ND. Dewpoints have come up into the upper 40s to near 50F and temperatures have climbed into the upper 70s. The AllSkyLAP CAPE loop clearly shows that instability is increasing across portions of ND with values topping out around 900 J/KG at 1930z, though most of the retrievals are GFS based because of cloud cover lingering in the area.

AllSkyLAP CAPE Loop

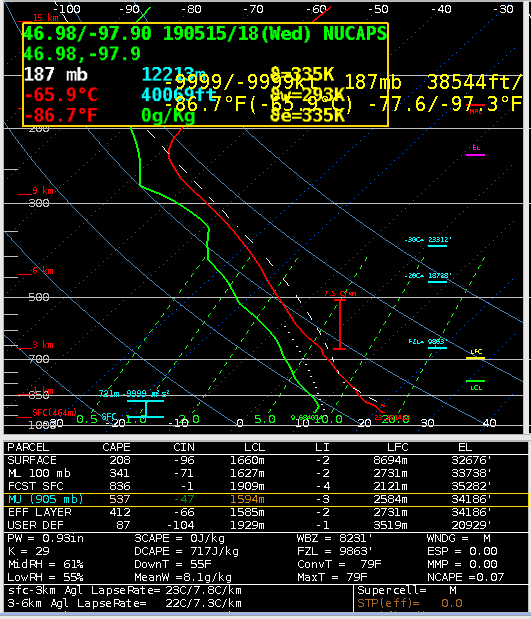
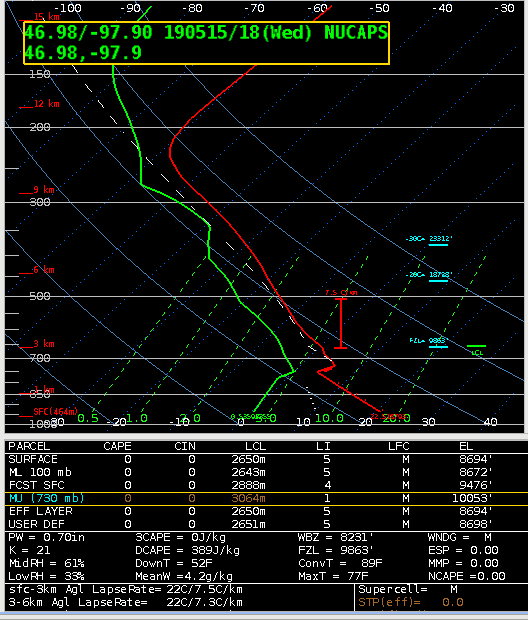
I decided to look at the NUCAPS soundings across the area to see if the CAPE values were similar. What I found was in the areas of low level moisture, the NUCAPS modified and unmodified sounding had similar MLCAPE values. However, as I checked NUCAPS soundings further east into the drier air, the un-modified soundings showed MLCAPE values that were far to high (should be near zero based on other observations), but the modified soundings were pretty spot on regarding the surface observations (especially Td, T may be slightly low), and thus MLCAPE values appeared to be more reasonable.

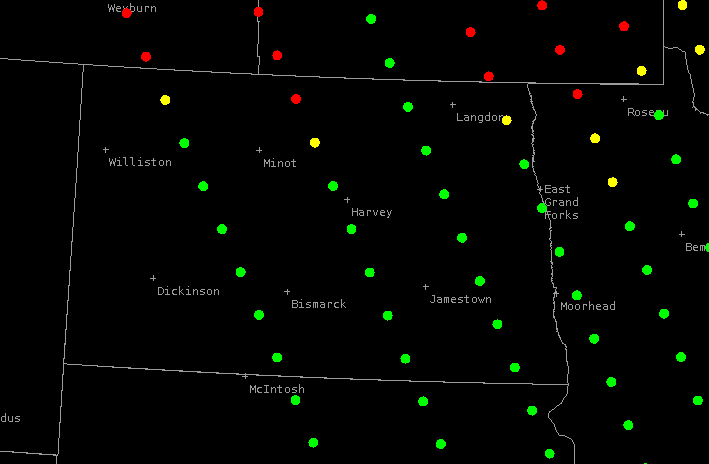
NUCAPS Swath. Soundings in quesiton are located just northwest of Bismarck, just northeast of Bismarck, and 2 dots east of Bismarck.

The next six images are the comparisons between the non-modified and modified NUCAPS soundings at three different locations. The first is near the peak in instability northwest of Bismarck, the second is east-northeast of Bismarck near the gradient, and the third is farther east into the drier air.

NOAA 20 Non-Modified NUCAPS Sounding just northwest of Bismarck
NOAA 20 RTMA Modified NUCAPS Sounding just northwest of Bismarck


NOAA 20 Non-Modified NUCAPS Sounding just ENE of Bismarck.
NOAA 20 RTMA Modified NUCAPS Sounding just ENE of Bismarck.


NOAA 20 Non-Modified NUCAPS Sounding 2 Dots East of Bismarck.
NOAA 20 RTMA Modified NUCAPS Sounding 2 Dots East of Bismarck.


With that said, the modified soundings seemed to do a decent job capturing the gradient in CAPE. The values appear to be a bit high compared to the AllSkyLAP CAPE (1183 vs 750 J/KG around the same time), and high also compared to the SPC Meso Analysis Page (around 500 J/KG).

Quick update…..

The Bismarck office fortunately did a 19Z sounding, which showed very weak MLCAPE, only 22 J/KG! So both the AllSkyLAP CAPE and the NUCAPS were overdone.

KBIS 19Z Sounding

-Tempest Boomer

GLM usability in heavily parallaxed locations

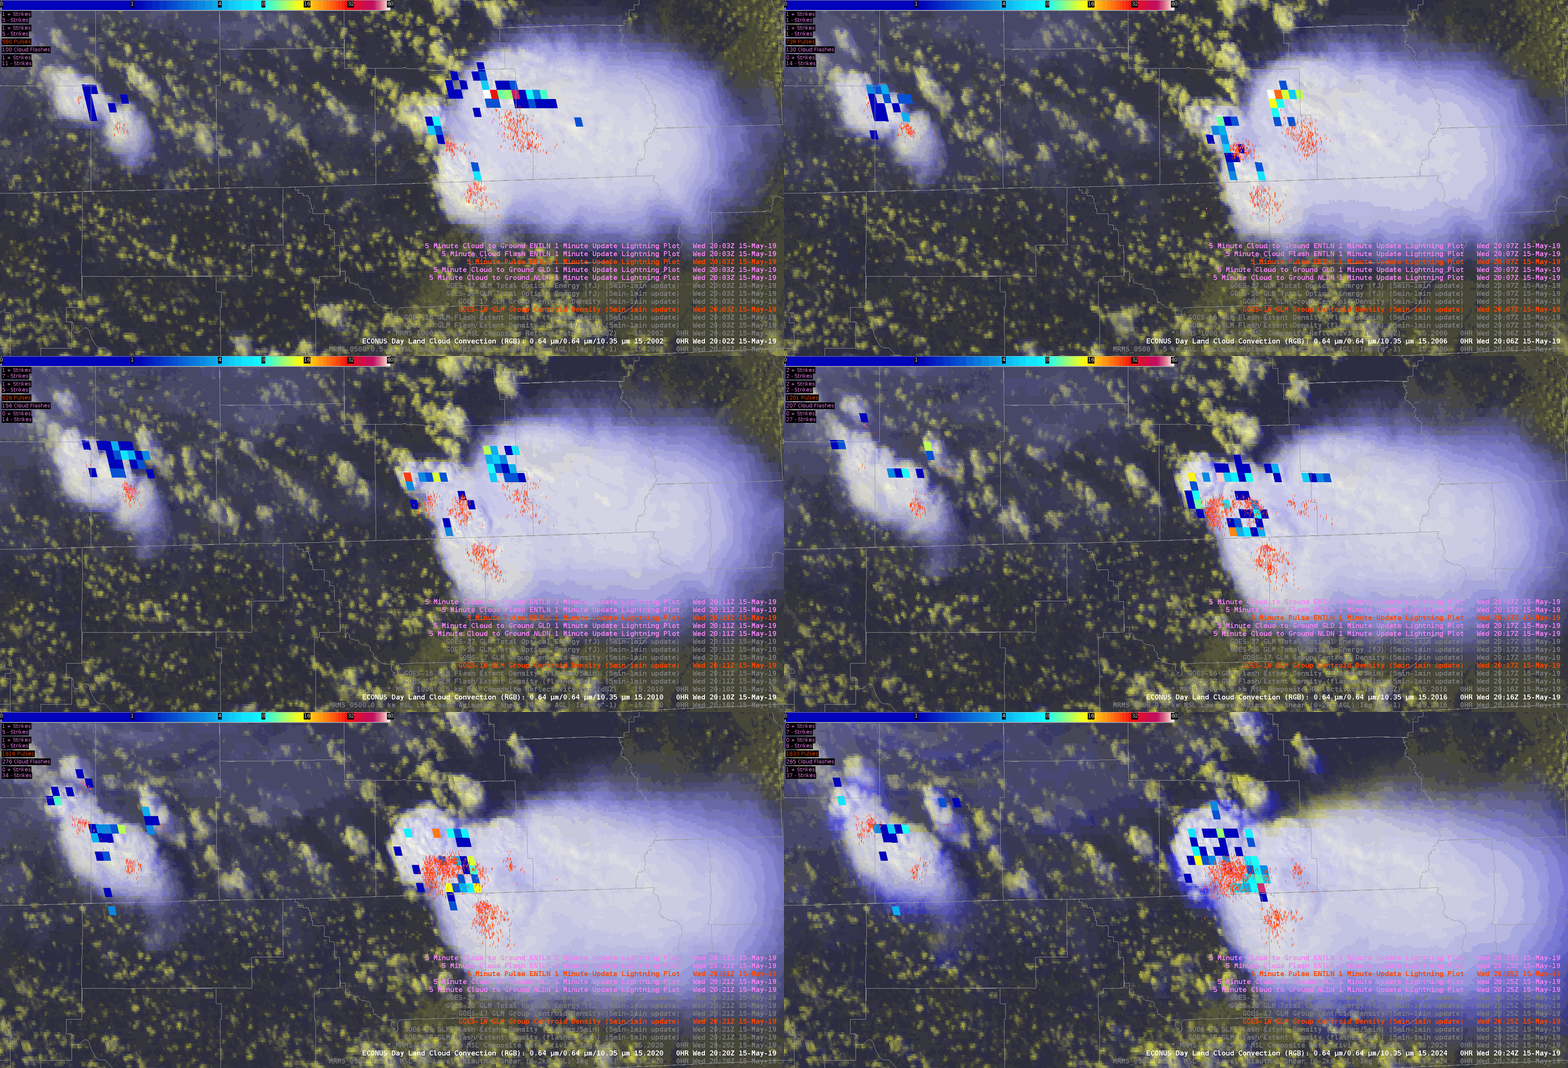
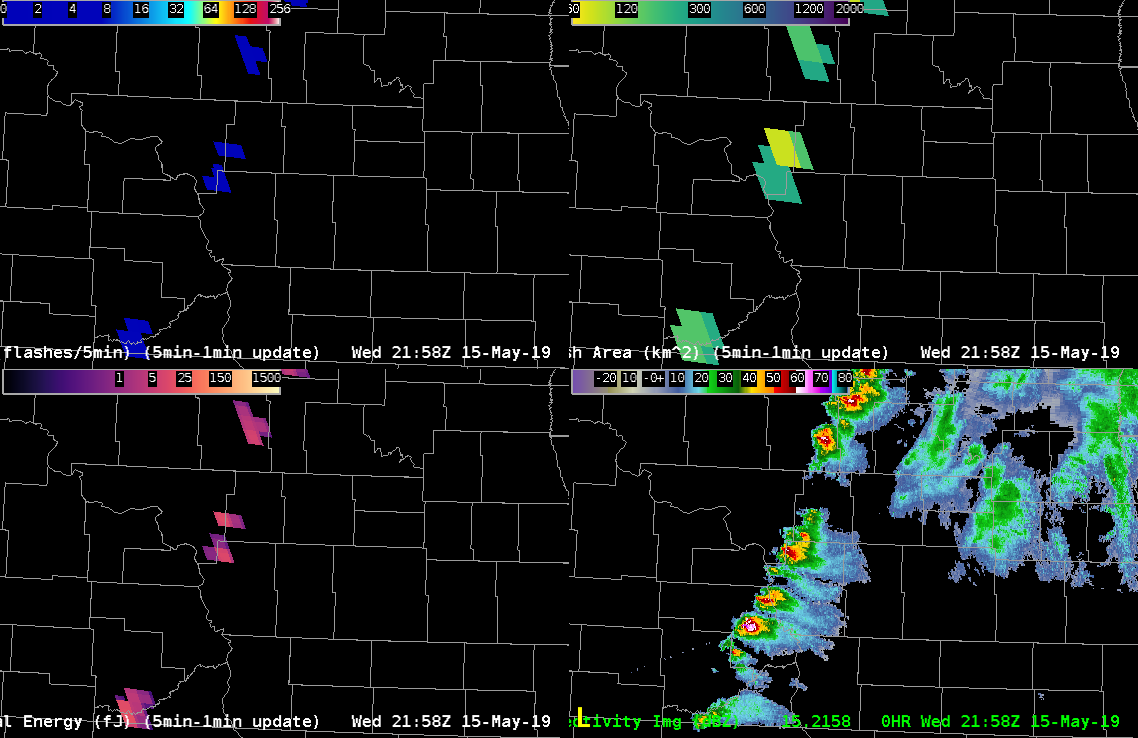
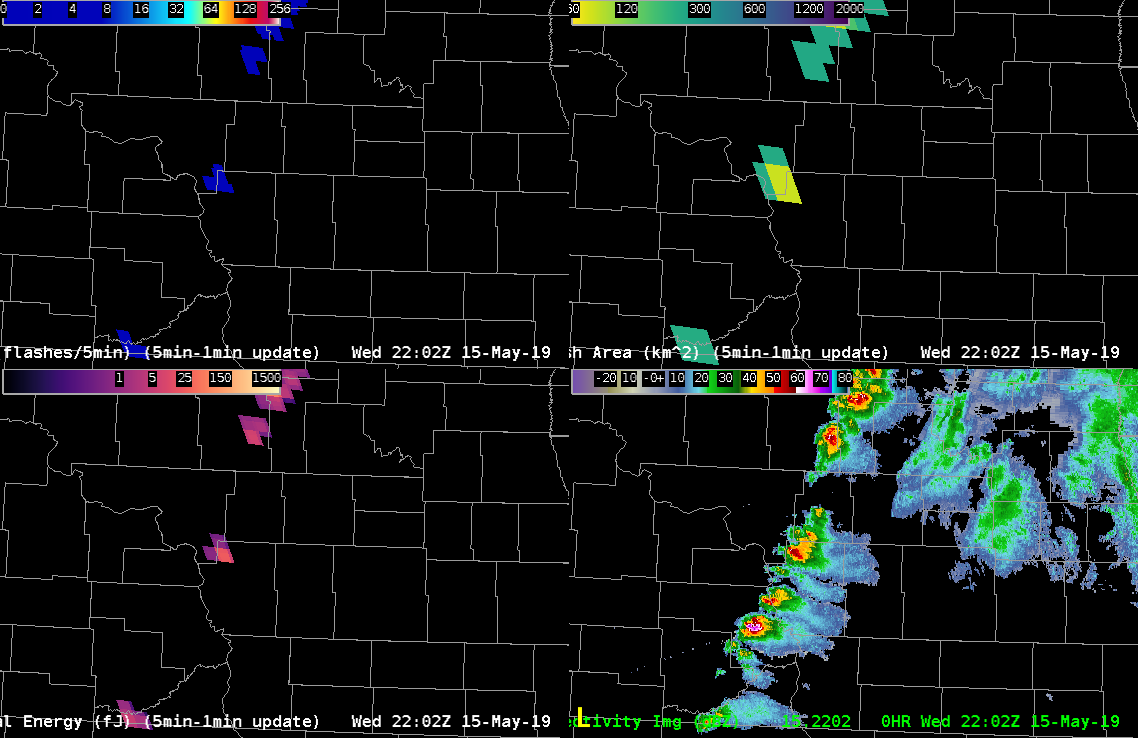
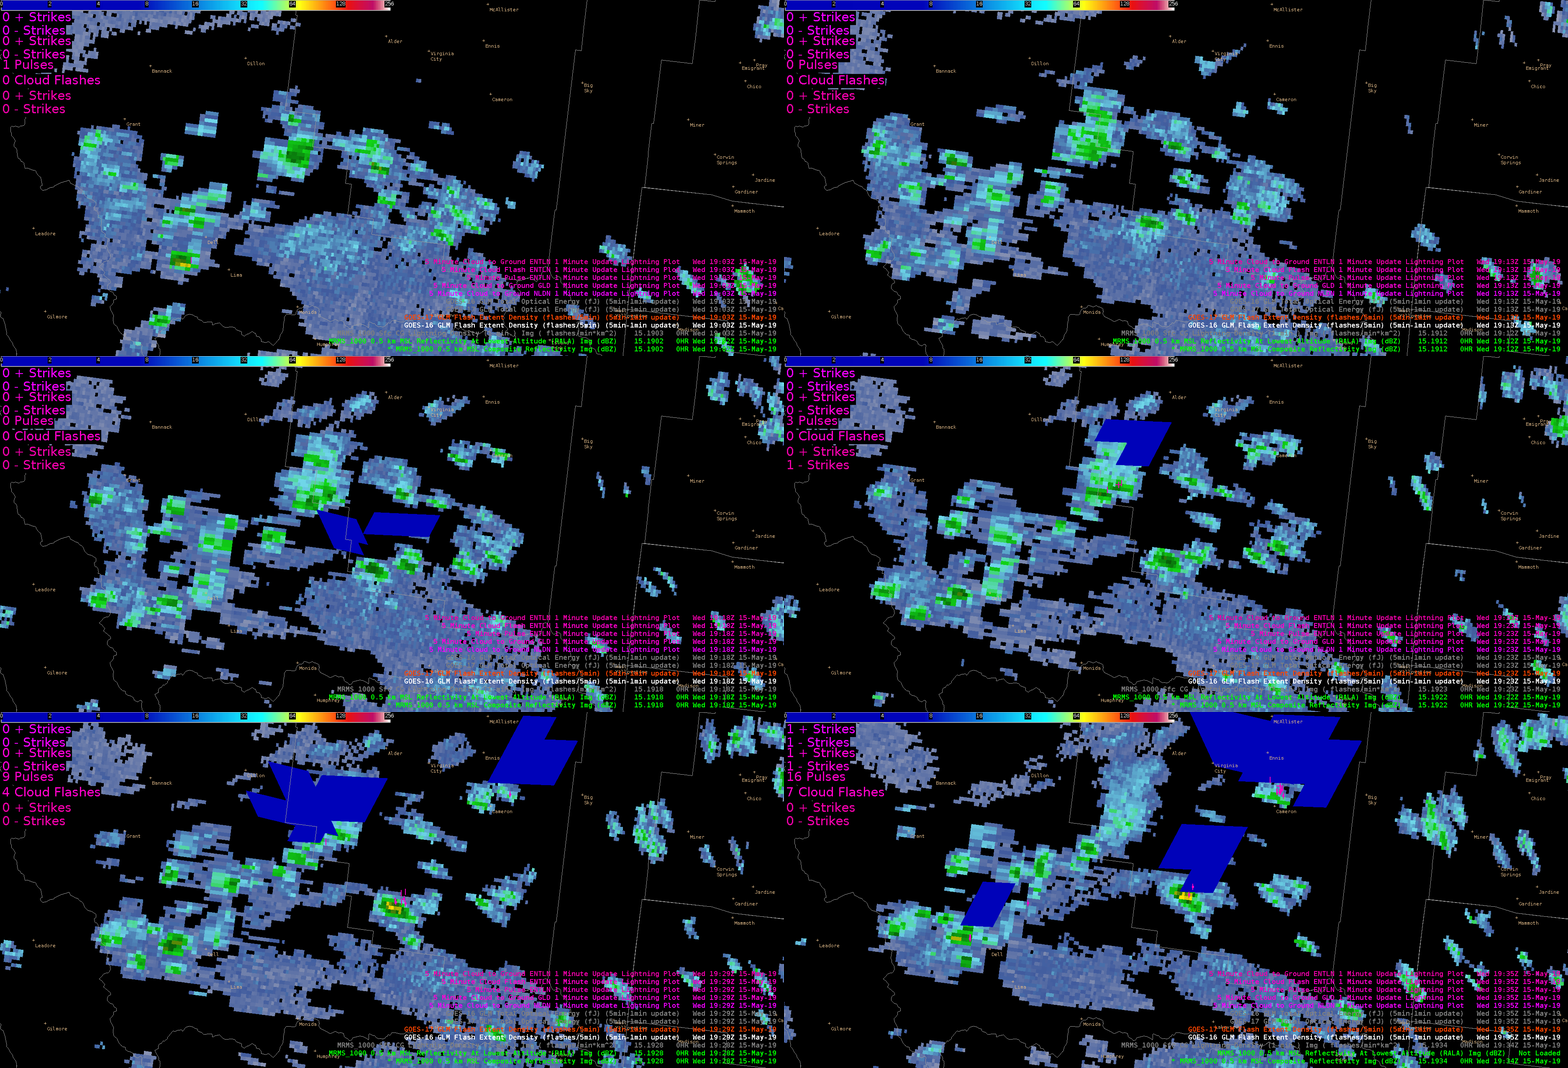
It’s pretty clear to me that both the GOES-west and GOES-east are having a lot of trouble detecting lightning (GLM) in the northwest U.S. with accuracy of location or frequency due to parallax, spatial resolution, and GOES tilt sampling of storms. Below is an animation specifically over southwest Montana where the GLM displaces the FED significantly (side note: TOE was very similar for these, so FED is shown for best example), and also has trouble picking up in-cloud pulses. The ENTI is overlaid in pink to show the differences in GLM vs ENTI. If you watch closely, the first frame depicts an ENTI in-cloud lightning flash & pulse in the far southwest portion of the screen, where no GLM FED (or TOE; not shown here) was even detected. There is also some instances where the GLM places lightning pixels where the ENTI or NLDN does not show anything in the same time frame (also making it hard to verify both products).
 

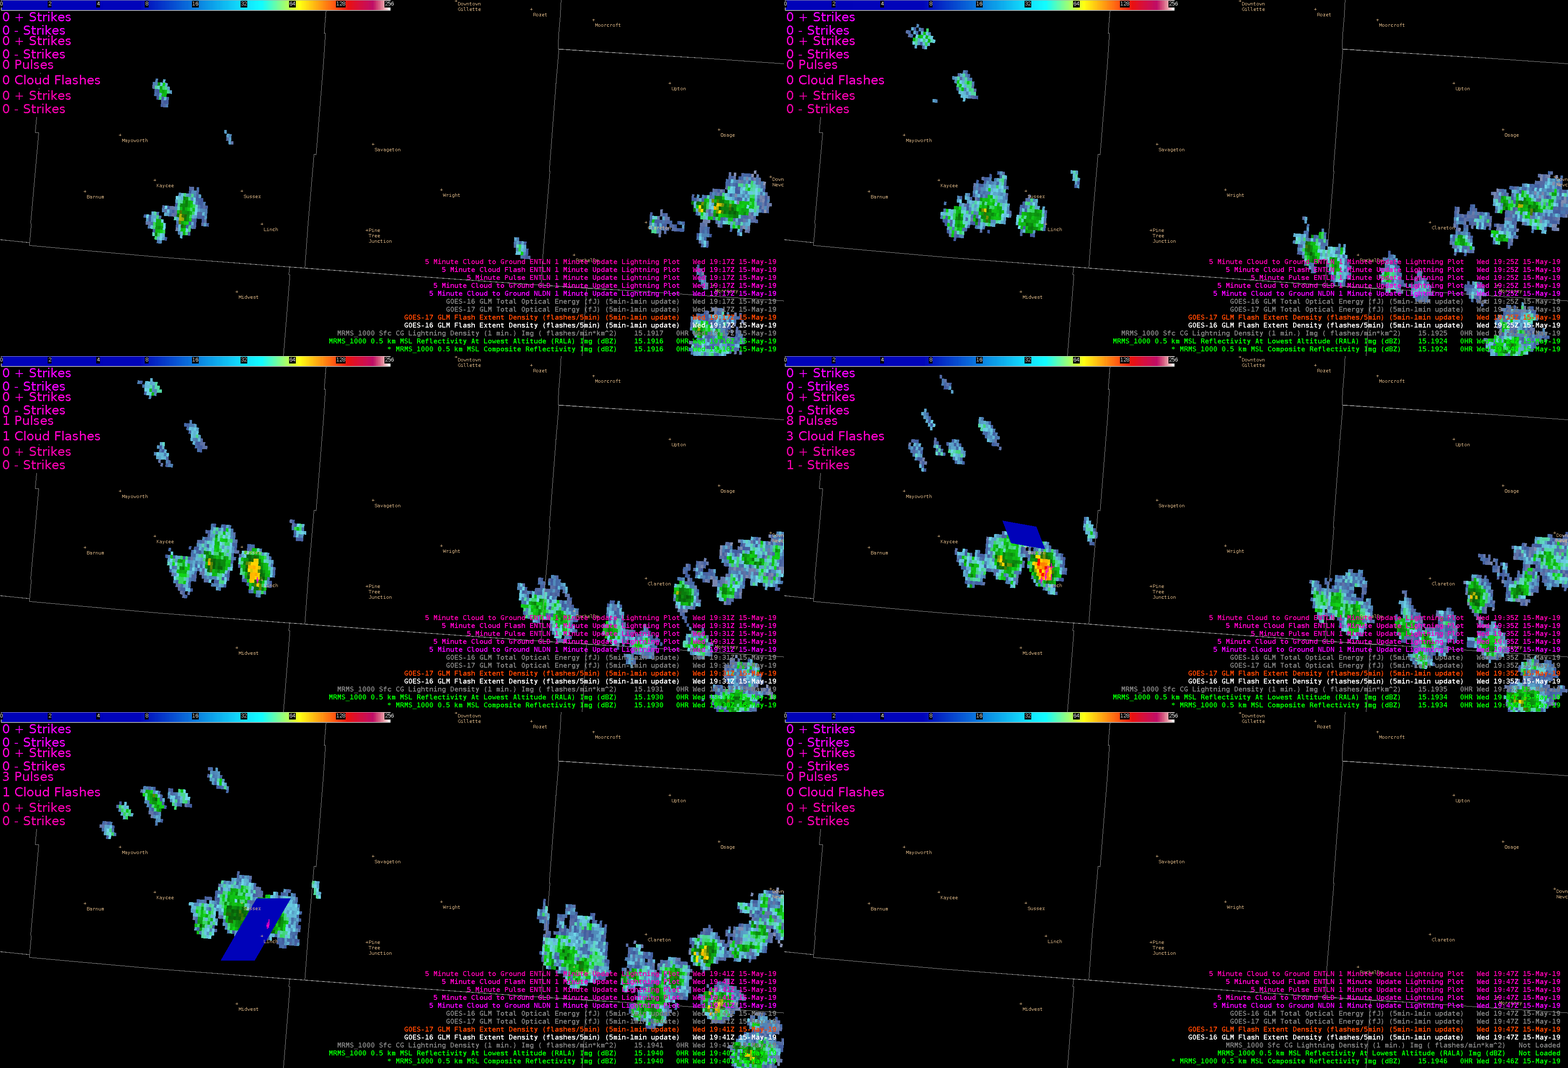
Below is a separate example where the FED does not show what I would expect it to show for a central Wyoming storm (differentiating intensity as well as location and timing). The GOES-east is the first to detect, then the GOES-west detects thereafter. GOES-east and GOES-west did not detect at the same time in any frame. Both products are loaded as a 5min-1min update.
 

Now here’s a case farther south in New Mexico where a storm cell is of comparable intensity as the northern examples. The GLM detection seems more accurate than the MT case, but the last frames here show that the GLM also has trouble with keeping FED on the cell core of interest.
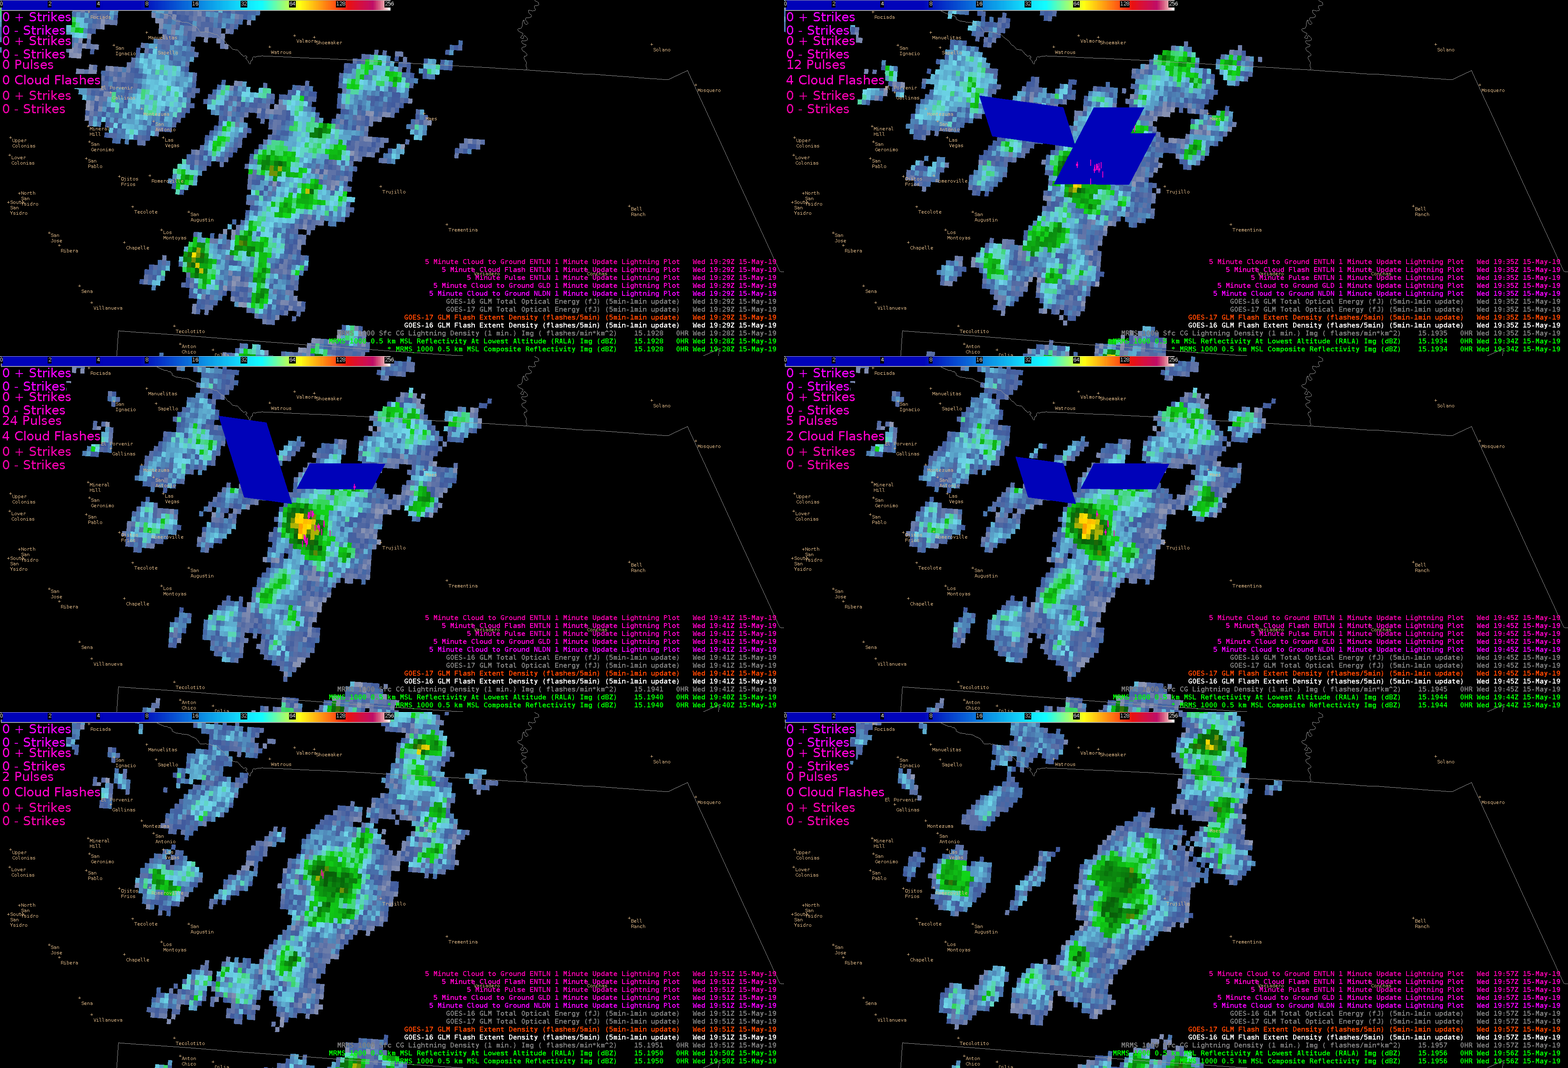
Interestingly enough, the TOE (shown below) does a better job here  in NM with spatial coverage than it did up north in MT, but still has displacement issues comparing to ENTI and MRMS storm cores. I find that the TOE (especially with GOES-west) does a better job at recognizing the spatial extent of a flash here than the FED product did. (See above vs. below).
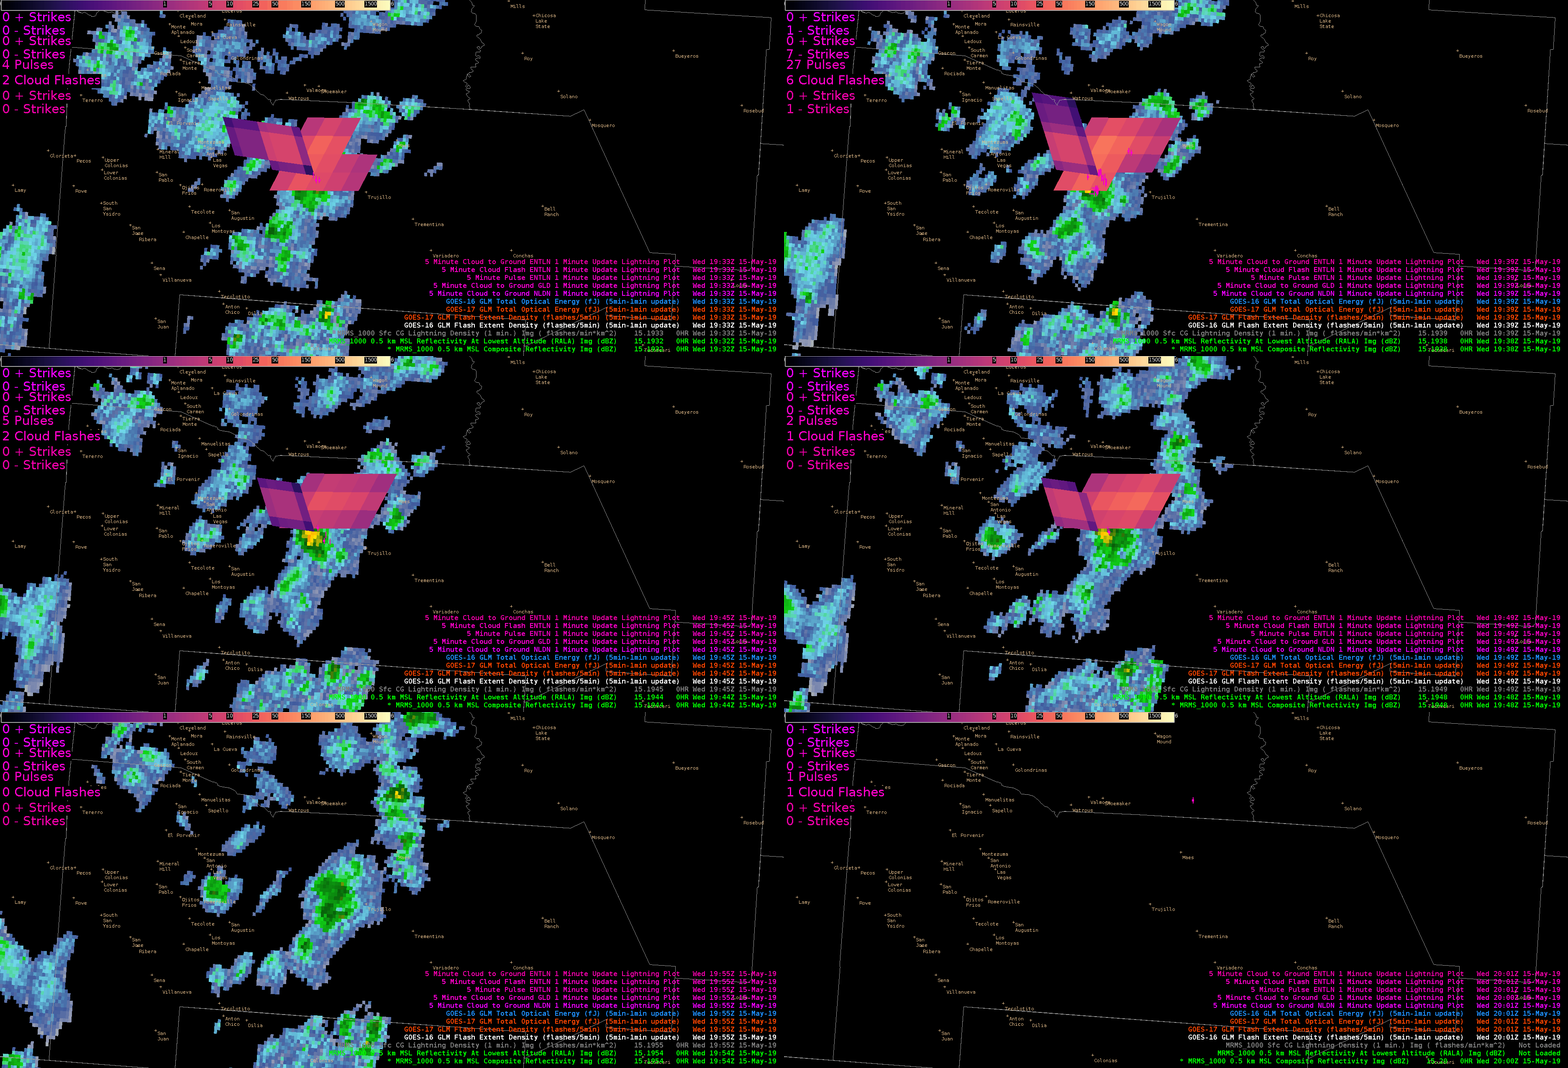
Now the question is, is the parallex better in the south-central U.S.?  And what if we look at higher resolution products like the group centroid density GLM product? While comparing the satellite GLM, with Day-Land-Cloud-Convection RGB, and with the ENTI/GLD/NLDN strikes (overlaid in pink) in SE Missouri…..it’s clear that a forecaster should not solely rely on GLM for core lightning locations (below). -shearluck