NMDA sensitivity issues. No anticyclonic detection either.

This will be a great case study to follow up on with the NMDA:

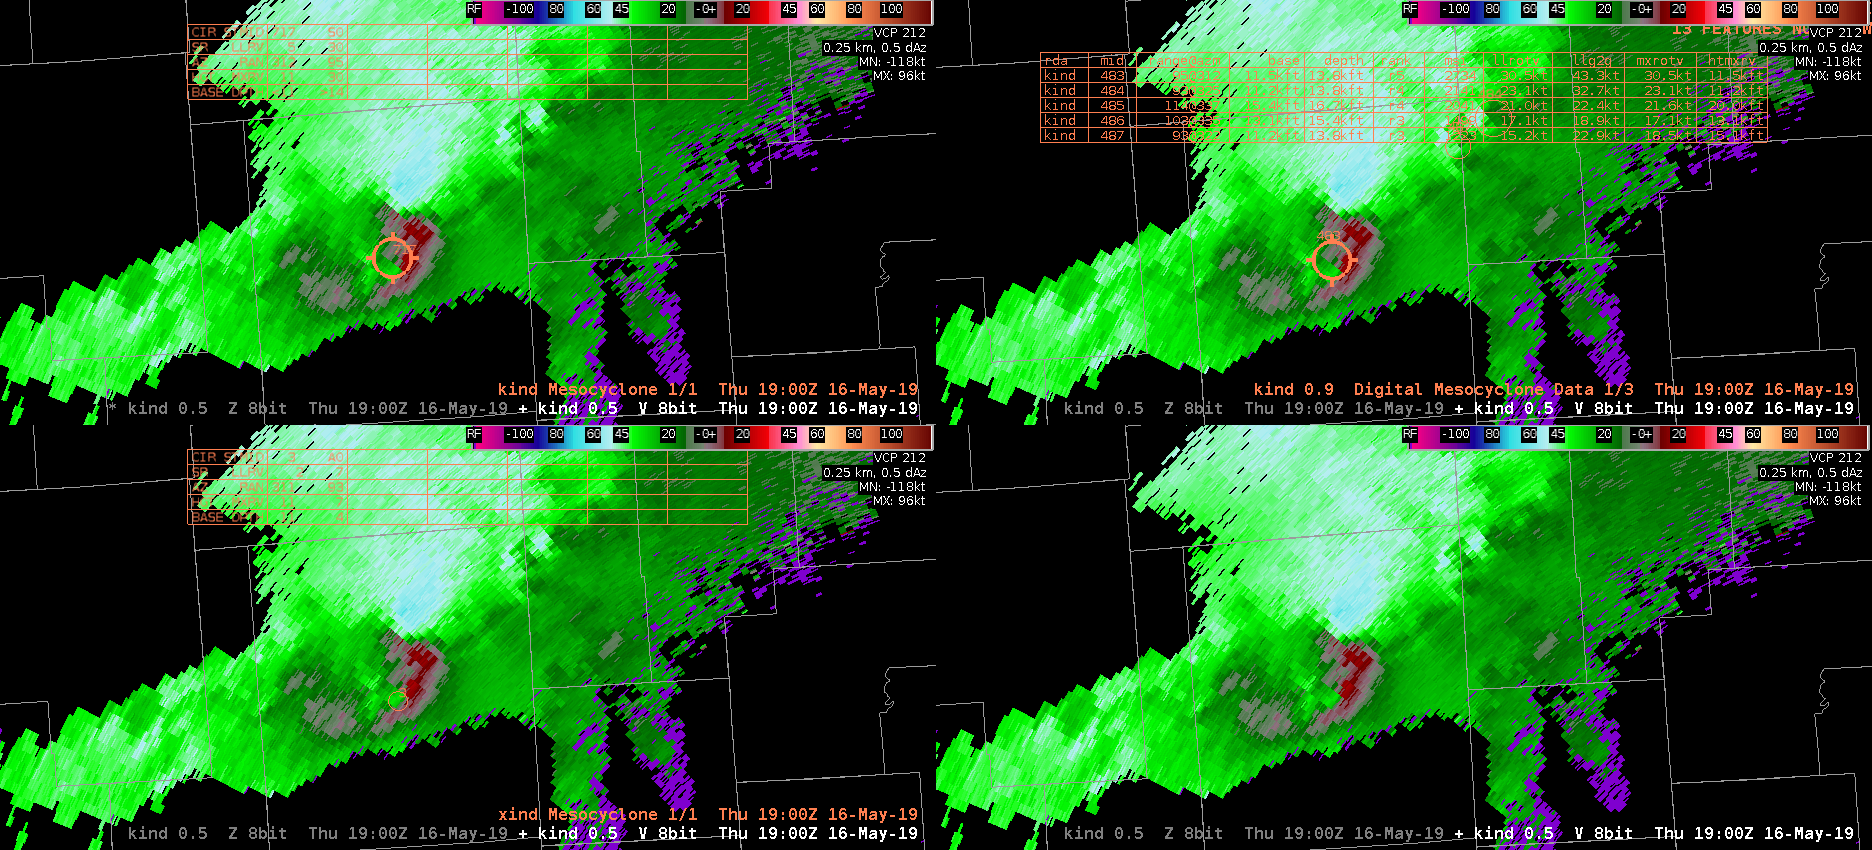
As we were watching the differences between the NMDA compared to the MDA and DMD on a QLCS/squall event over east-central Illinois/northwest Indiana, we noticed some differences in circulation detection. Particularly, it was noted that the detection sensitivity was poor when there was a strong anticyclonic circulation present aloft (KIND ~100nm southeast of storm; 0.5deg; 12kft AGL). Interestingly, all 3 of the algorithms picked up on the weaker cyclonic circulation instead; all with different sizes and intensities.

See below 1847Z: MDA upper left, DMD upper right, NMDA lower left.
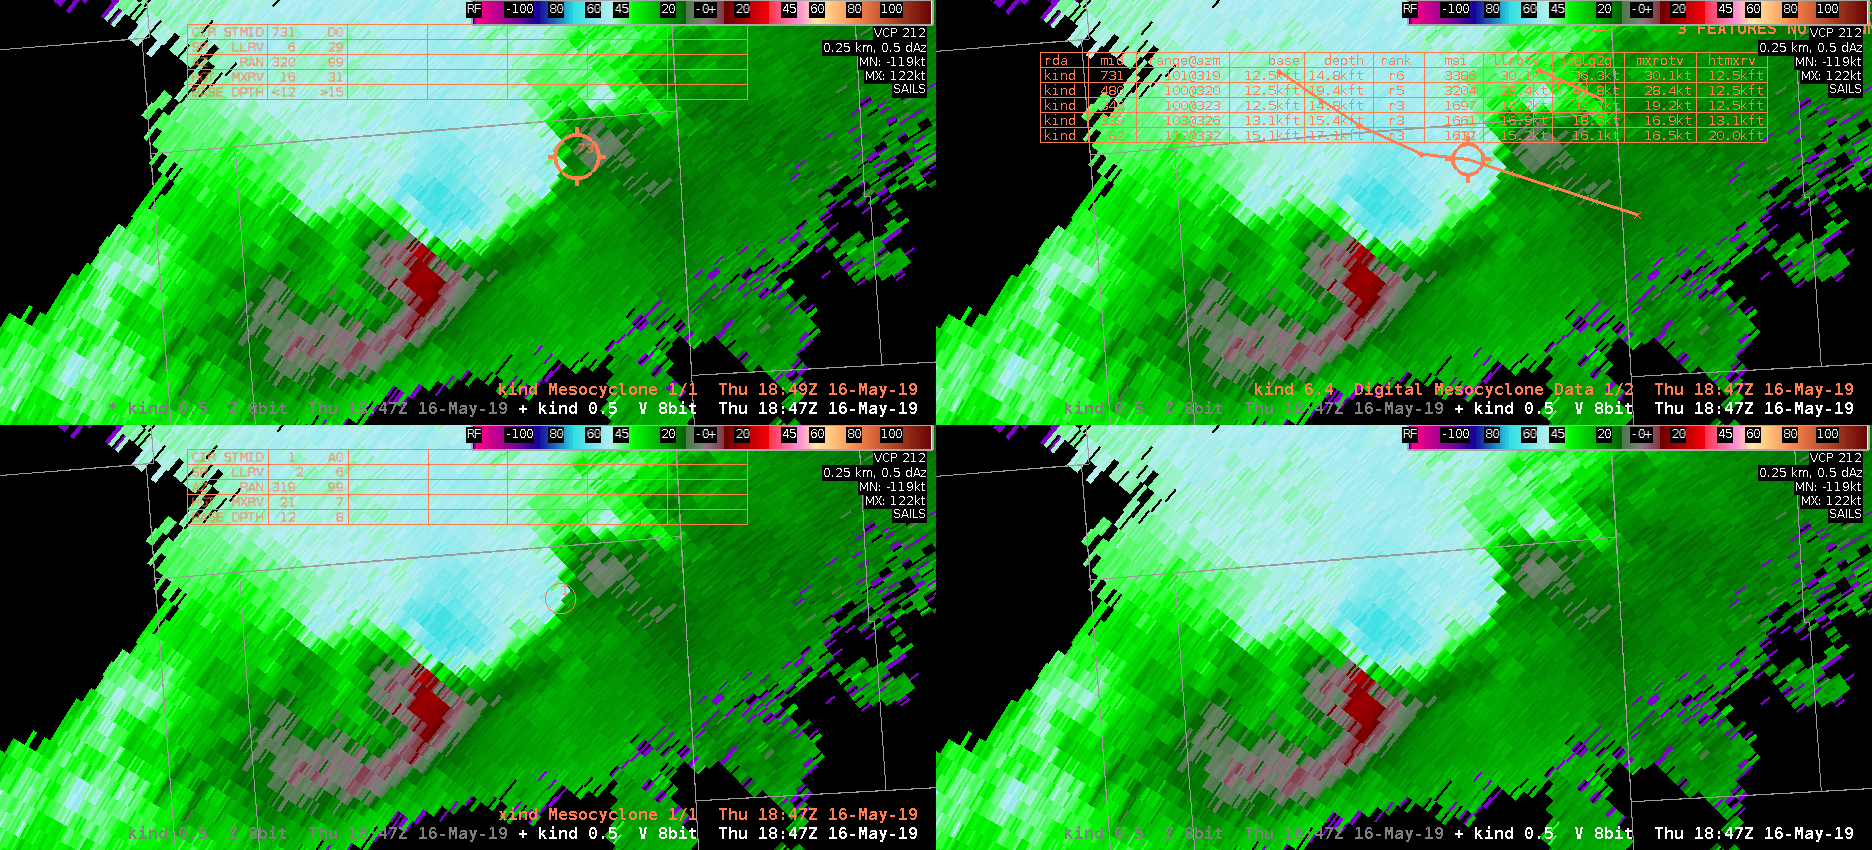
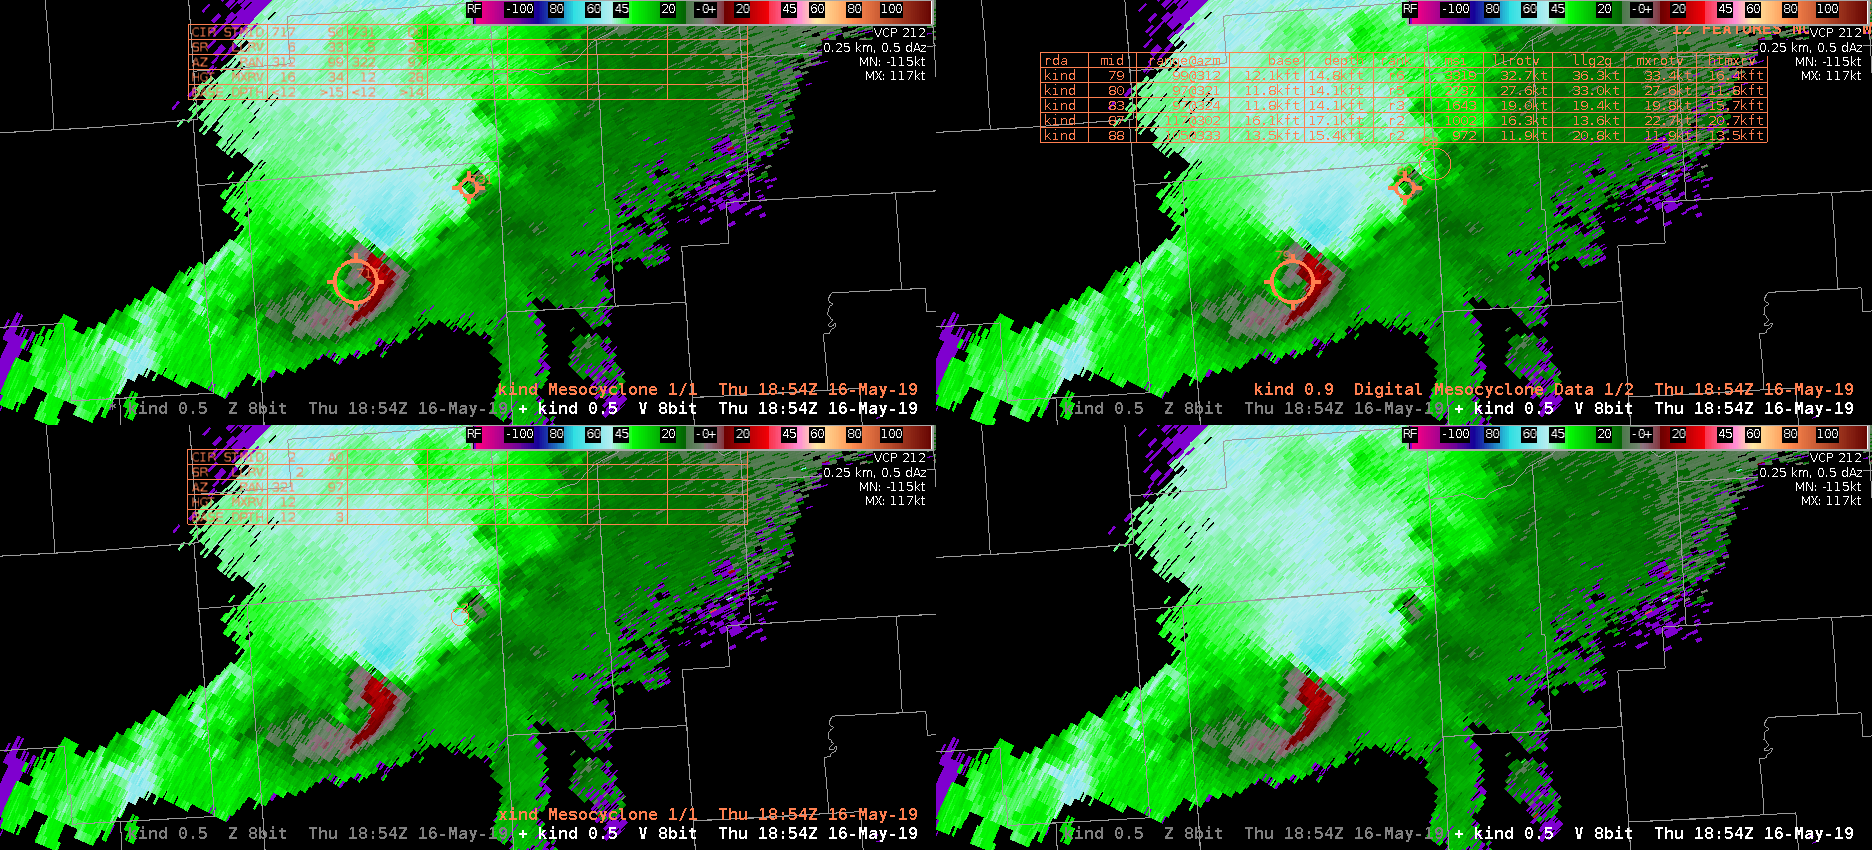
Image below 1854Z: As the storm progressed and started having a cyclonic rotation associated with the area of interest right next to an anticylconic area of rotation, the MDA (upper left), DMD (upper right), picked up that particular circulation first. The NMDA (lower left) was still slow to grasp onto this very strong circulation aloft that could have a Severe lead time significance as the rear inflow and convergence strengthens.
Looking several radar scans forward now below (1900Z), the NMDA finally recognizes significance of this large feature (see below; lower left panel). However, it is still does not signify a strong circulation as denoted by its tiny circle. I’m curious about LSRs during this time.
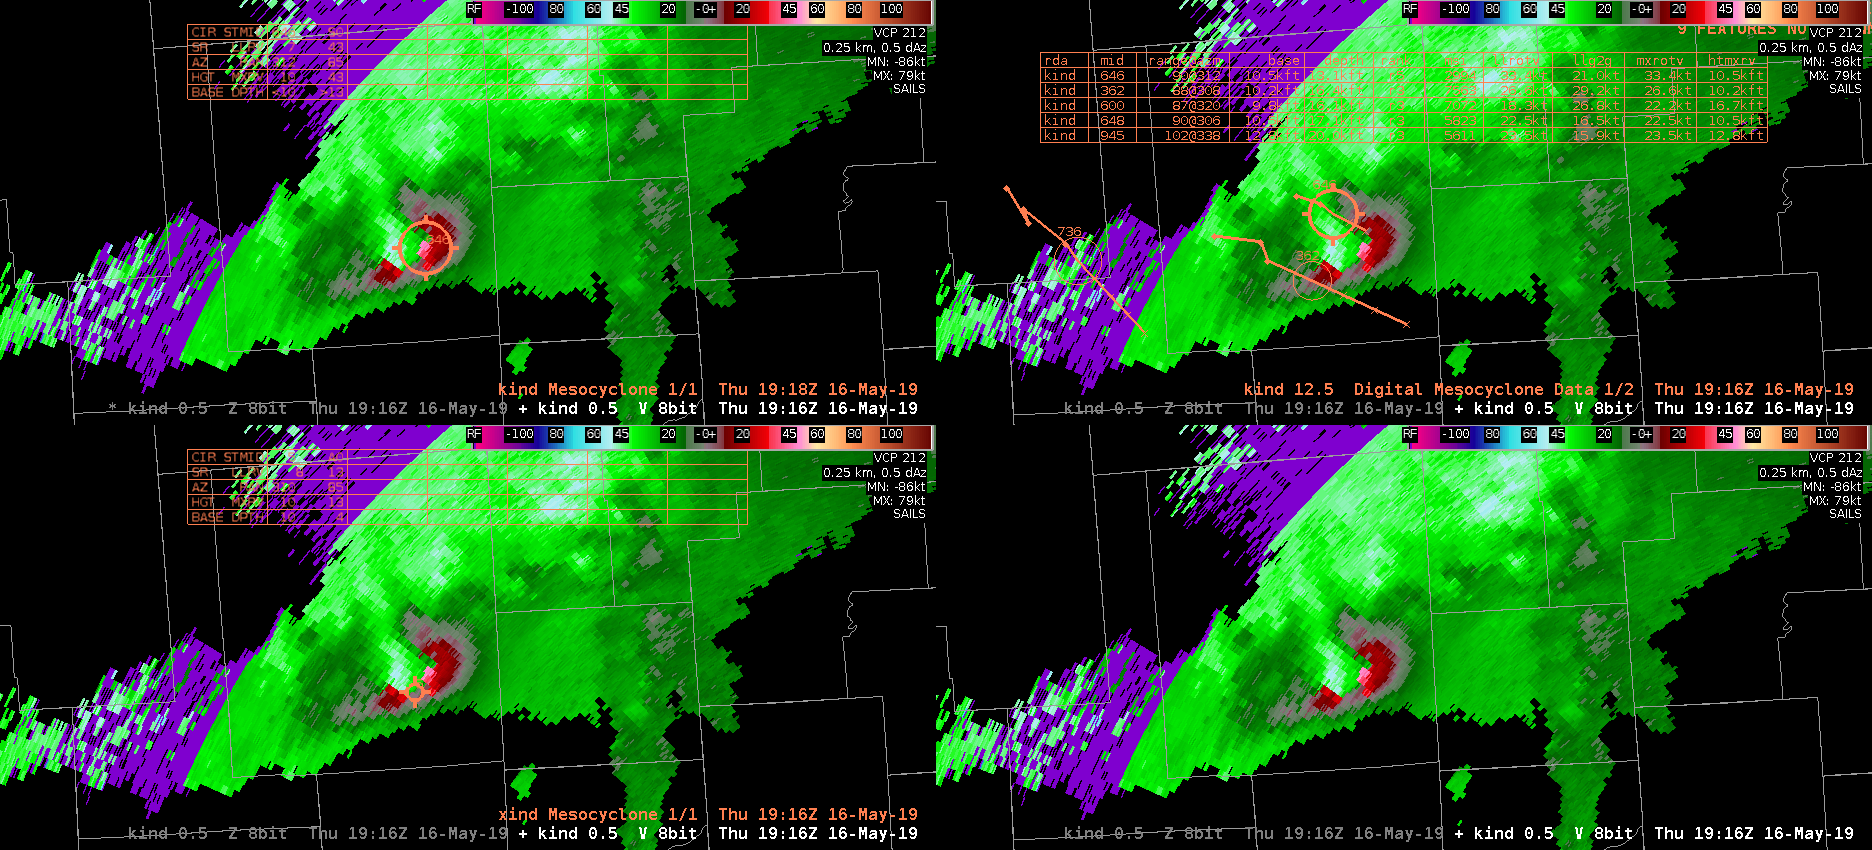
Finally, 16 min later (1916Z see below; 11kft AGL), the NMDA finally shows a significant circulation center due to a strong descending rear inflow jet/notch. I would suggest that the NMDA does not give me a lot of lead time confidence in issuing a severe thunderstorm warning in this instance (probwind showing over 90% at this time). NMDA only seems to help give confidence once it detects the feature after it has already evolved. What’s also interesting to note from the below image is that the DMD and MDA picked their denotations on (only) the cyclonic circulation, whereas the NMDA only seems to centrally focus on a weird convergence region and not the cylconic side of this lowest scan velocity data (i.e. more localized for NMDA). None of the products seem to attract to the anticyclonic side, which actually strengthens with time due to the descending notch. -shearluck
IDSS Usage from GLM/Minimum Flash Area

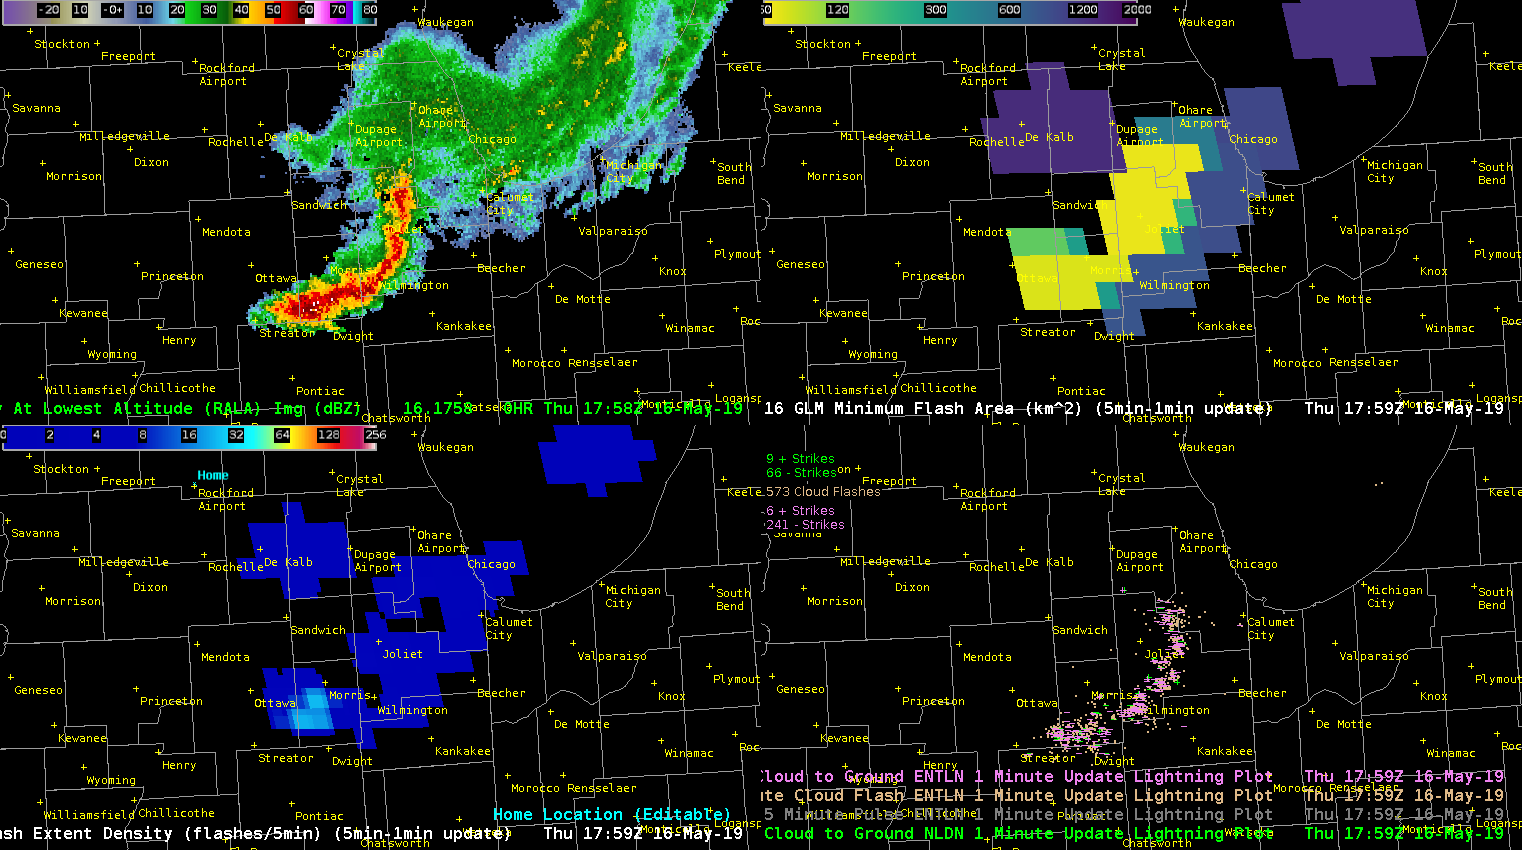
An MCS shifting southeastward across northern IL was producing quite a bit of lightning, and much of it was moving through the southwest portion of the line per Flash Extent Density. From a IDSS standpoint, the Minimum Flash Area and FED proved that it’s necessary to look at both GLM products and ground based lightning products to see the “total” picture. The GLM products captured a larger flash that extended out into the stratiform area behind the main line that is not seen in the ENTLN and NLDN products. This information can be especially important for Airport Weather Warnings and/or outdoor venues. You can easily see that the flash extends almost back to the Rockford Airport, while the main line and most of the flashes are ~80 miles away. In other words, areas near Rockford Airport are not out of the woods yet for lightning.

Clockwise from top left: RALA, Minimum Flash Area, NLDN and ENTLN Lightning Plot, Flash Extent Density

-Tempest Sooner

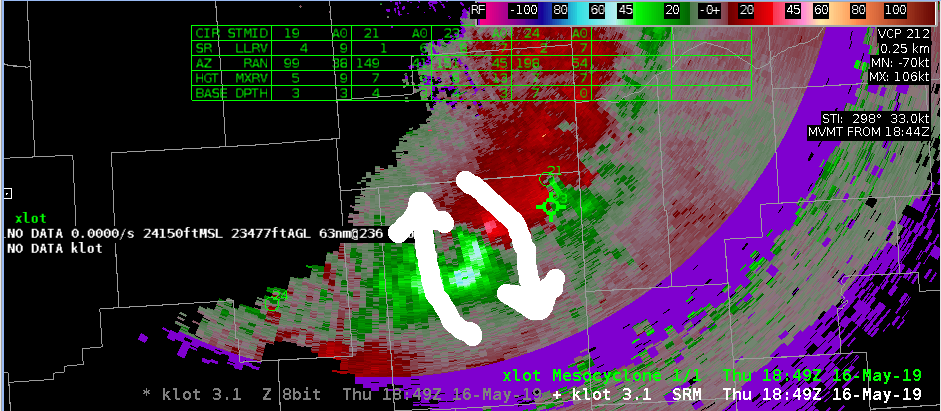
NMDA QLCS Anticyclonic Meso

A strong anti-cyclonic mid-level meso developed near the southern end of a QLCS south of Chicago (view form KLOX). NMDA did not pick up on this feature. Would definitely want to have this detection since a warning forecaster may not quickly pick-up on a developing mid-level circulation if they are closely watching for low-level mesovortex spinups, and this may be important in hail development as well as focusing and outflow wind surge.

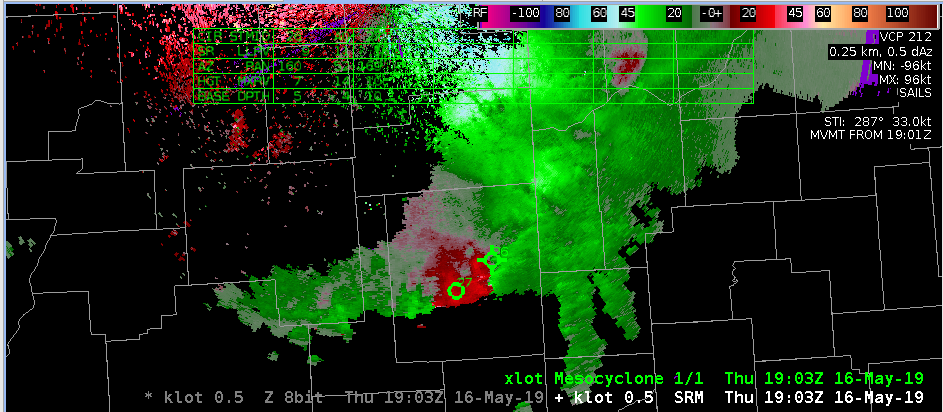
11 minutes later on the 0.5 degree tilt, one the developing rear inflow jet starts to develop, the NMDA keys in the developing low-level cyclonic circulation. However, the additional 11 minutes of being alerted to the developing mid-level meso could help extend warning lead times.

— warmbias —

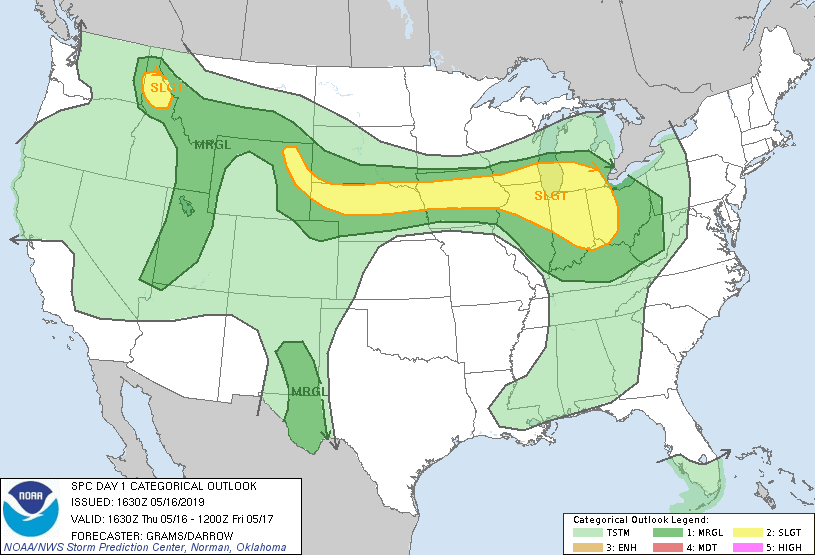
Slight Risk West and East

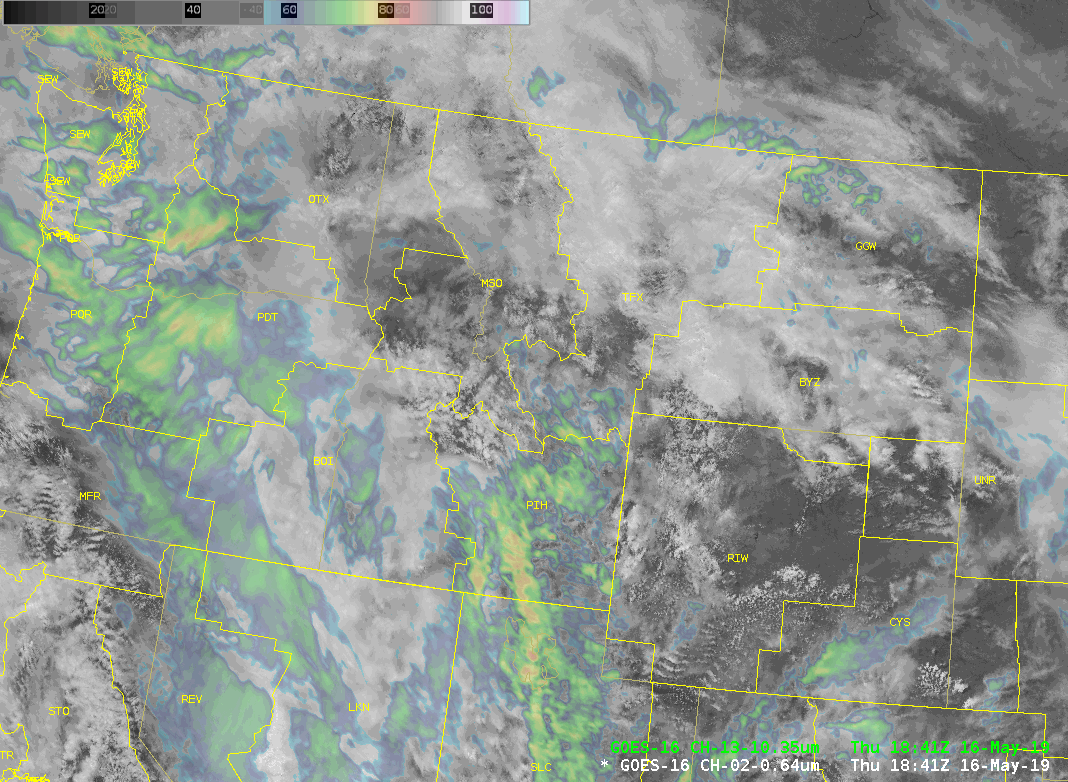
Operating across the CONUS today with one team of forecasters located in Idaho/Montana in MSO and the other in Illinois (ILX).  The forecasters have also been encouraged to investigate the environments nearby their official CWAs including the ongoing MCS currently crossing the Chicago CWA.

SPC Day 1 outlook for 16 May 2019

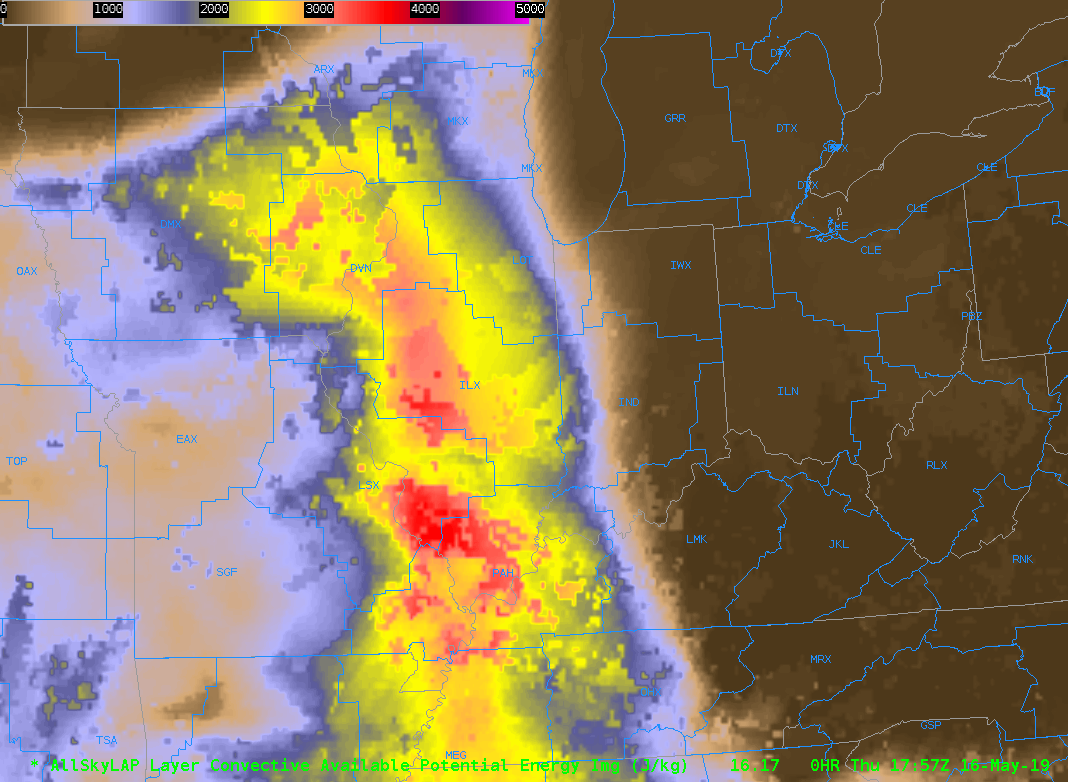
For those in Illinois, the environment remains supportive of development  off of outflows from the ongoing MCS or other possible convection.   Though it remains likely that the MCS will continue to remain strong and pose  a threat for strong winds at least across the NE section of the CWA.

All Sky LAP CAPE

For Idaho, it currently remains rather calm, but the CAMS have consistently latched onto expected convection later in the day including supercell storms.

Sandwich IR/VIS product for Western United States


-Kristin


Tags: None

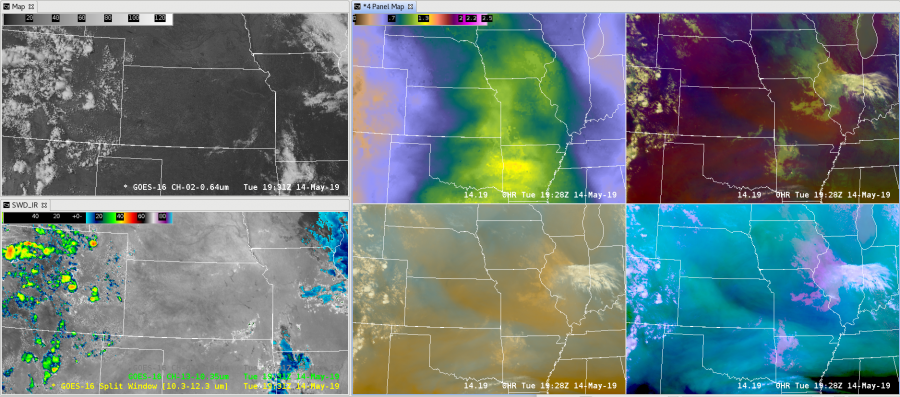
Comparing SWD with All Sky LAP PWAT

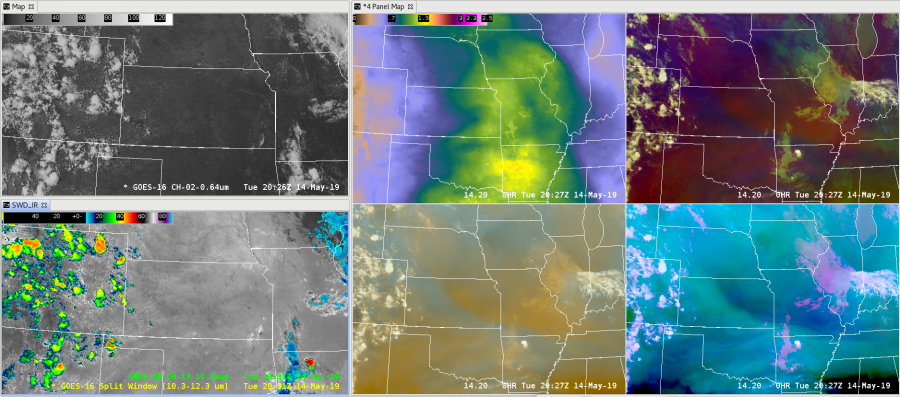
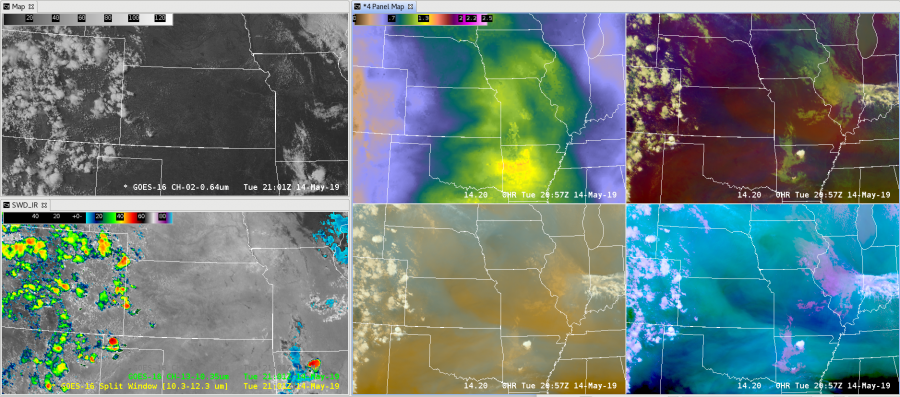
Trying to see how well AllSkyLAP Precipitable Water (upper middle pane) responds to subtle changes in low level moisture. The lower left is Split Window Difference (SWD) and upper left is visible imagery as a sanity check for no cloud cover. Also have airmass RGB (upper right) and differential WV RGB (bottom center) for comparison.

Note some slight darkening over KS possibly associated with some deeper subsidence seen on the diff W/V RGB.


Pinwheel Fronts In The Dakotas

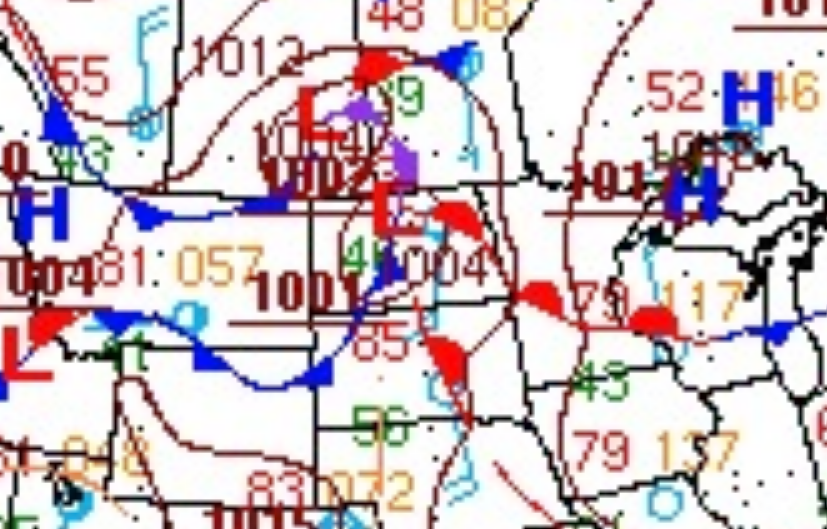
Mid afternoon into early evening saw a bretty good bloom of supercells along a SSW-NNE Cold Fronf in North Dakota…

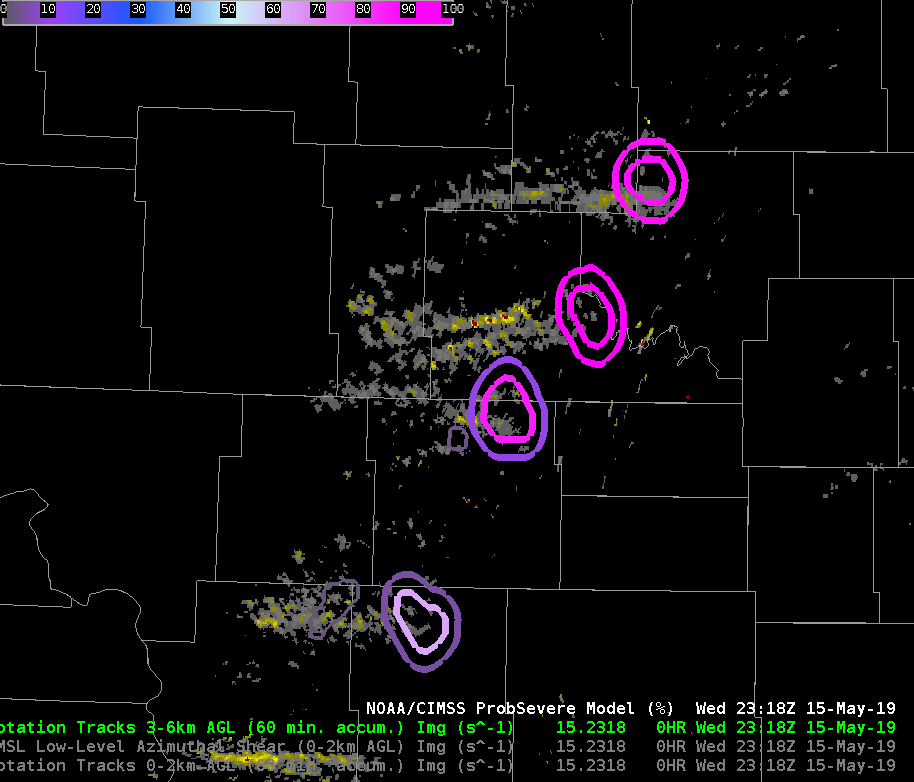
Thru the period the SVRProb and SVRtor seemed to regularly over warn during this outbreak, BUT SVRHail was spot on, a little False Alarm-y, but it sure didn’t miss the Large Hail reports, with %s >90 both instances.  The RGB Day Convection GOES product seemed to respond pretty well with the hail instances as well.
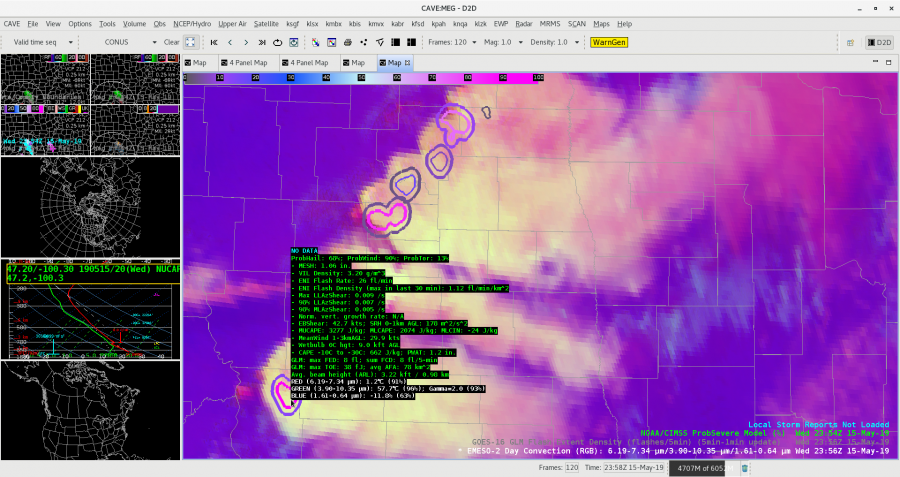
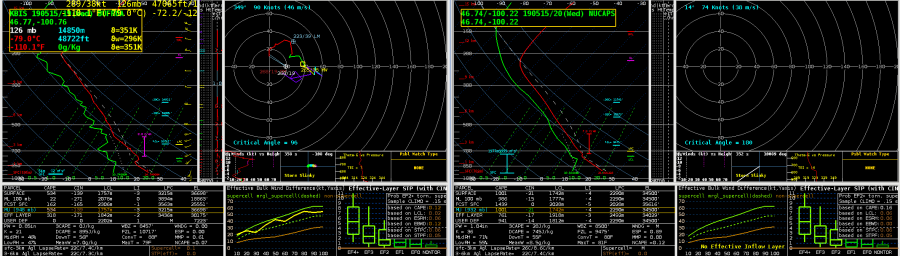
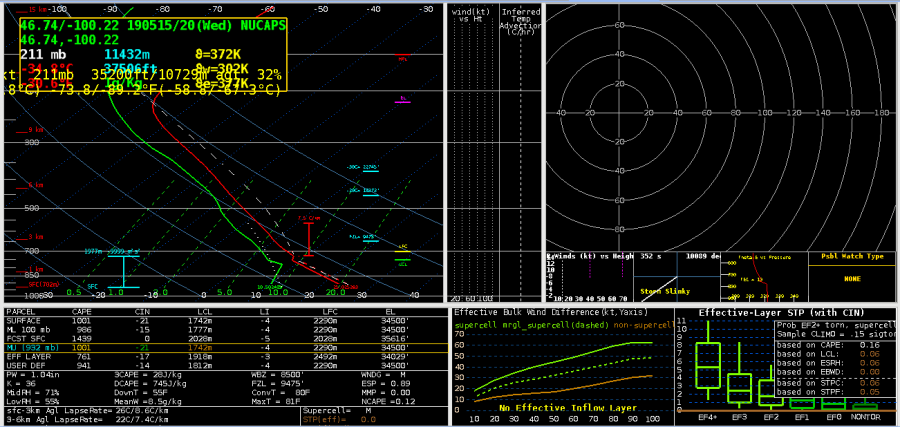
Afternoon NUCAPS over forecast the CAPEs by ~ 500, PW by 0.2″, did well with the Downrush temp and DCAPE tho.

Above Anvil Cirrus Plumes and GLM

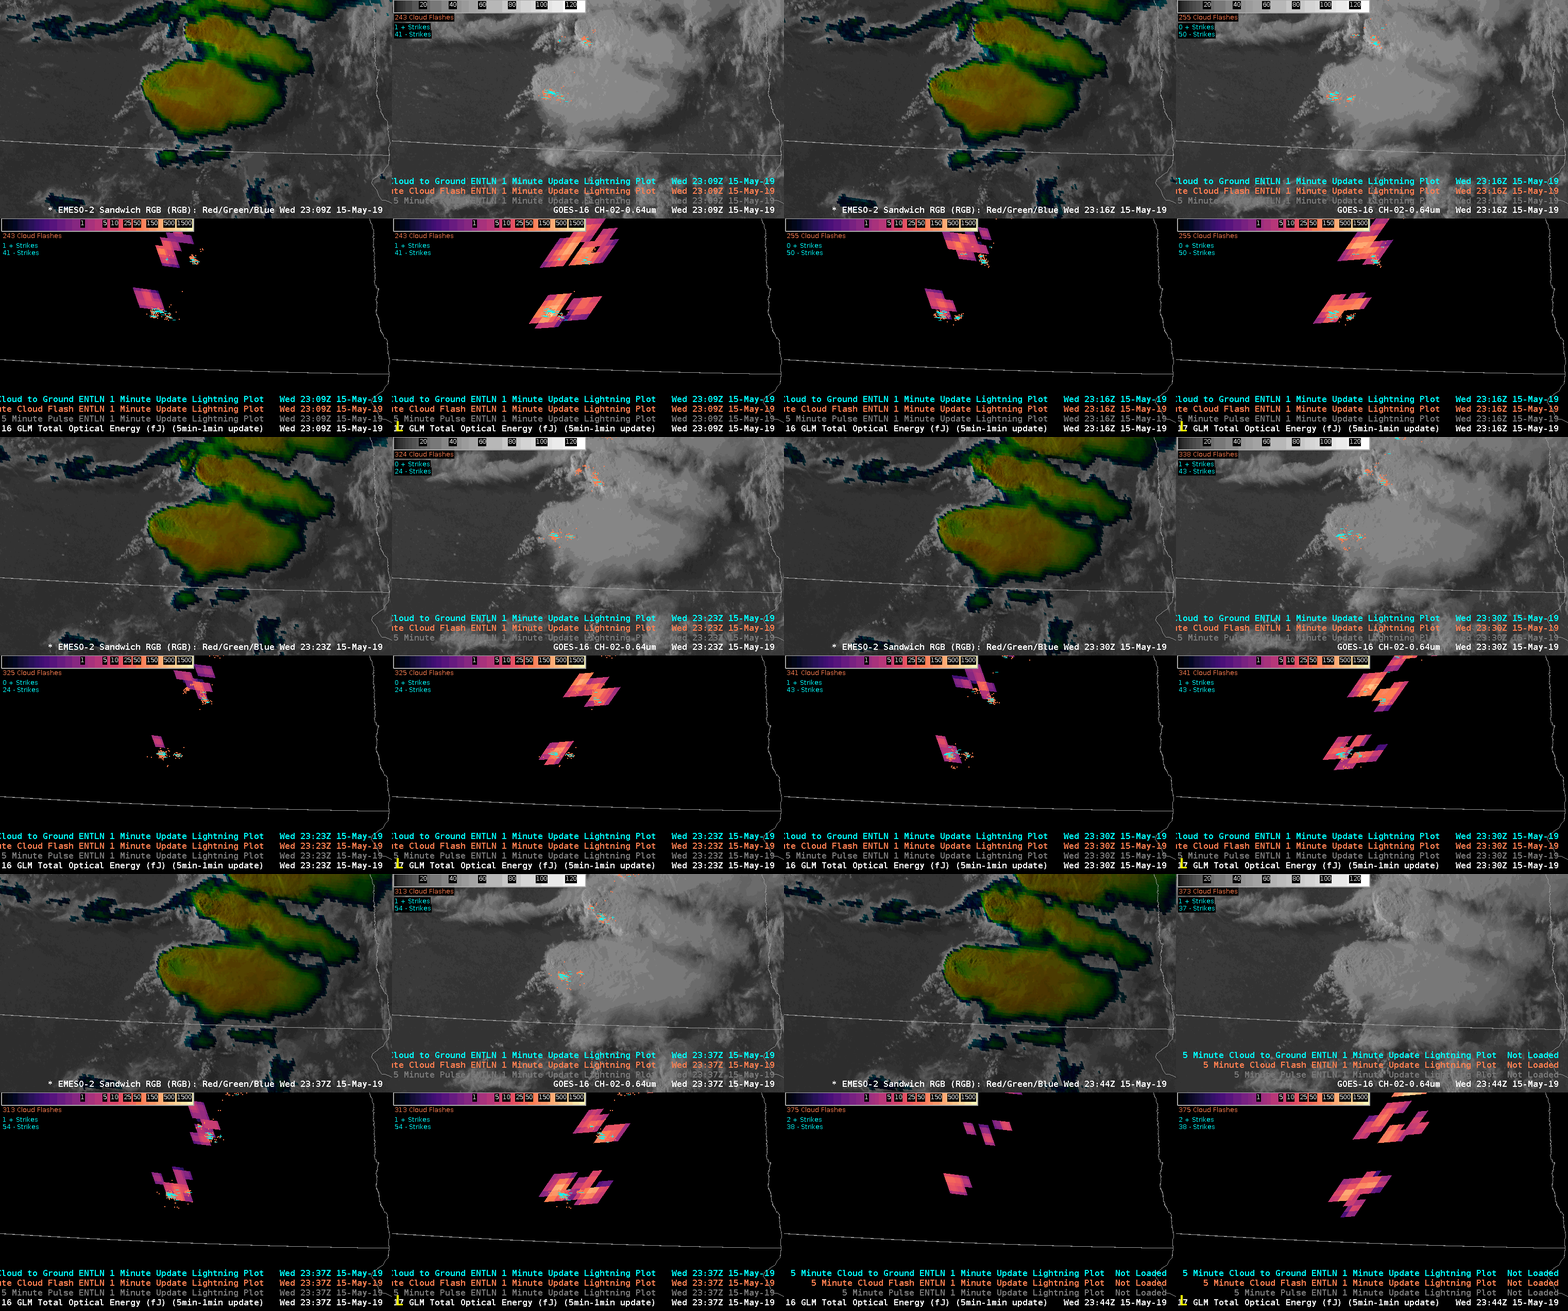
This post will ask more questions than make assertions 🙂 We currently see evidence of a weak above anvil cirrus plume (AACP) based on the GOES-16 Sandwich RGB (upper left) and CH02 visible (upper right). Total Optical Energy from GOES-16 (GOES-17) is plotted on the lower left (right).  For reference, three of the four frames have 5 minute ENTLN data.

I’ve wondered if an AACP could extinguish a significant amount of Total Optical Energy (TOE) if lightning was occurring underneath. There are too many caveats here to draw any conclusions, such as:

  1. Extreme viewing angle for both GOES satellites resulting in significant parallax.
  2. A large viewing component of the sides (instead of just the tops) of the storms, resulting in possibly large and highly variable reflectances that might be harder to calibrate TOE against.
  3. Uncertainty regarding ENTLN efficiency and accuracy this far at the fringe of the ground network.

So, with all of that being said, what we see here is interesting. ENTLN does show two areas of lightning. GOES-16 picks up on the western area but not the area under the plume (at least not at first). GOES-17, on the other hand, has a better grasp  on there being two areas throughout.

I hypothesize that GOES-16 is struggling more in this particular scene because of the large reflectance and possible forward scattering issues that GOES-17 is not as susceptible to at this particular time of day.

Again, this is not a great setting to test any hypothesis about how much an AACP is able to throw a blanket over GLM detections. However, I’m confident that next week will provide many opportunities to test this with extremely stout AACPs at far more optimal latitudes.

#MarfaFront


NUCAPS and AllSky Helpful in BIS

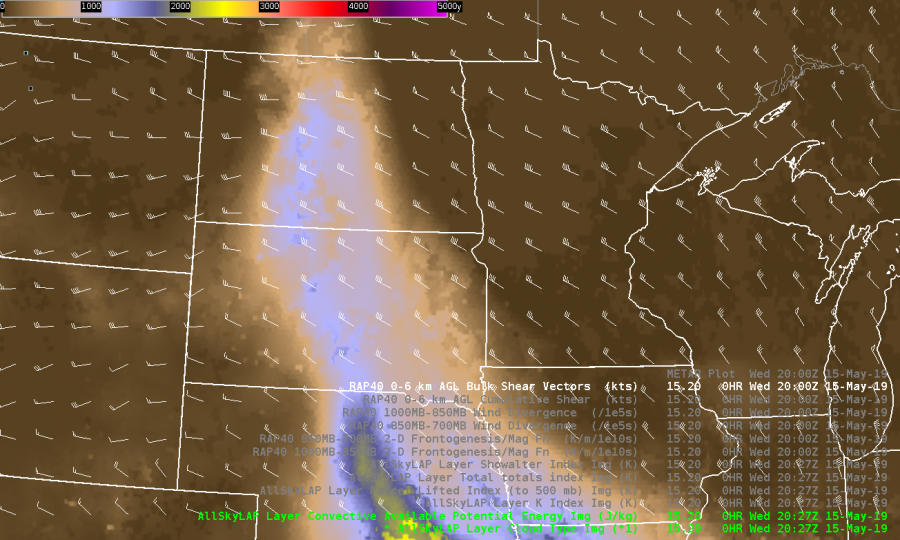
NUCAPS and AllSky both were helpful in tracking the afternoon destabilization over North Dakota today. Both data sources provided what seemed to be fairly accurate assessments of CAPE values. Clear sky and GFS retrievals in AllSky were similar, with the clear sky retrievals very closely matching the NUCAPS retrievals. Having a plan view depiction in AllSky was very helpful when combined with RAP shear vectors in accessing afternoon storm potential.

NUCAPS Sounding:


— warmbias —


Prob Severe – Unrealistically High ProbTor

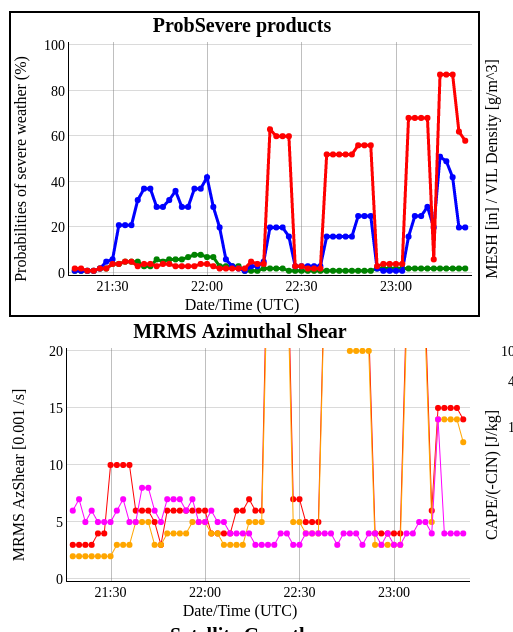
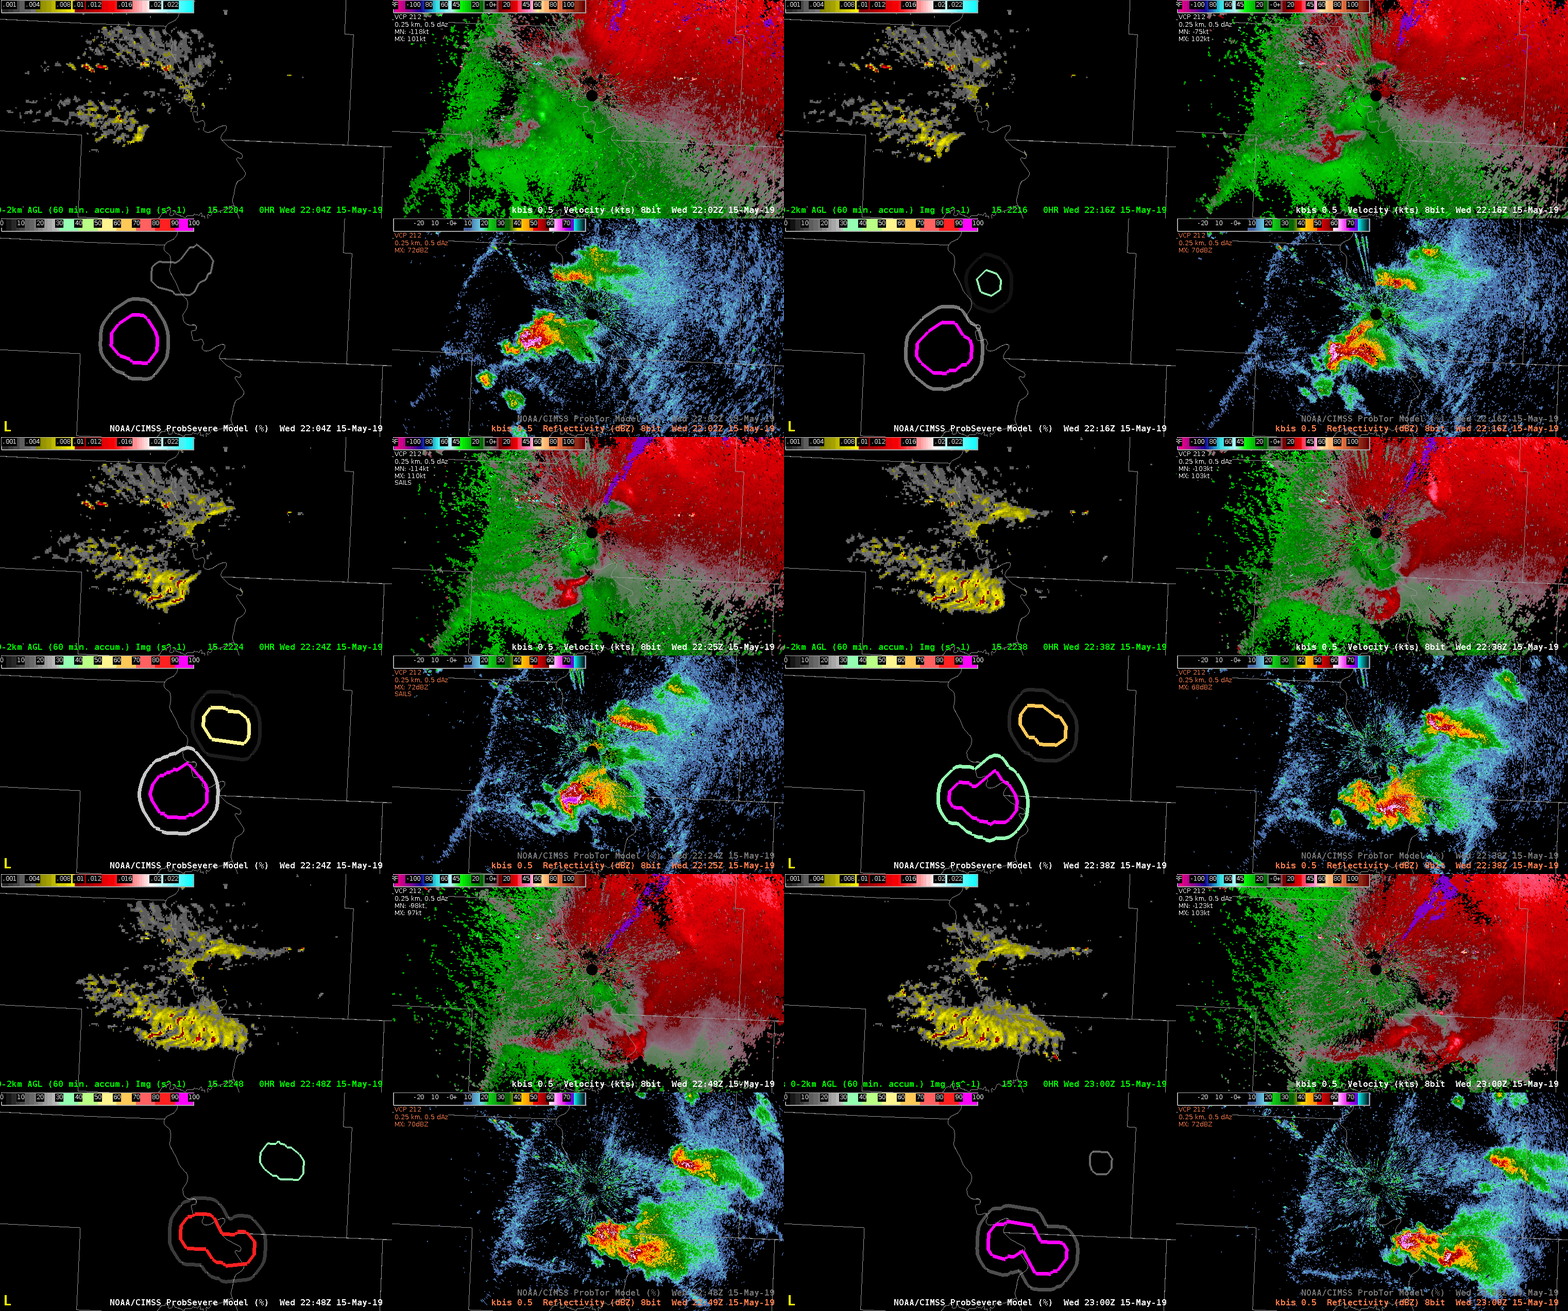
ProbTor started giving unrealistically high values in northern ND, noting very high Az Shear Values. This appears to be a problem with data QC in the operational MRMS data, as it does not appear in the Testbed data.


Looking at the time series for one of these anomalous Prob Tor values, its clear the bad Az Shear data is contributing to the jump in Prob Tor:

ProbTor Gets Schooled Again

We continue to see significant issues with ProbTor that seems directly related to inflated Low Level AzShear values. This is likely due to an outflow boundary that is extremely well sampled by the KBIS radar.  As this outflow boundary races ahead of convection, the actual tornado threat, which was never high to begin with, continues to drop even more.

ProbTor, on the other hand, places a tremendous amount of weight on LL AzShear,  resulting in a persistently high ProbTor values.


#MarfaFront