AzShear: The Good and the Bad

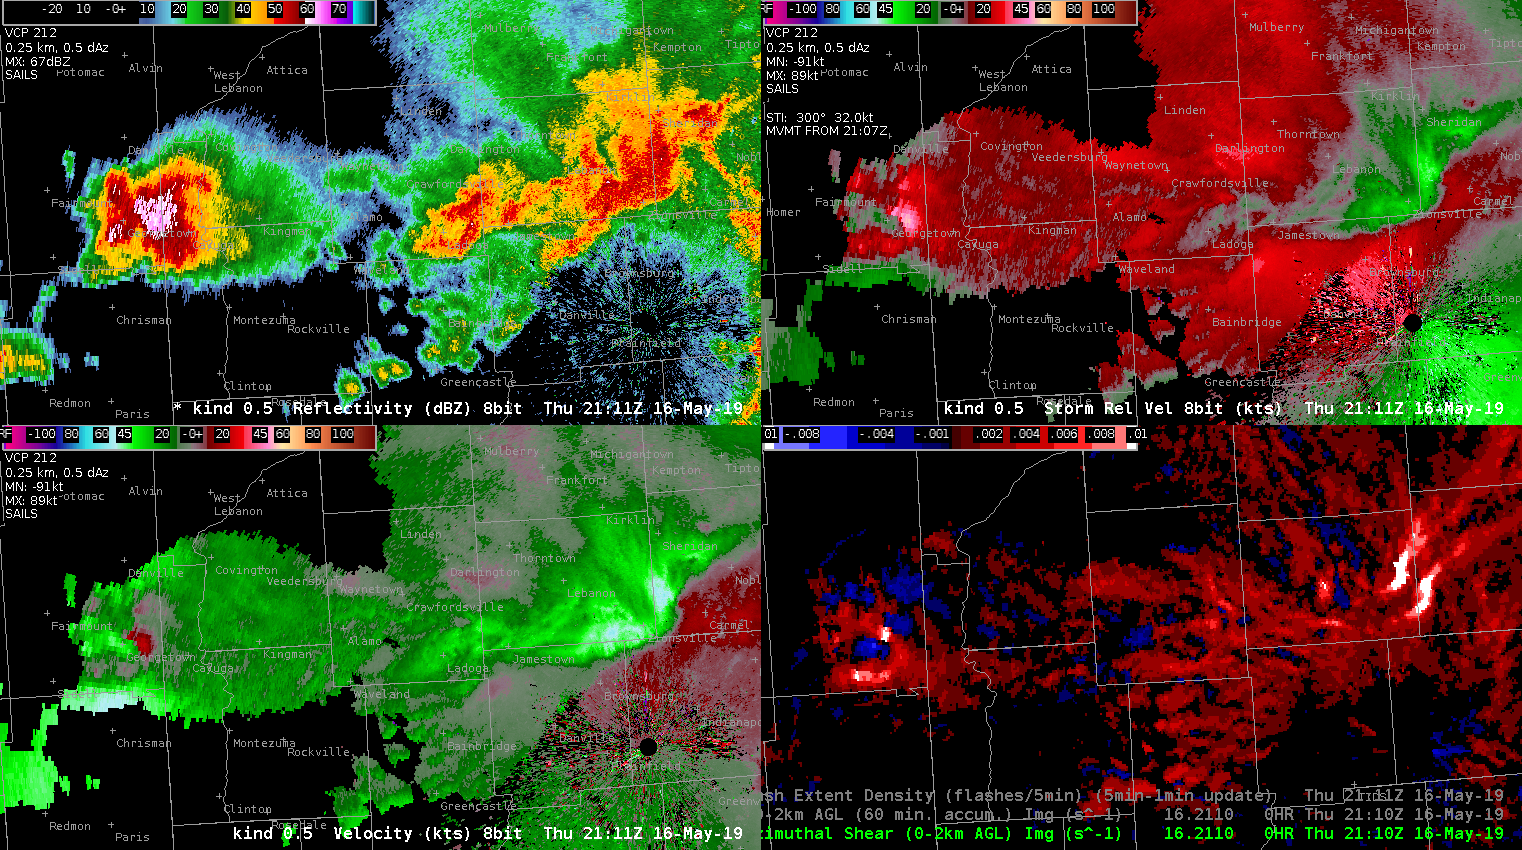
Low Level AzShear (0-2km) correctly identified an area of rotation associated with the western supercell, however, AzShear was also saturated above 0.01 along the leading edge of the bow echo in the MCS as well. While it’s good to drawn attention to the latter area, as it was producing severe wind (61kts), it was not tornadic.  Additionally, there is some noise in the merged LL AzShear that wouldn’t exist in the single radar AzShear. I believe single radar AzShear would perform better in this situation.

Clockwise from Top Left: KIND 0.5 Ref, 0.5 SRM, 0.5 Vel, Low Level Az Shear (0-2km)

-Tempest Sooner

Prob Severe Object Identification

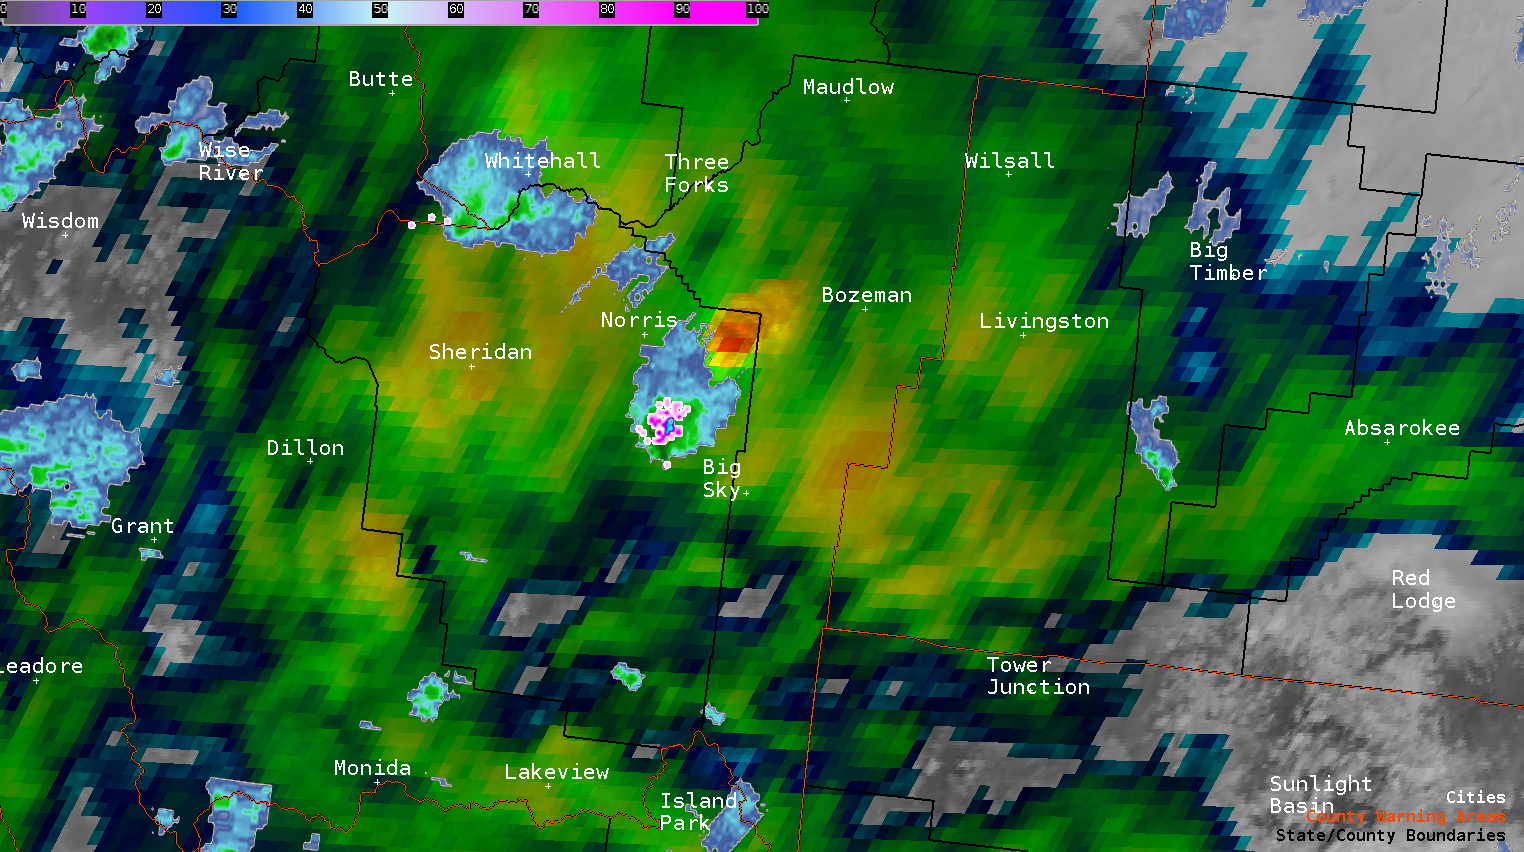
Prob Severe failed to identify a strong storm developing in radar sparse coverage area near Bozeman, MT. The storm did show up on MRMS composite reflectivity, ENTLN, GLM Lighting and had rapidly cooling cloud tops, so not sure what was missing to have the storm identified by Prob Severe.

–warmbias–

FED Gives Precursor to Strenthening Supercell, but…

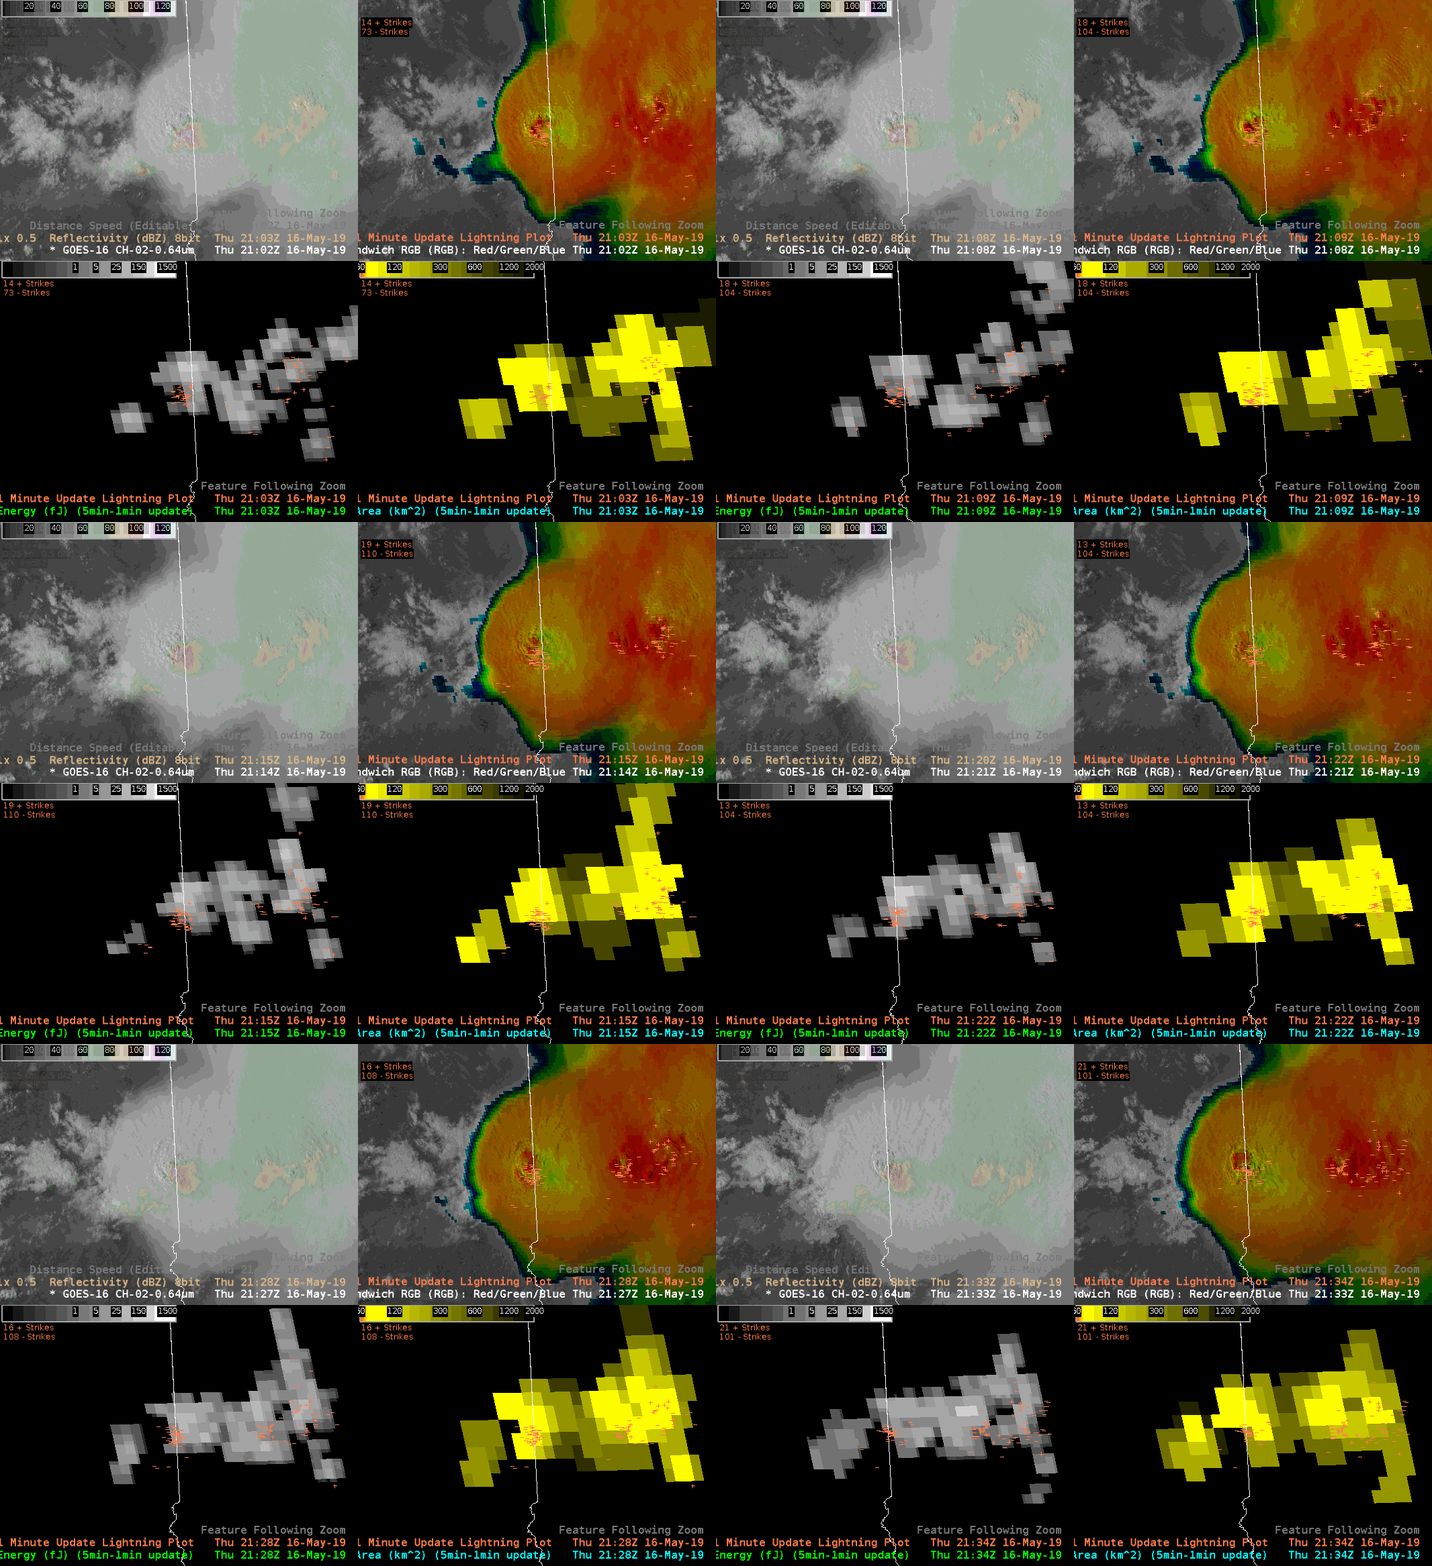
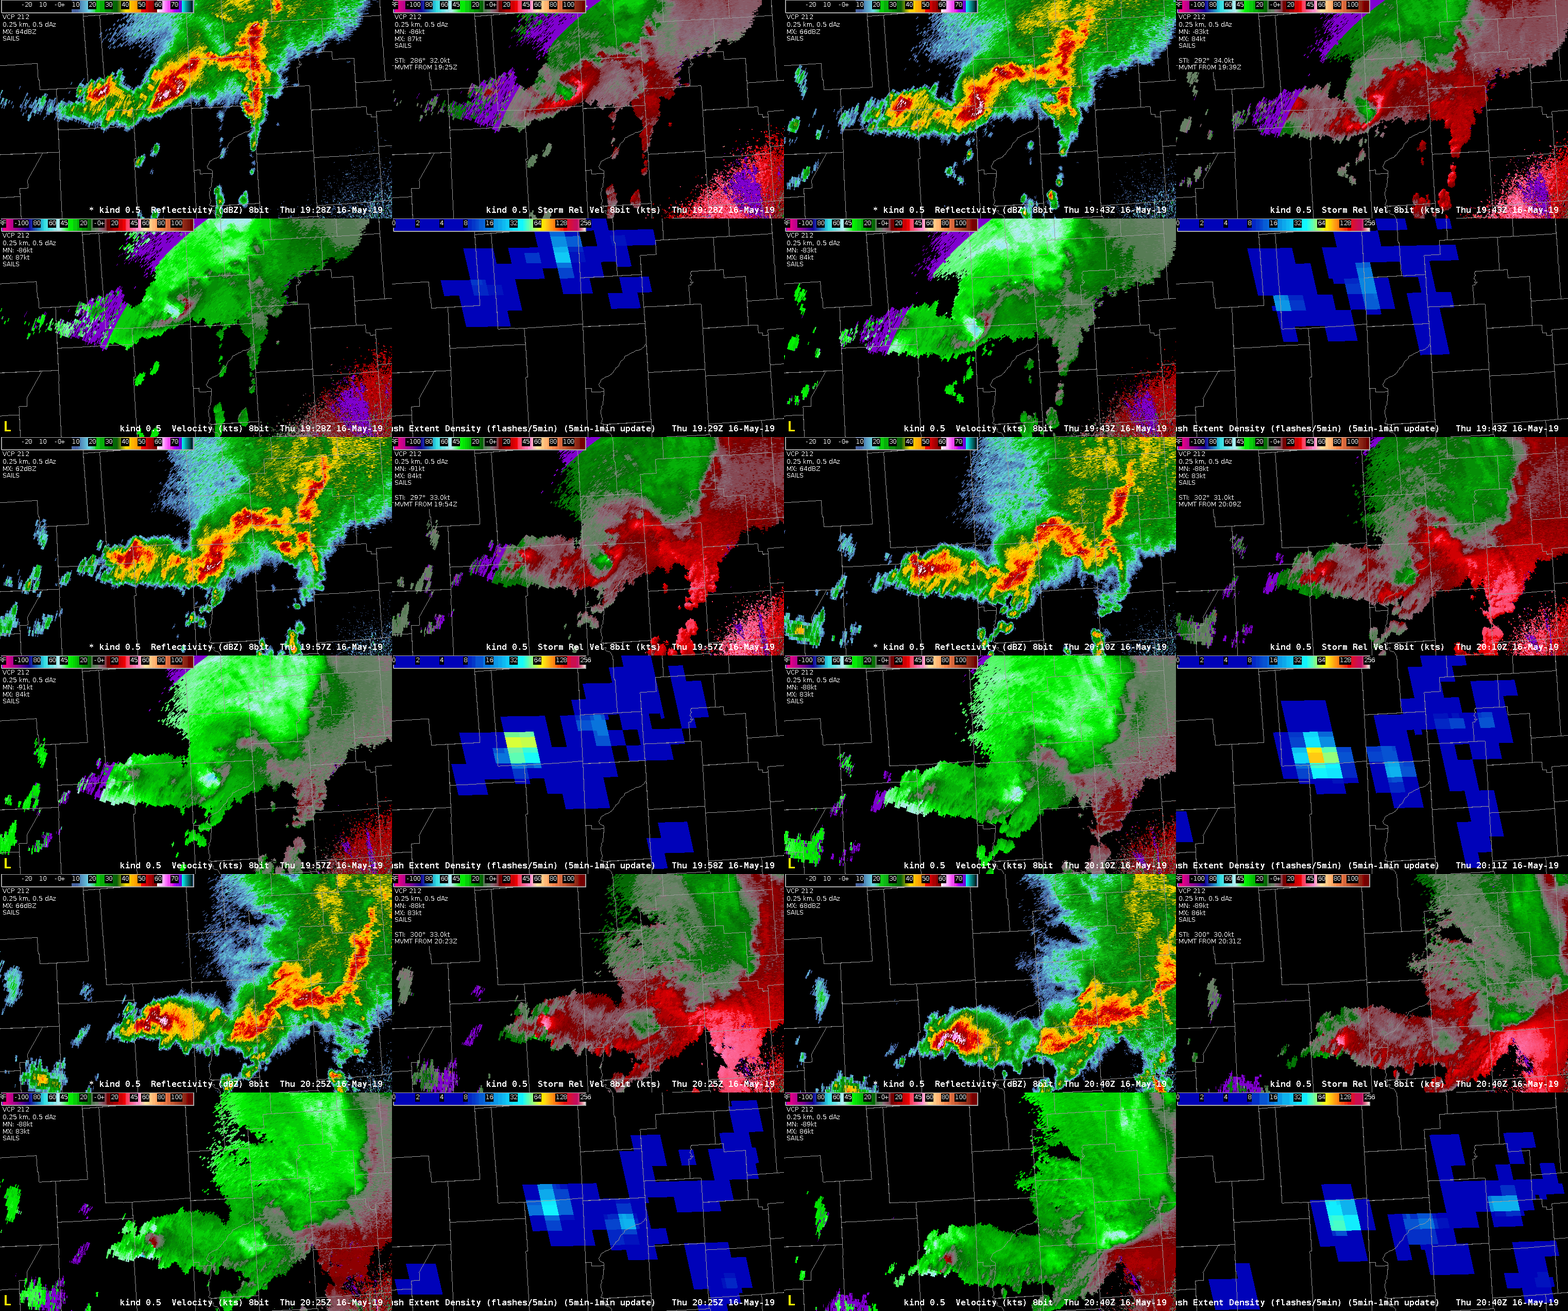
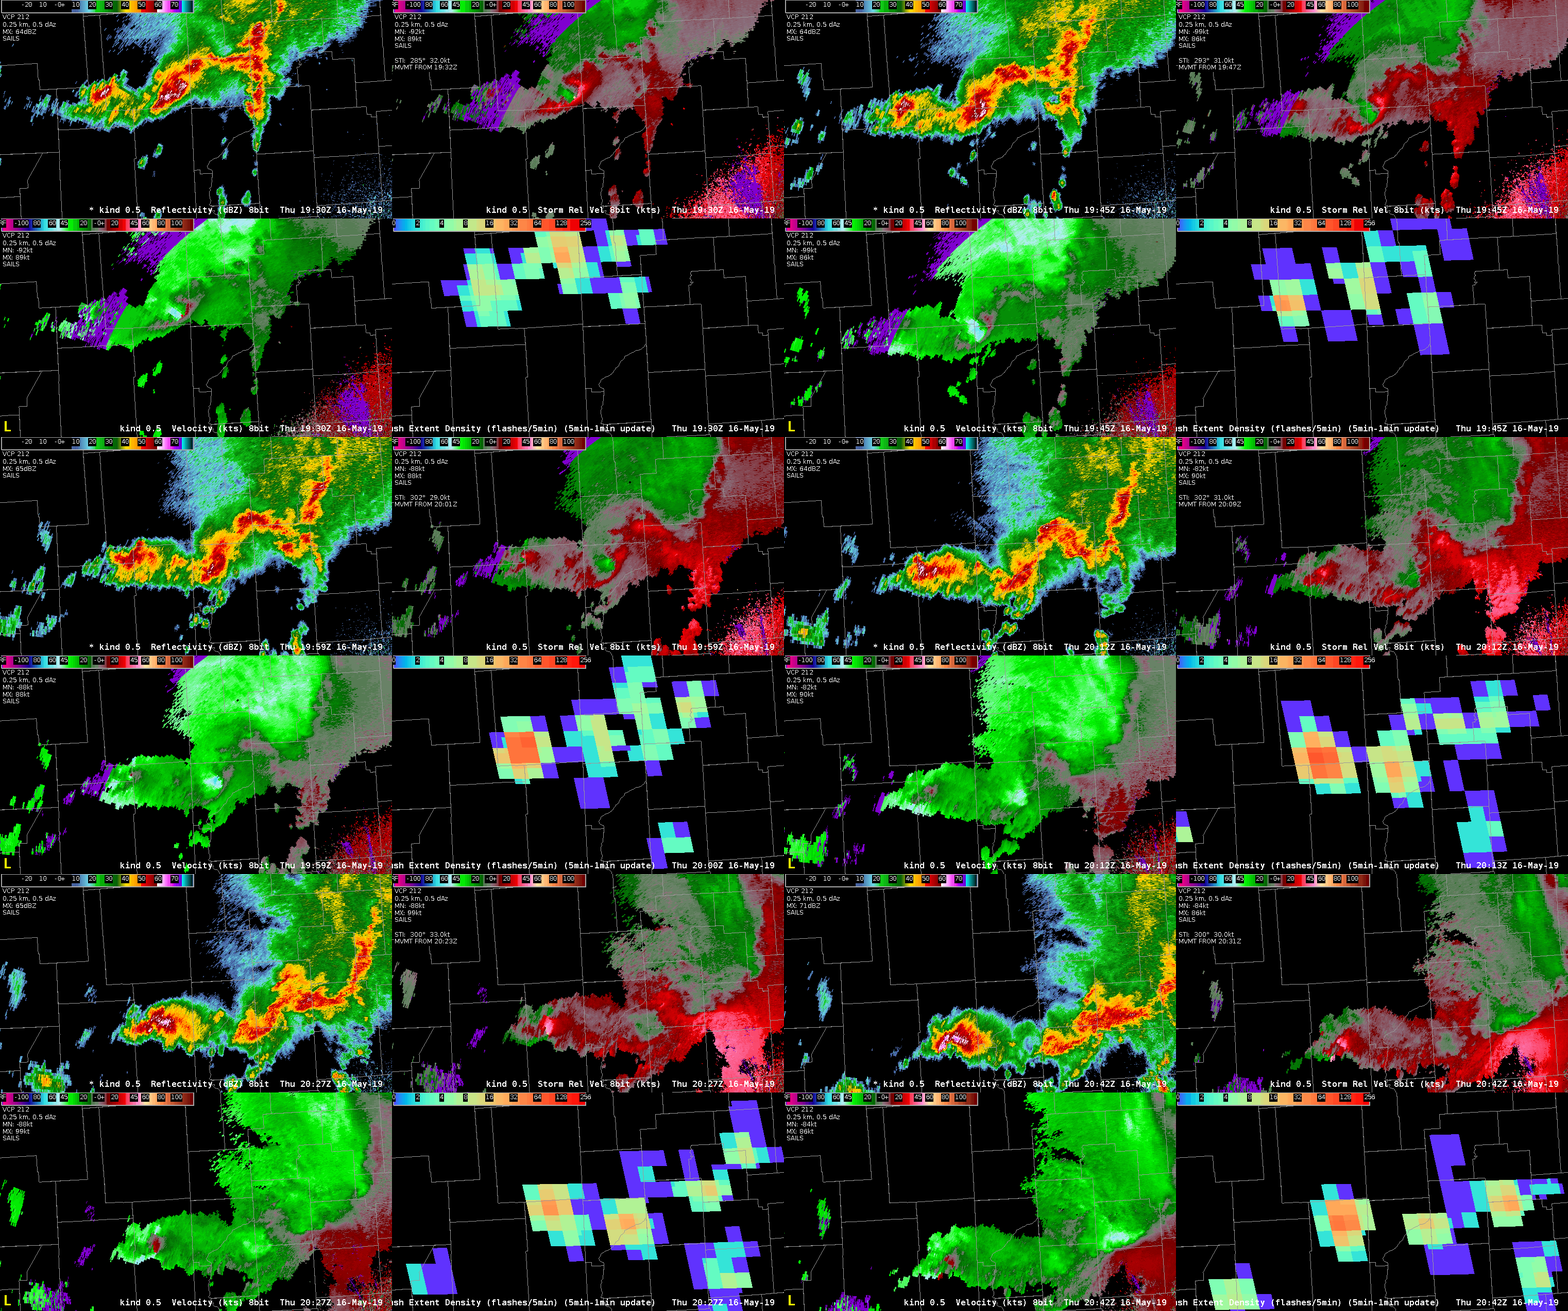
Watching the last storm in the line that is still in Illinois, the Flash Extent Density values started climbing rapidly (between 1947Z and 2020Z), which suggested to me that I should start paying attention to it. Upon interrogation, the velocity started to change from being more convergent to rotational, and eventually it appeared that a tornado was likely per the KIND radar. Interestingly, that was when the FED fell rapidly (2022Z).

Clockwise from Top Left: 0.5 KIND Reflectivity, 0.5 KIND SRM, 0.5 KIND Vel, FED

There was also an increase in FED after the tornado signature became less intense, but when it wrapped up again, the FED decreased again (not shown).

Interestingly, I also looked at these same data with the new color curve that Jonathan and Kristin worked on today, and the increase and decreases in FED were not as clear, and I don’t think it would have drawn my attention as quickly. Perhaps the lower values need to be more muted or less bright, but still within the same the rainbow color curve.

Clockwise from Top Left: 0.5 KIND Reflectivity, 0.5 KIND SRM, 0.5 KIND Vel, FED

-Tempest Sooner

5-min FED Colormaps

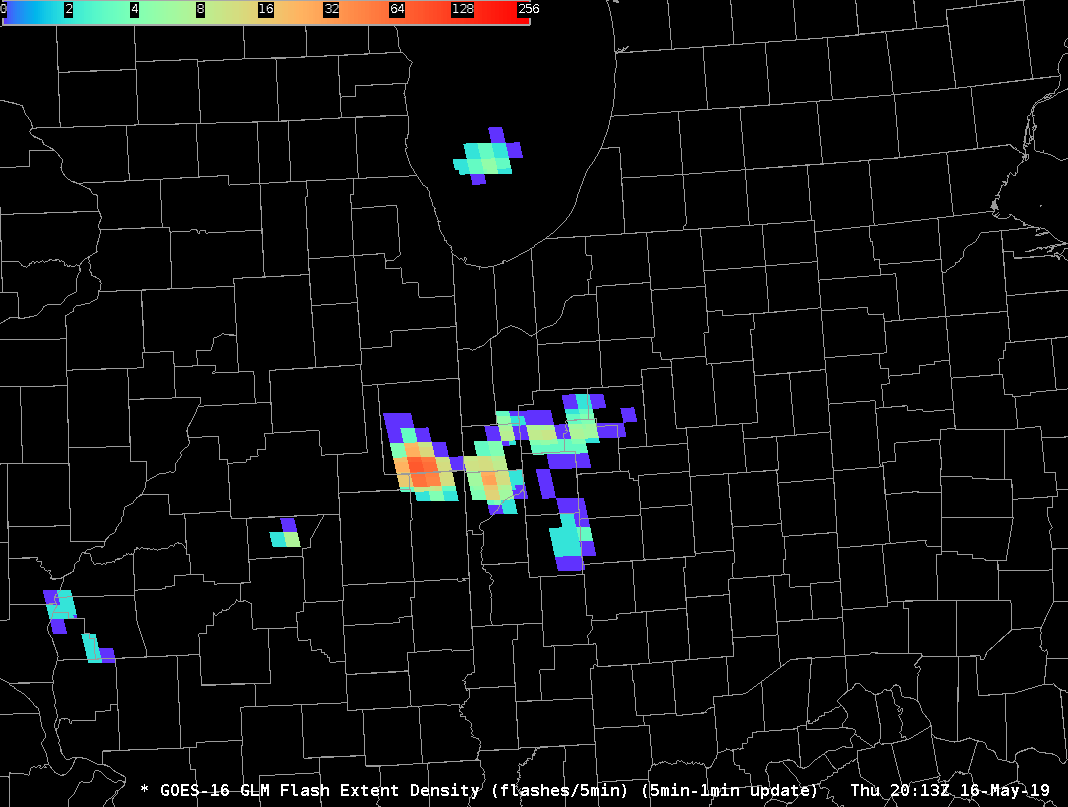
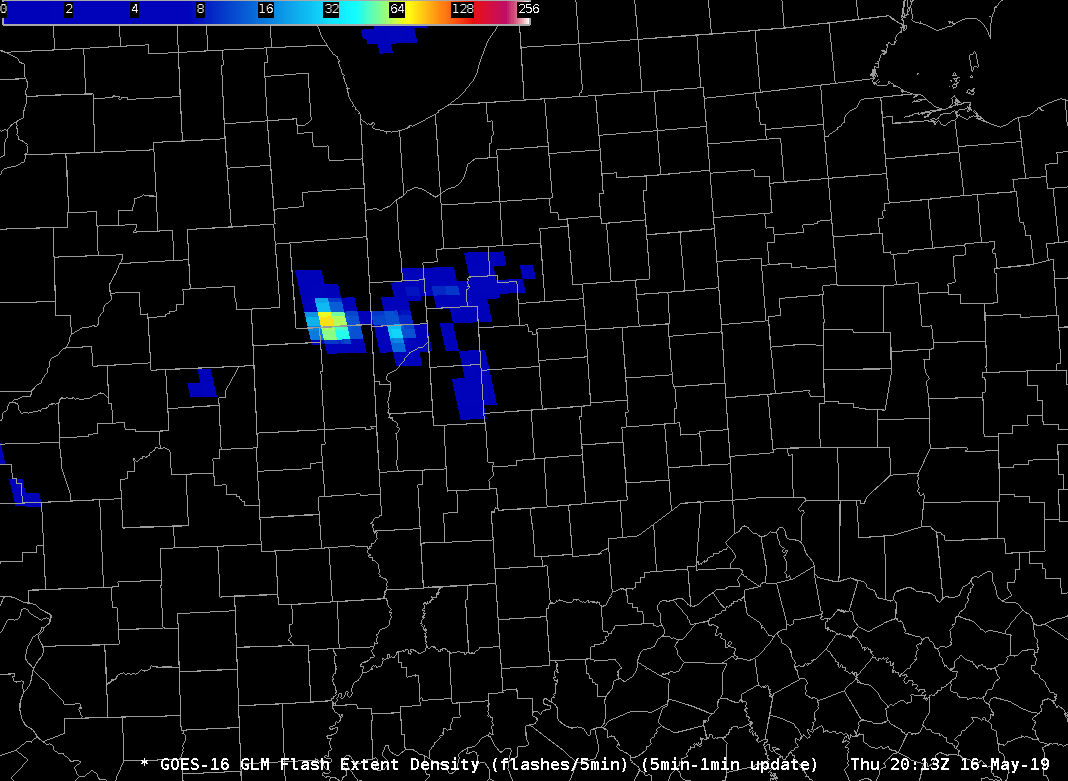
Testing a new colormap for FED using the Rainbow colormap in Python.  The first image depicts the modified 5-min FED with the modified colormap.  There is more variation on the lower end of the 5-min FED.  Will this colormap depict the variation in the more intense convection. The second image is the original 5-min FED colormap.  – Jonathan Wynn Smith (ESSIC/UMD)

Love the AllSky TPW!

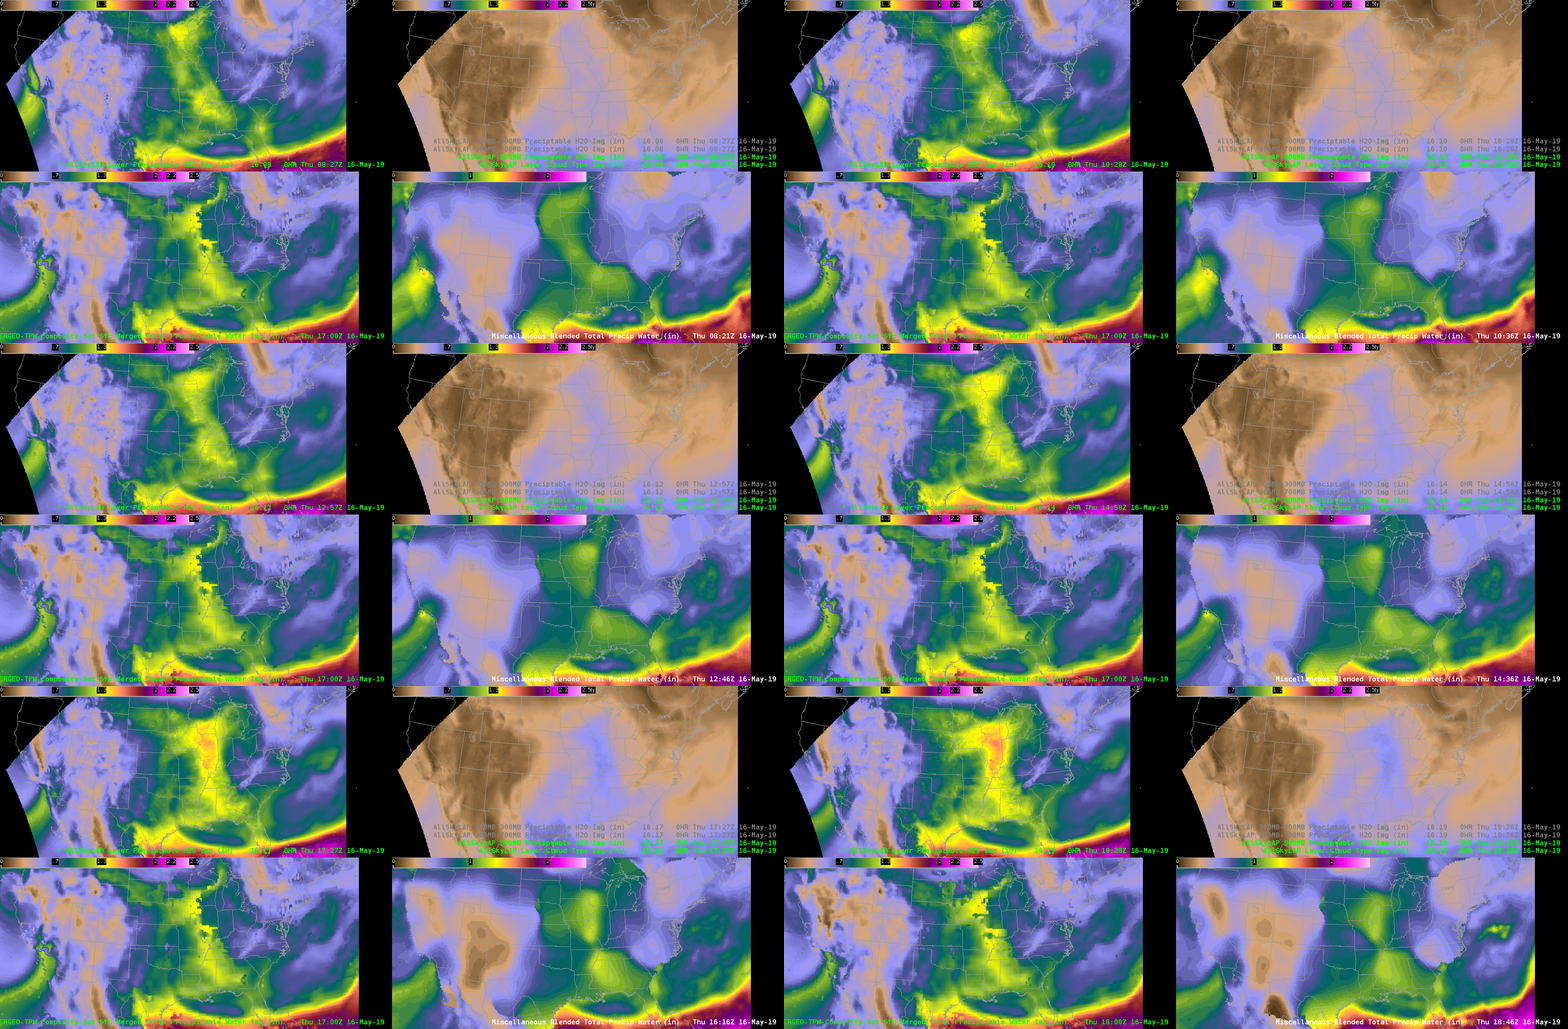
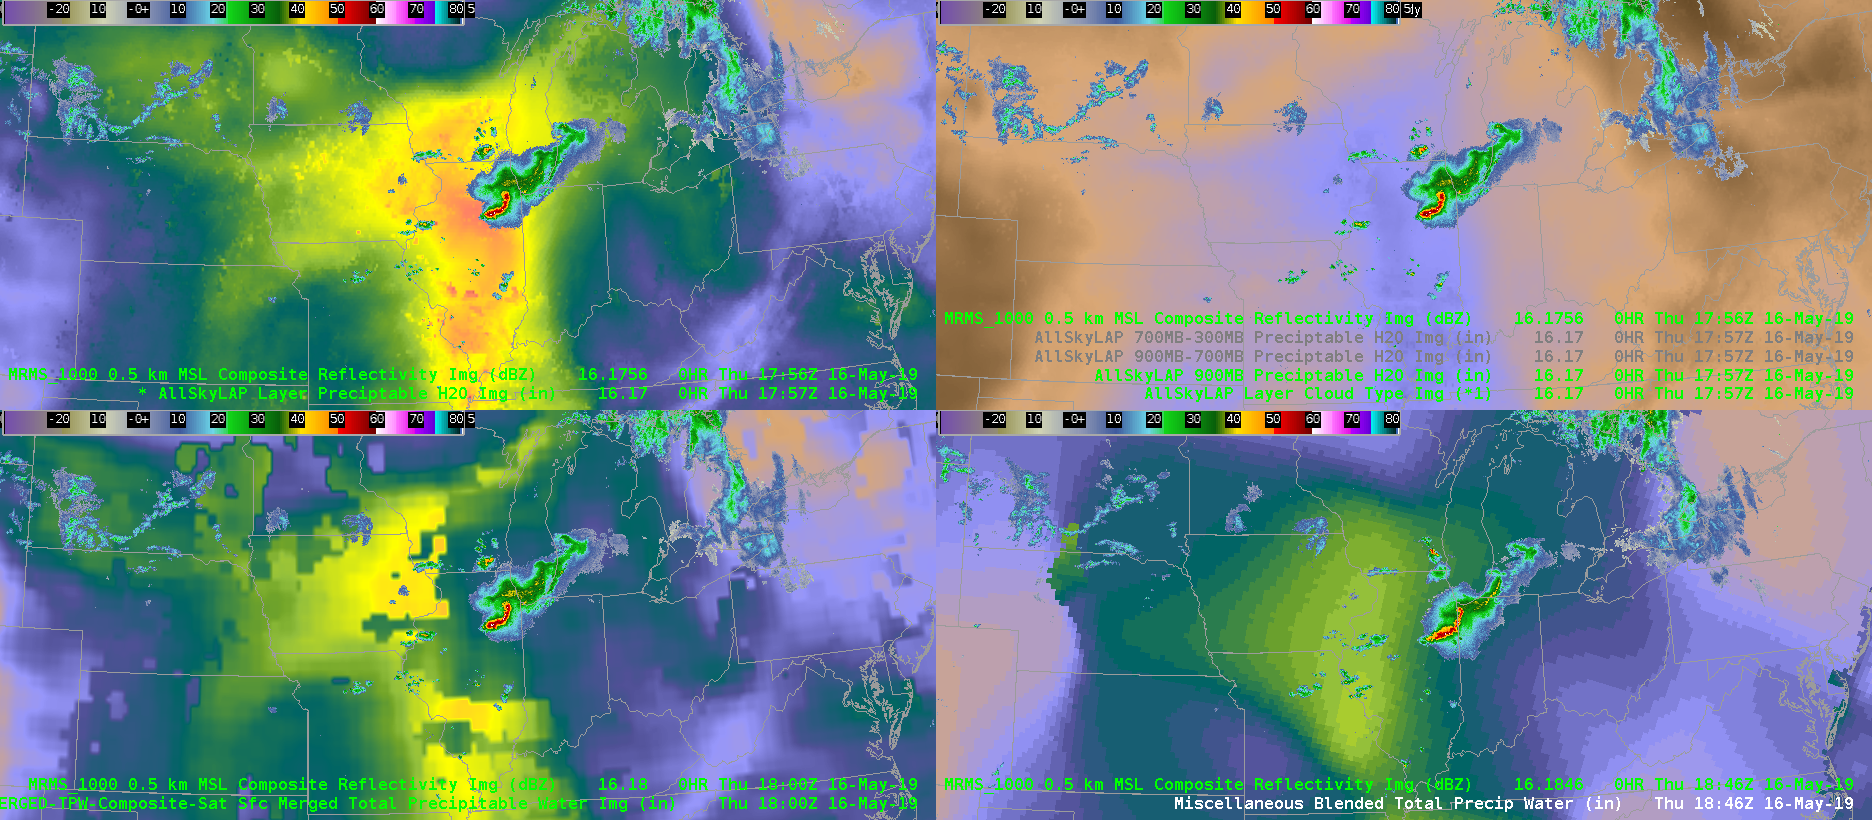
Here’s just a quick example of today’s TPW over the Midwest where a complex MCS and discrete supercell are located. The blended TPW is very low-resolution and therefore you miss the enhanced values that might be located over IL compared to the rest of the upper Midwest and southeast U.S.  The AllSky products in IL are mostly using GFS, which may or may not be reliable, but at least it gives a better emphasis and resolution in where to focus your attention….as well as data underneath the severe storm complex. Over central IL, the TPW values are around 1.5 inch vs. the 0.9 inch for the blended TPW.

Animation below shows: Upper Left AllSky All Layer TPW, Upper Right AllSky sfc-900mb TPW, Lower Left Merged TPW, Lower Right Blended TPW

Below is a screen shot of the MRMS loaded at a similar time over the TPWs to see the impact of the cloud cover.

messing around with NUCAPS in the volume browser

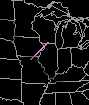
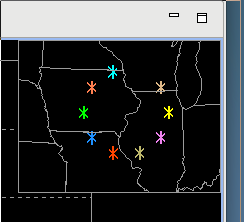
A first cut at depicting the added value of the volume browser in AWIPS for NUCAPS soundings is shown below. I messed around with vertical cross-sections and time series of NUCAPS soundings in the upwind area of the MCS in northern IL that is expected to contain some potential for new convective initiation. Below is  the transect of the cross-section.

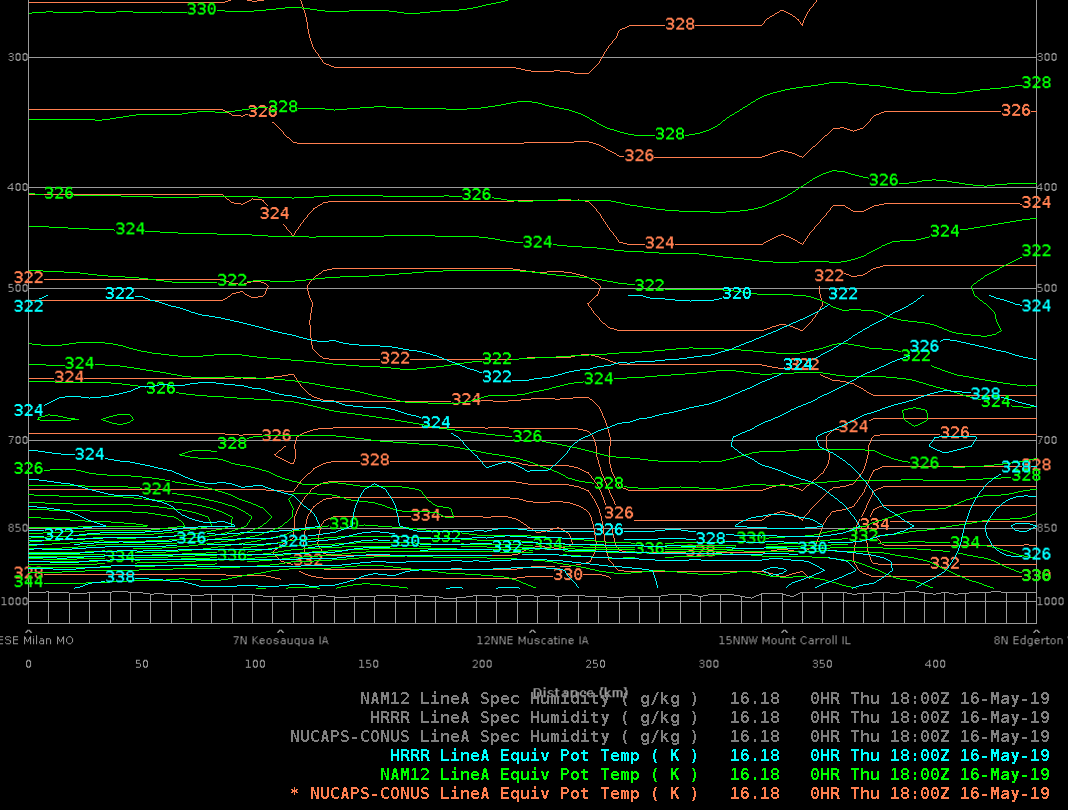
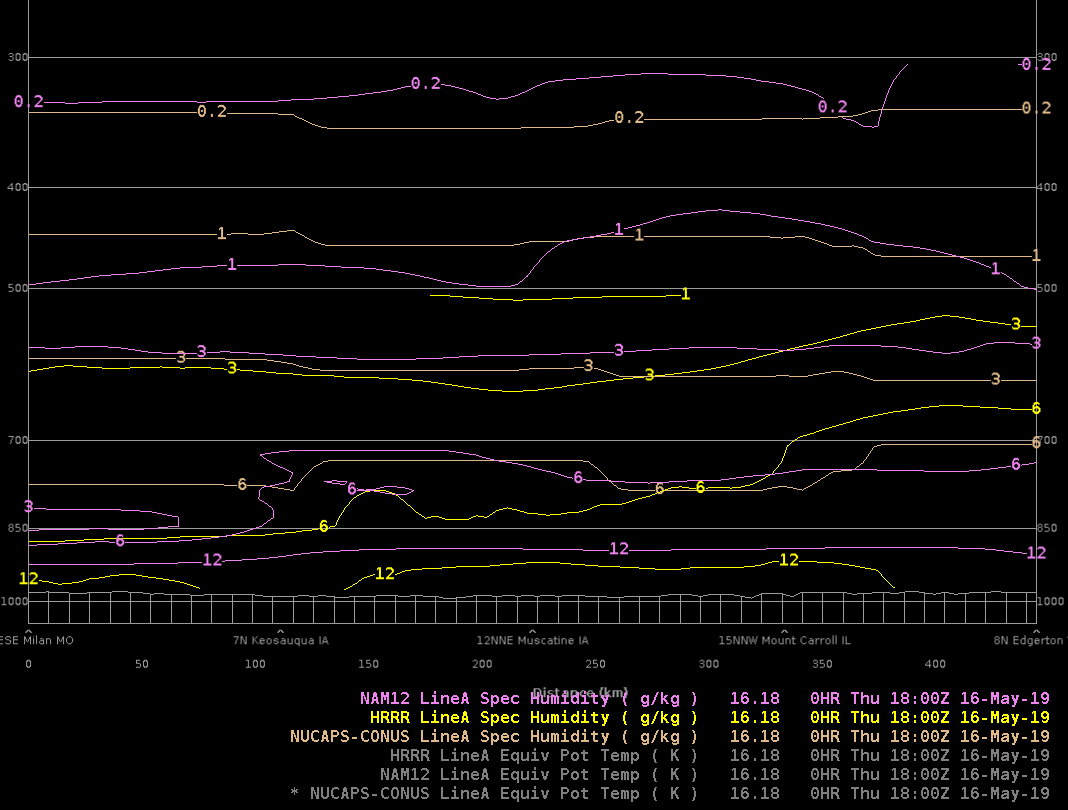
Here is the cross-section of equivalent potential temperature from NUCAPS at 18Z, NAM-12 at 18Z, and the HRRR at 18Z.

The two models and satellite soundings are in very good agreement at altitudes above 700 hPa, in less agreement between 700 and 850 hPa, and in poor agreement between 850 hPa and the surface. NAM12 is the highest with theta-e values between 336 and 344K, with HRRR about 5-10K colder, and NUCAPS still colder in the SW portion of the cross-section, and slightly warmer in the NE portion of the cross-section than HRRR.  Is it because of temperature or moisture differences?  It appears dominated by moisture discrepancies as shown below:

I can’t quite figure out how to plot additional (or fewer) contours (AWIPS newbie here) but its quite clear that NAM12 is the moistest and NUCAPS is much drier near the surface. The 12Z Quad Cities RAOB had 7-8 g/kg for water vapor mixing ratio but with the six-hour discrepancy it is challenging to establish ground truth.

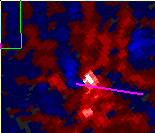
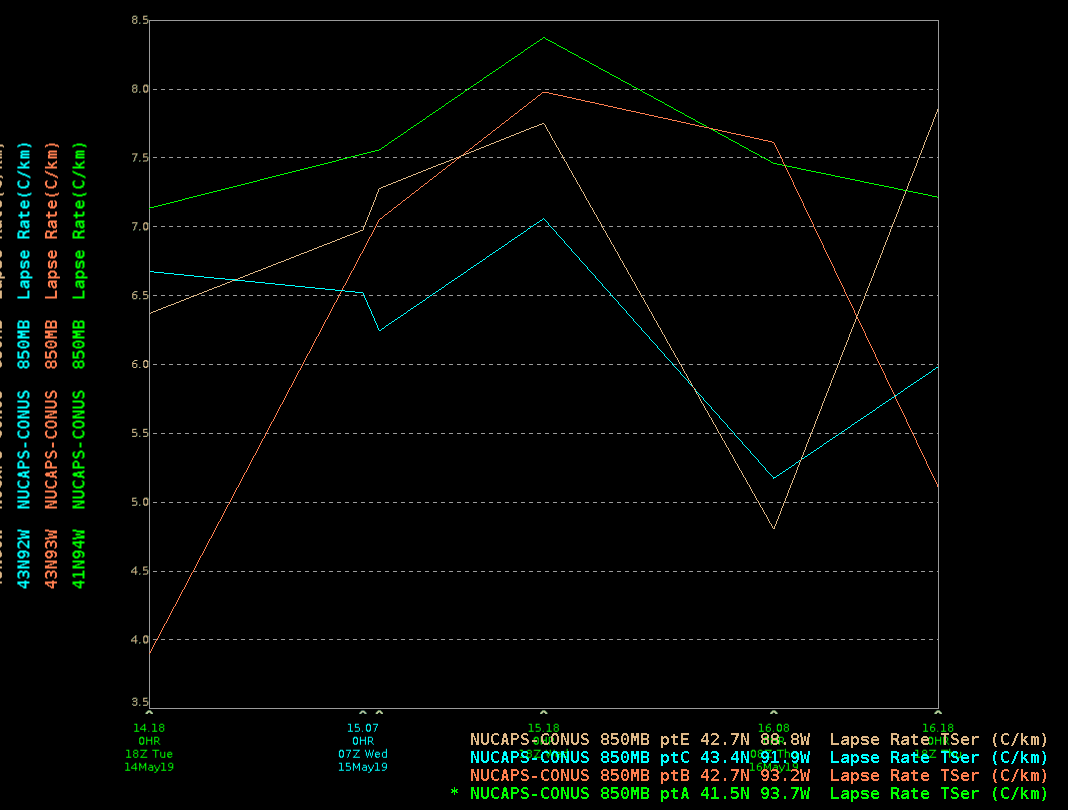
The volume browser is capable of making time series plots too.  Here is a ring of points depicting time series of 850 hPa temperature lapse rates over the last few days of soundings:

The time series plot is shown below.  A two-day time series of sparse satellite soundings  isn’t all that insightful, but using this for 0-6 hour NUCAPS-FCST products (in comparison to model output) might be quite valuable for forecasters.

Brian Kahn

My AzShear Manifesto

Those of us who use GR2Analyst already have access to AzShear via its NROT product. I stated elsewhere that the negative values are important, and here I’ll attempt to explain why.  Below is a schematic of a Rankine vortex, which is akin to a rotating cylinder. Radial velocities are maximized at the edge of the cylinder and then drop off as an inverse  function  of range.
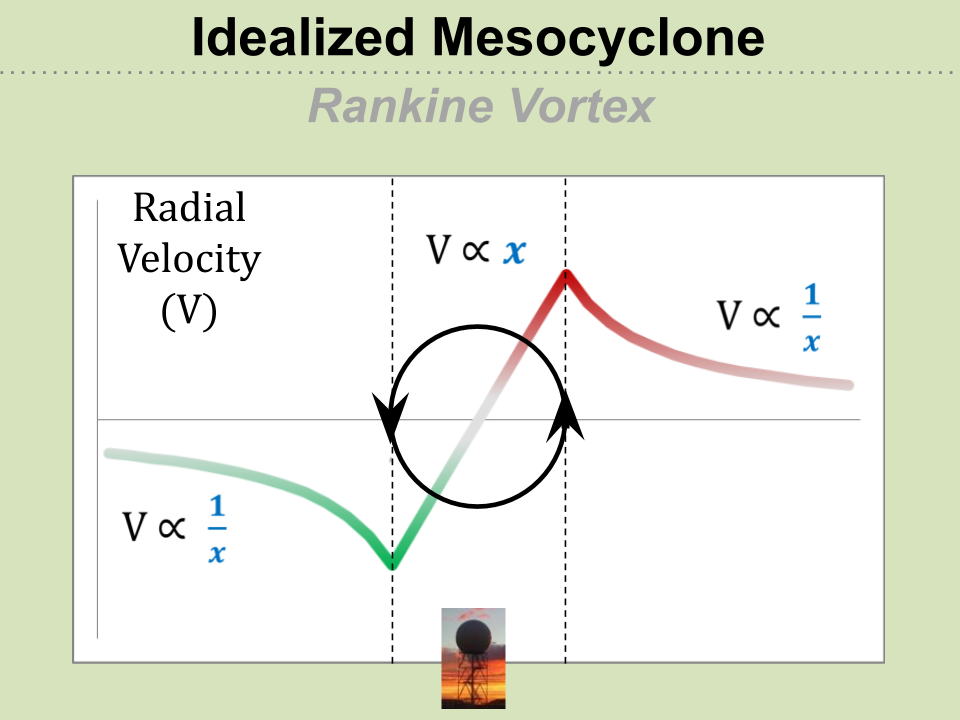
We know azimuthal shear is positive across the entire “cylinder”….
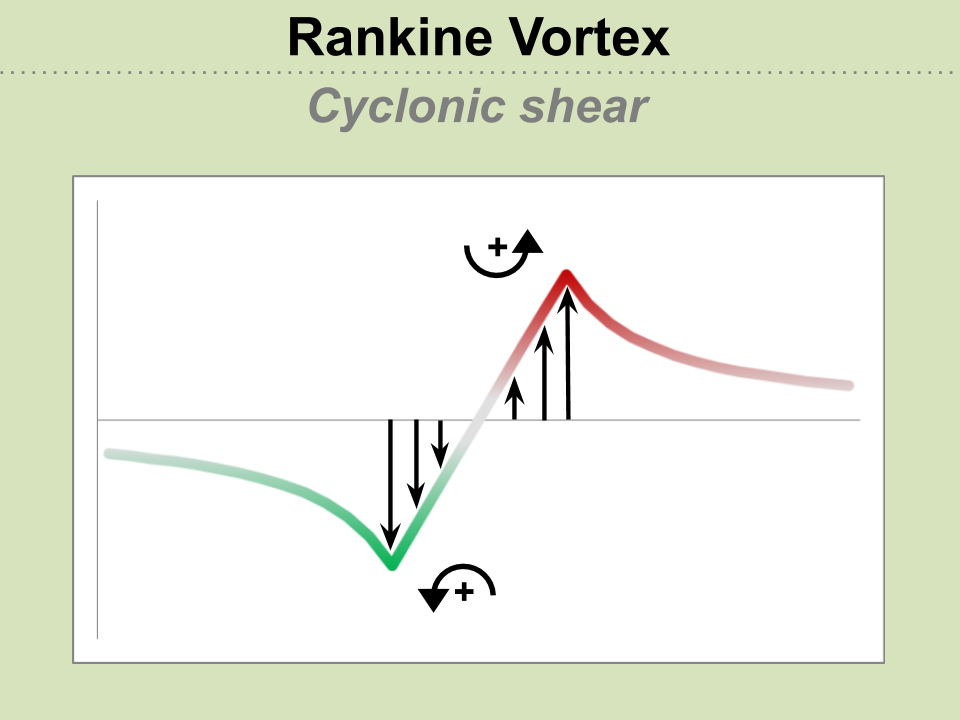
What about just outside the cylinder? If you look closely, you’ll see that there are *negative* AzShear regions on the radials that are just outside of the max/min radial velocities positions…
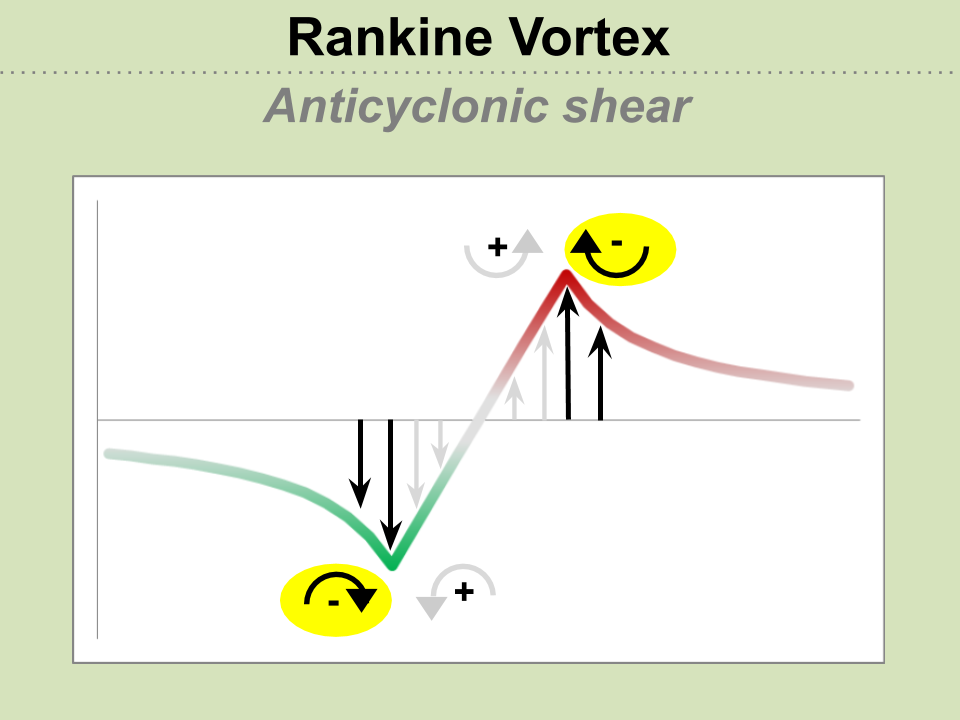
Putting it all together and thinking of azimuthal shear as a running average of shear as we move across the radials, we get a plot of AzShear that looks something like the black trace below.
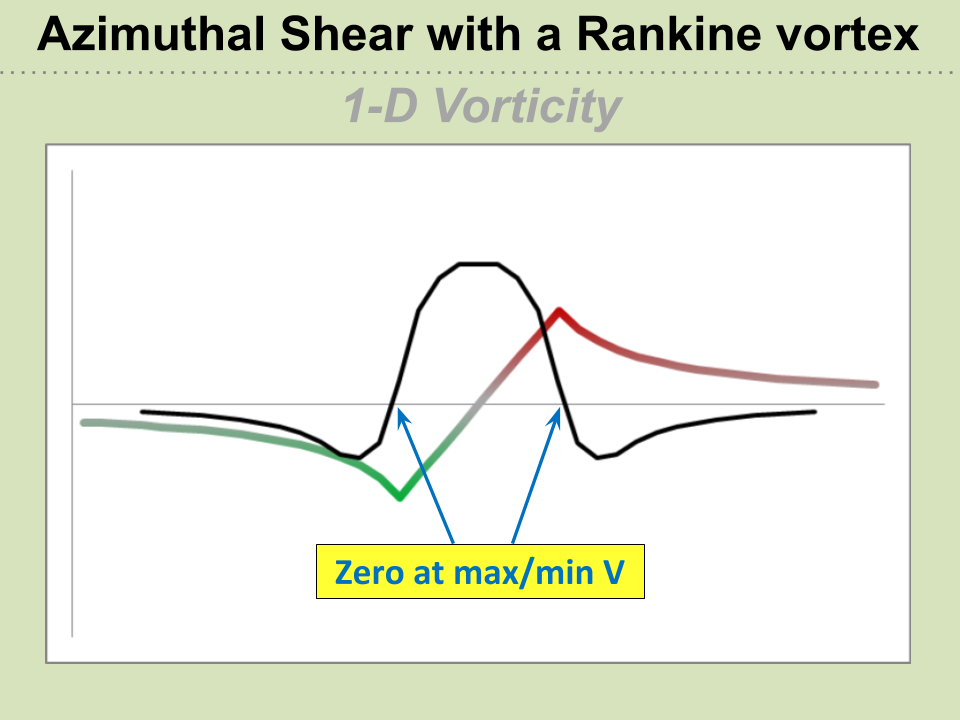
We see slightly negative AzShear regions flanking the AzShear maximum, which would be observable for a well-sampled mesocyclone, such as seen on the right hand side of the image below…
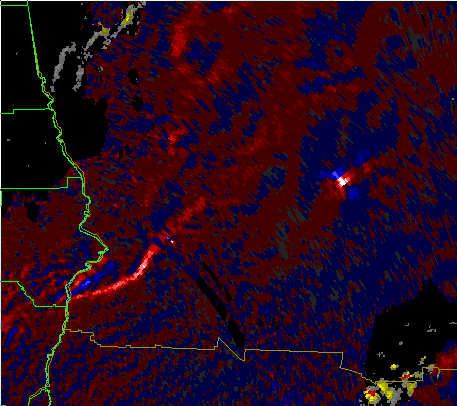
Also notice in the figure above that the maximum inbound/outbound velocities line up with where AzShear crosses zero.  Now, let’s pretend we have a rear flank downdraft or RIJ surge by boosting the “inbound” side of the circulation…
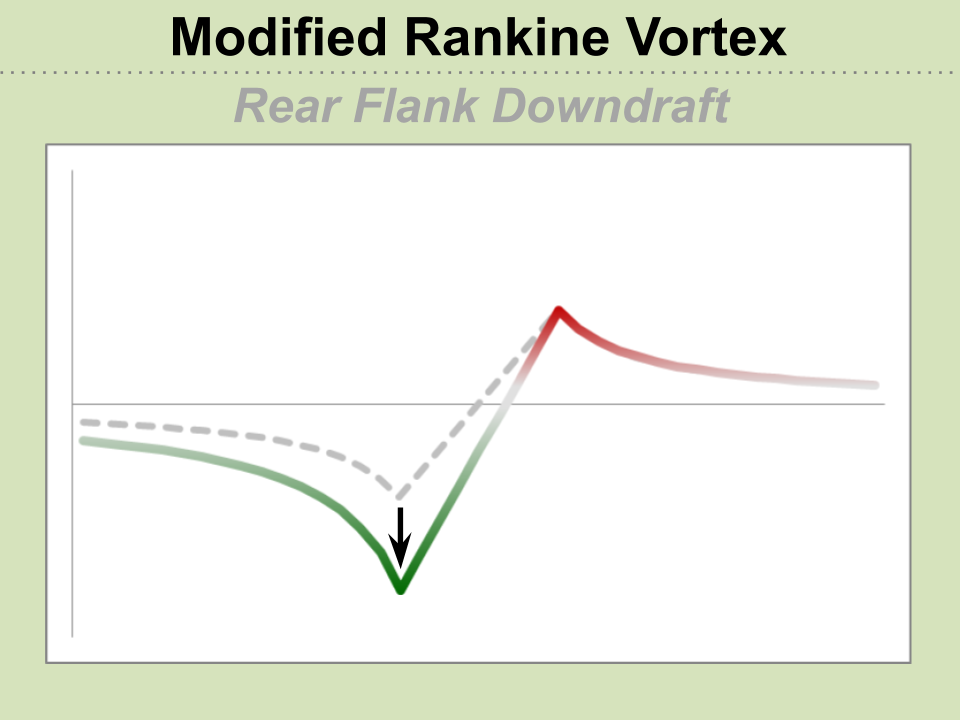
 

Now what does the new AzShear trace look like?
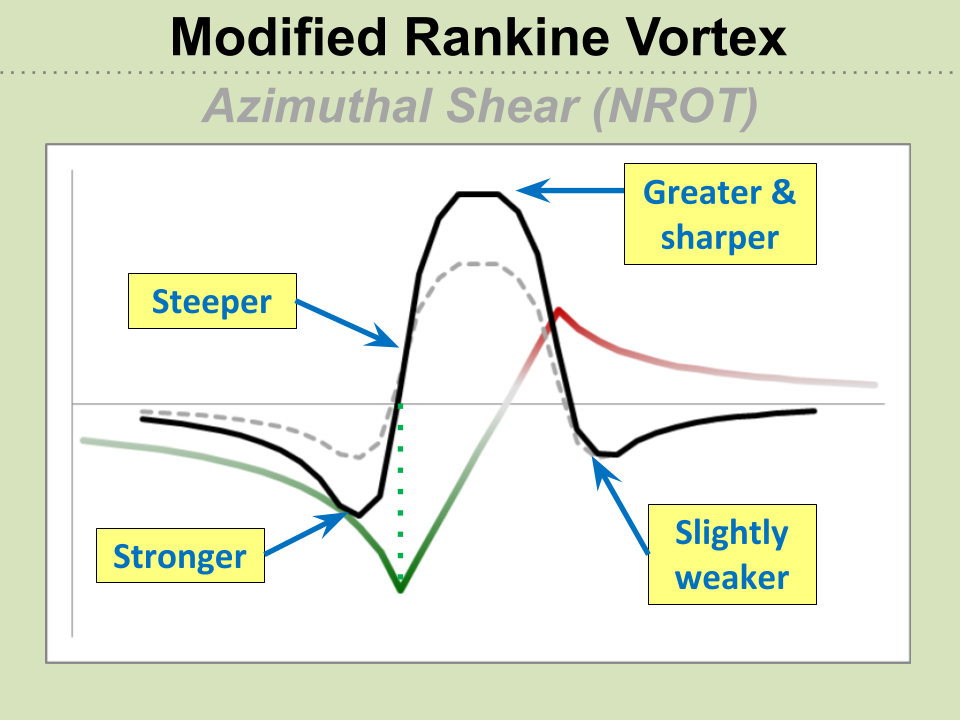
Well, we see more of an AzShear “couplet” as both positive *and* negative shear increase on either side of the surge. The maximum winds are still occurring where AzShear equals zero and this is located directly in between the AzShear maximum and AzShear minimum in conjunction with the center  the surge.

I’m firmly convinced that looking between these two features is an effective way to pinpoint where the most damaging wind will occur, whether it’s tornadic or straight-line. For the smaller tornadoes that most of us get, the southern edge of the AzShear maximum is a sweet spot that has the cumulative effects of rotation, translation, and inflow to maximize winds.

#MarfaFront


Using AzShear to Forecast for Large Areas

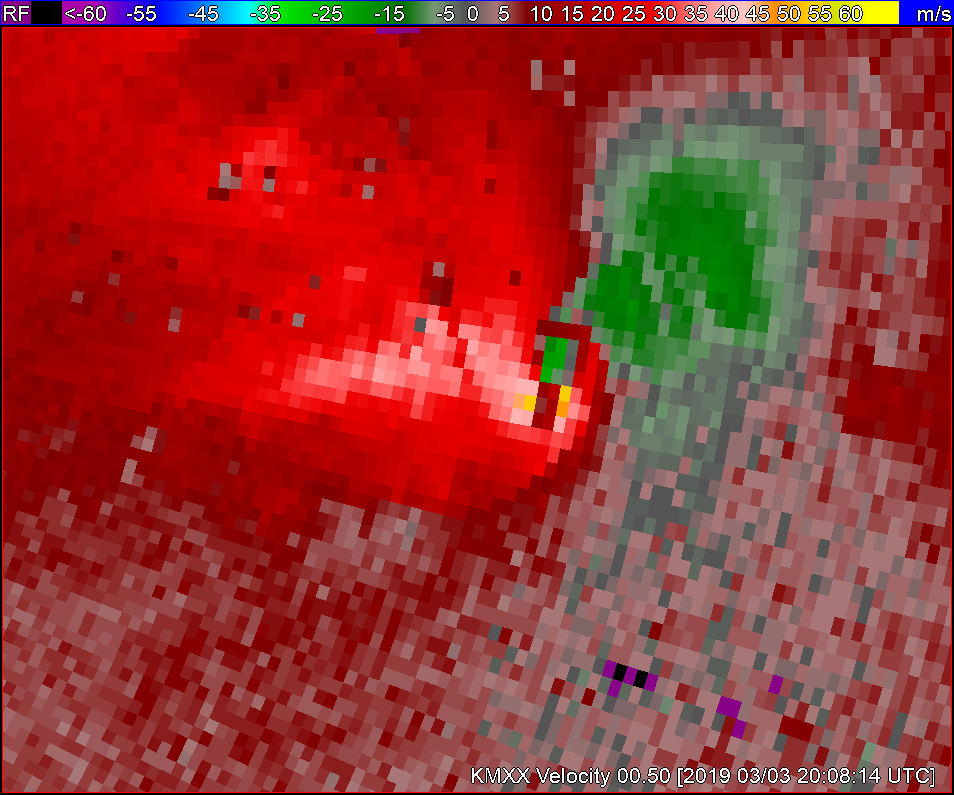
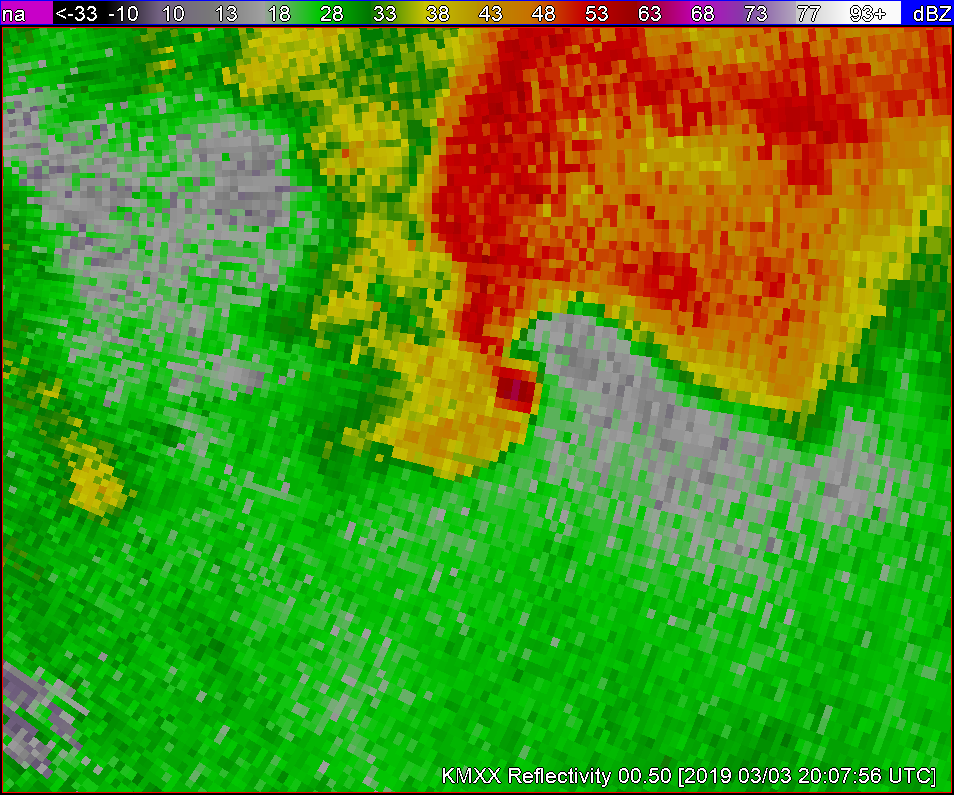
Analyzing the tornadic signatures on the KMXX RDA. This storm is quite obviously already tornadic with an apparent hook echo on reflectivity as well as very strong gate to gate velocity couplets through multiple levels. If I were to use AzShear in conjunction with the plethora of other available tools I would want the product to help me identify areas that are not as well developed as others.

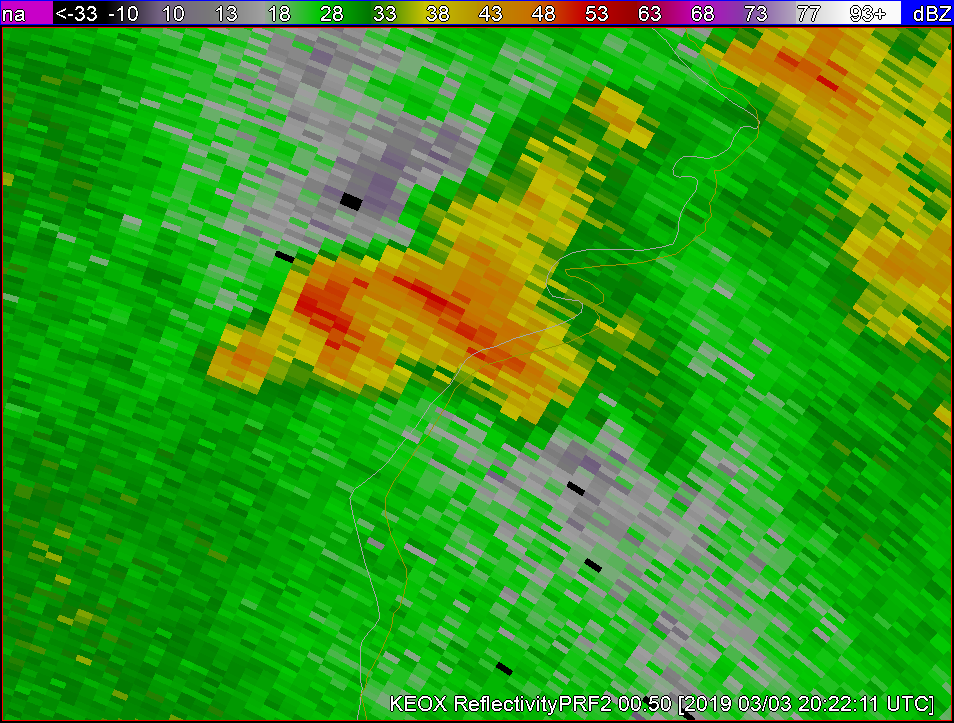
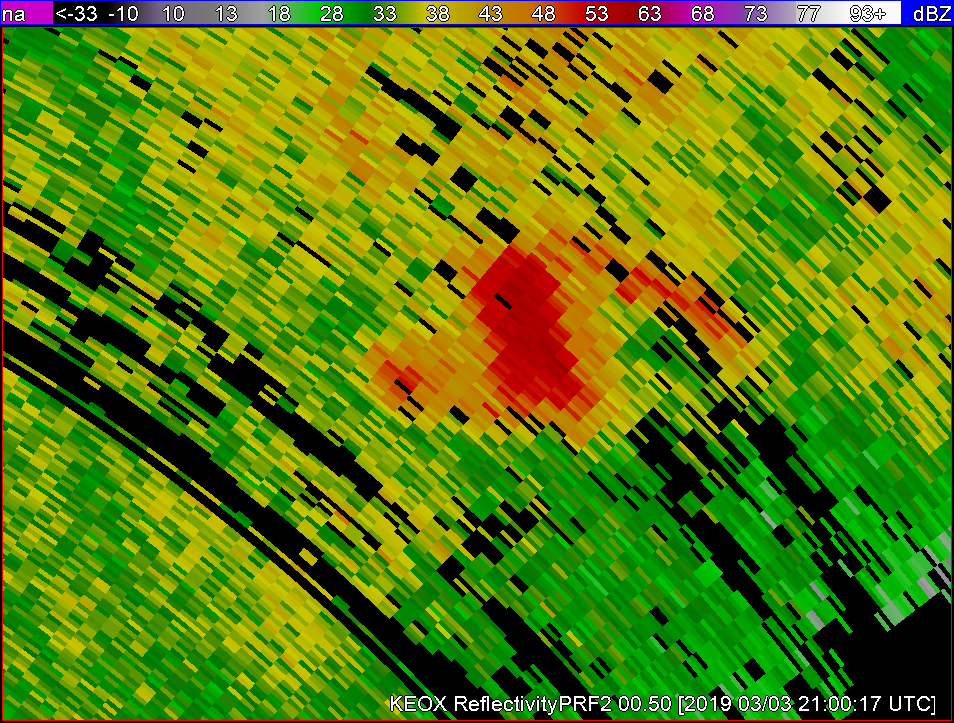
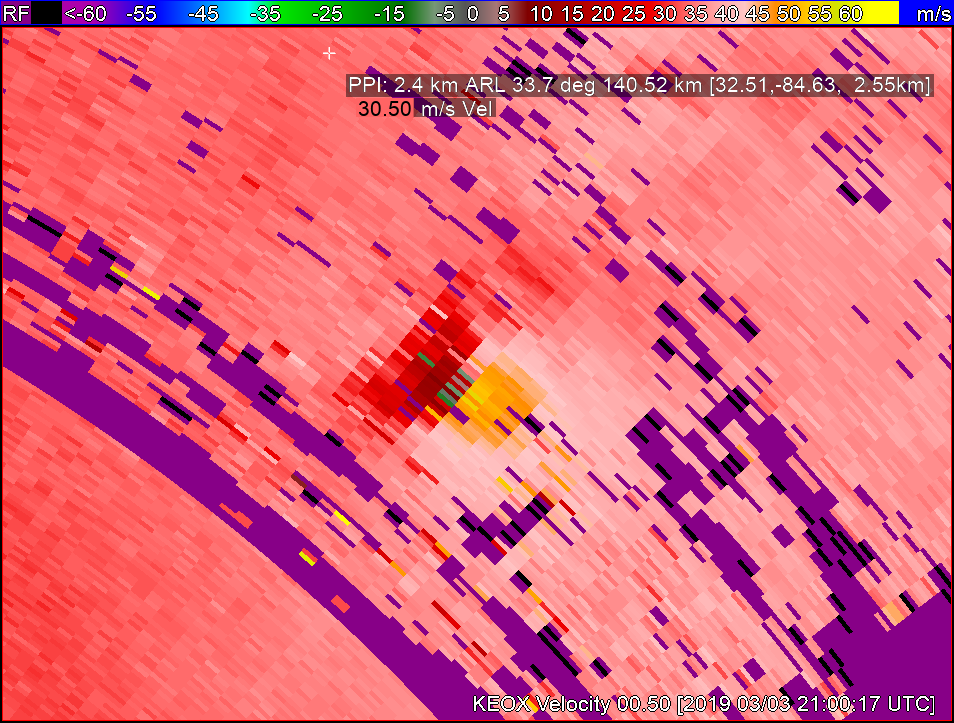
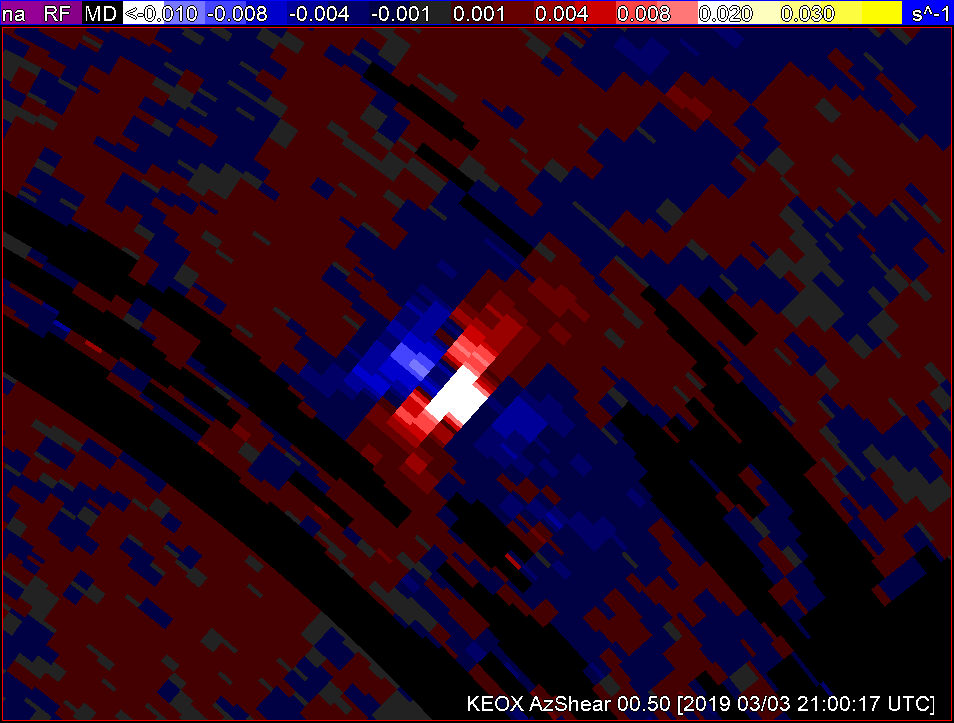
In a case like this I’m not sure how much AzShear would help me forecast what is an obvious tornado. But as I am usually responsible for a very large area to METWATCH I decided to switch to the KEOX radar and zoom out to see if AzShear would help to identify areas that aren’t such a ‘slam-dunk’.

This storm to the NE of the RDA doesnt appear to be anything more than a lower threat general thunderstorm on first glance, especially when compared to other storms in the area.

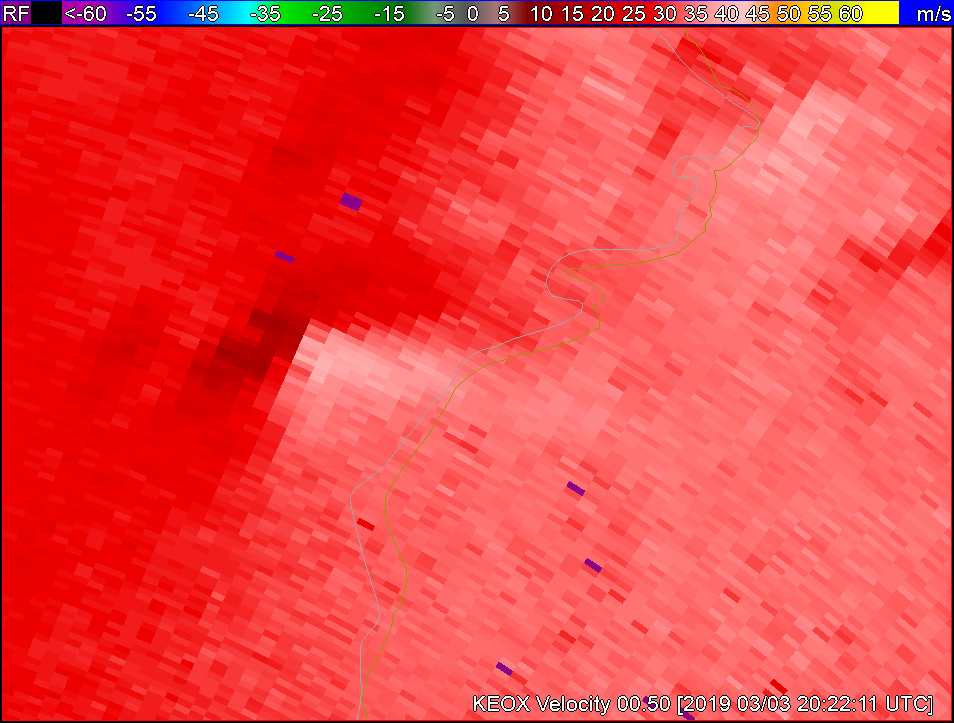
Velocity doesn’t show anything too crazy either.

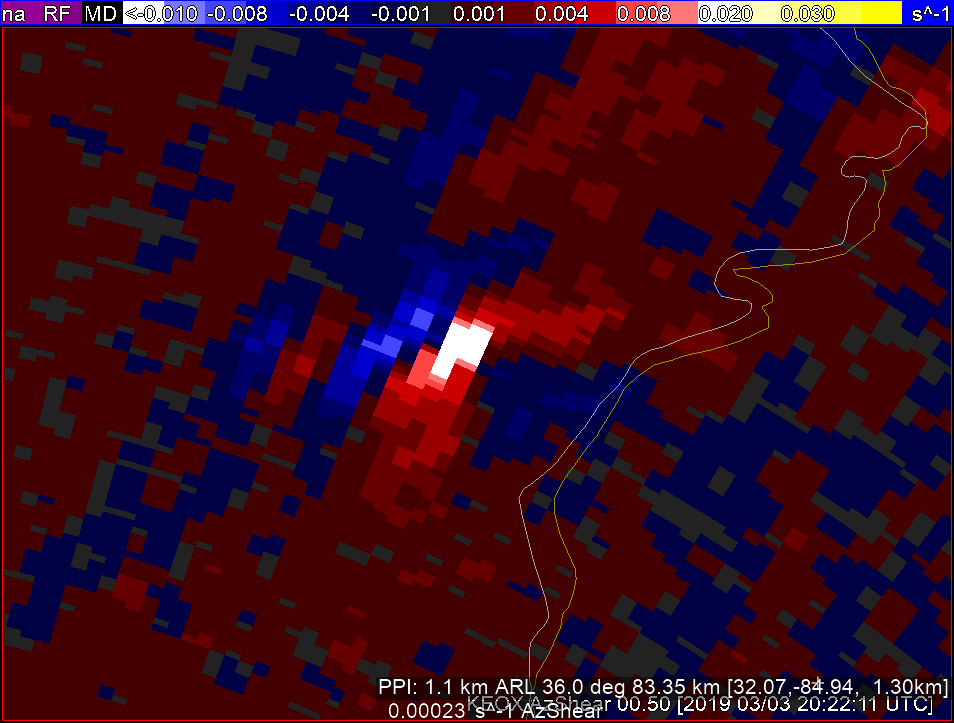
BUT when I look at KEOX AzShear  there seems to be an area of shear that may lead to something…Lets see…

Following the same storm for 40 minutes  I noticed the following: The storm developed into a possibly severe thunderstorm with reflectivity dBzs in the low to mid 60s, significant velocity couplets as well as continued higher AzShear.

For the purposes of how I am required to warn customers, generally 1.5hr required lead time icelyfor a hit within 5nm, this 40 min advanced notice of a storm that has increased severity significantly would be invaluable when added to my stable of available tools to use.

***Desmond***