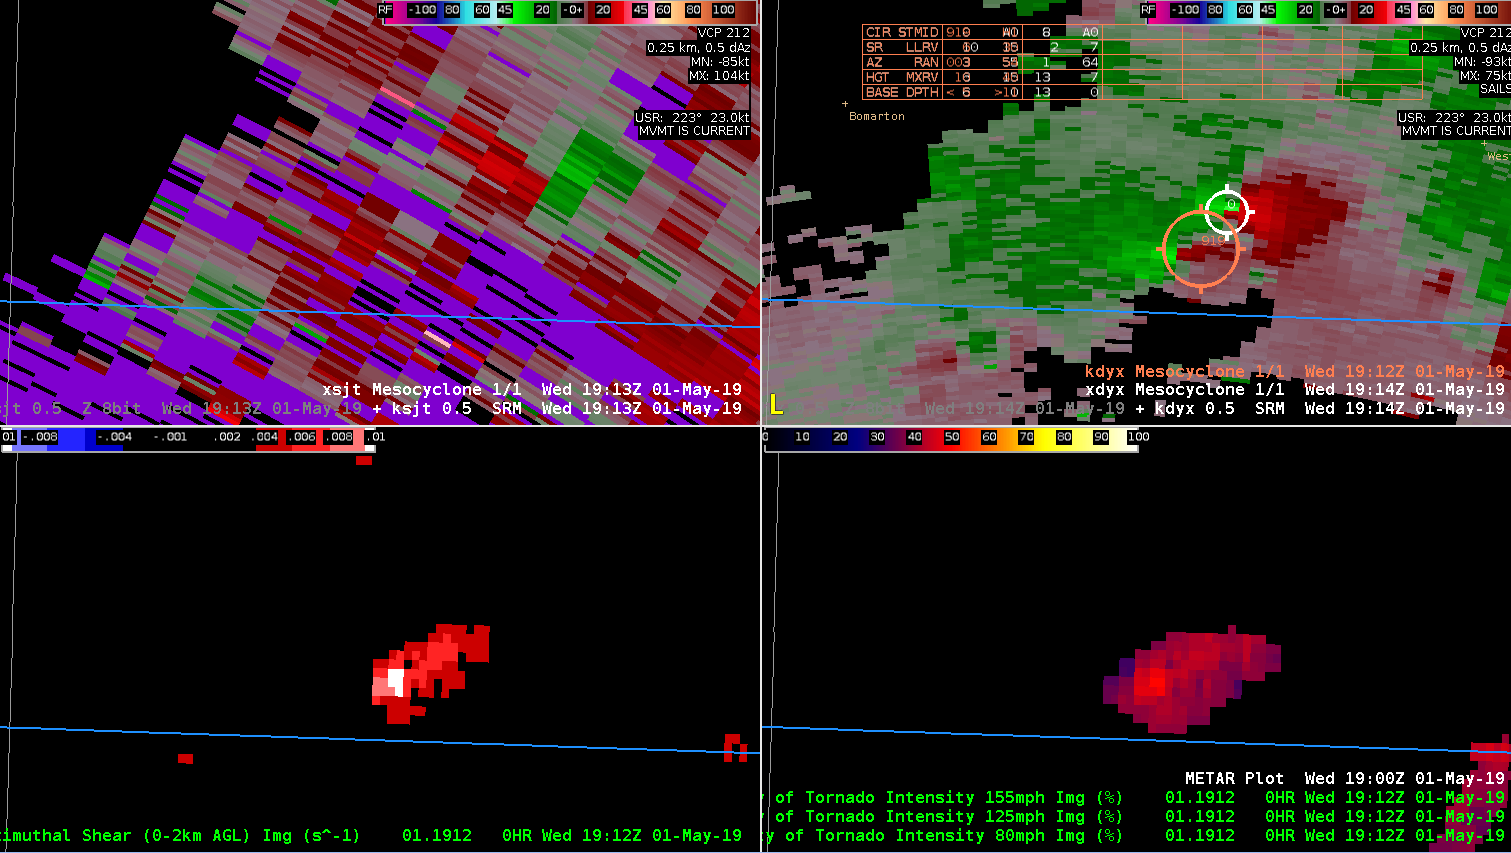
Merged 0-2km AZ-Shear was struggling with detection of second meso. Old MDA just broad-brushed both meso’s and NMDA identified the northern meso but failed to identify the second meso. – Jake Johnson
Official websites use .gov
A
.gov website belongs to an official government
organization in the United States.
Secure .gov websites use HTTPS
A
lock (
) or https:// means you’ve safely connected to
the .gov website. Share sensitive information only on official,
secure websites.

Merged 0-2km AZ-Shear was struggling with detection of second meso. Old MDA just broad-brushed both meso’s and NMDA identified the northern meso but failed to identify the second meso. – Jake Johnson
The supercell over NW TX developed a new meso. AzShear also picked up on both circulations. ProbTor values remained relatively low (~3%) throughout this transition. AzShear was weak with SRH only 107 m2/s2, mean wind was also low at 22 kt – all enviro. parameters were near the climatological averages not increasing the ProbTor above average values.
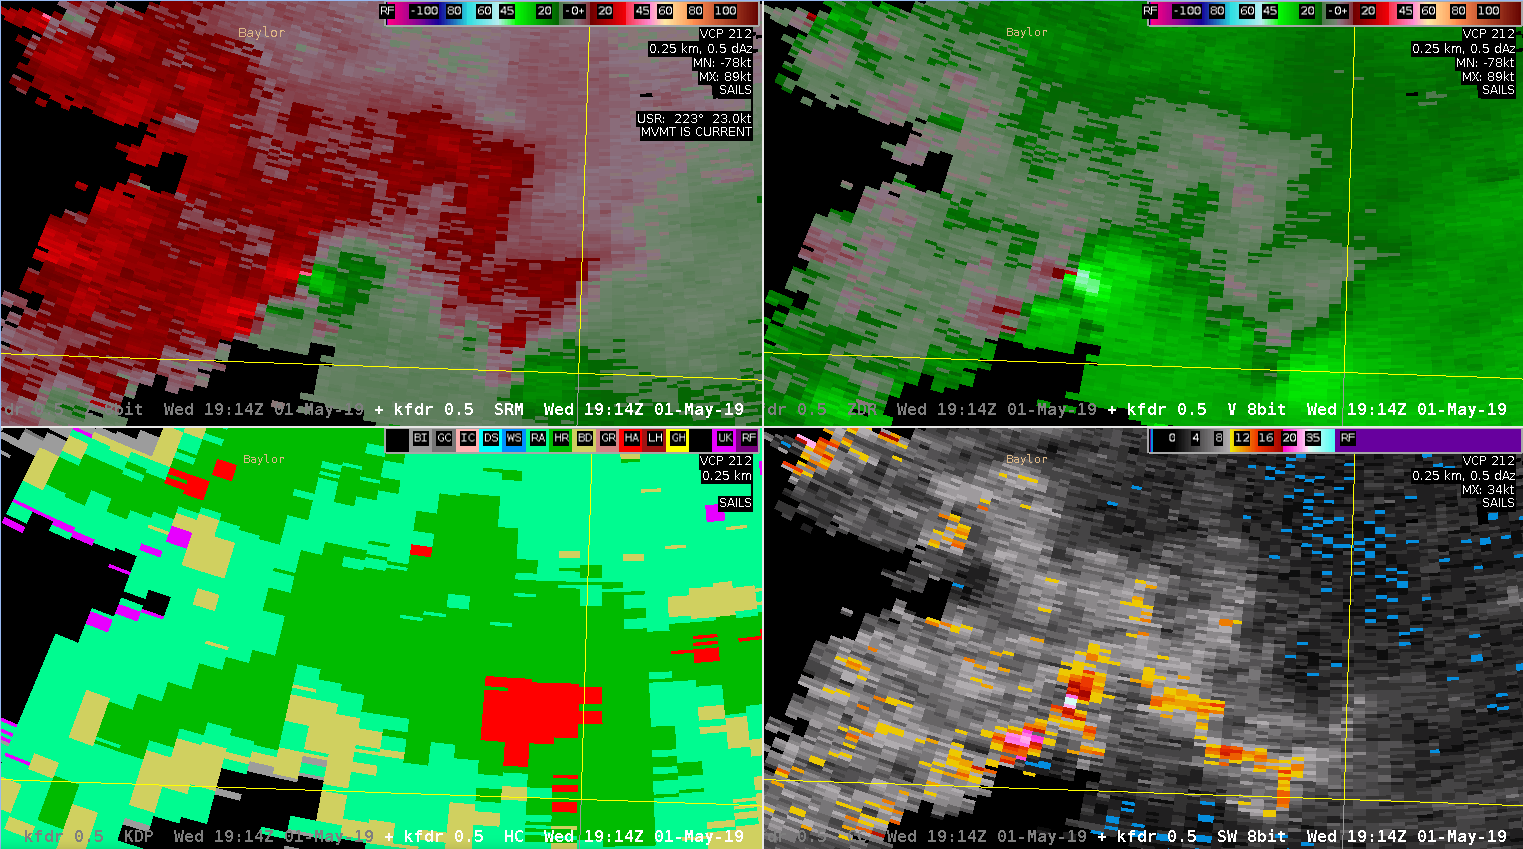
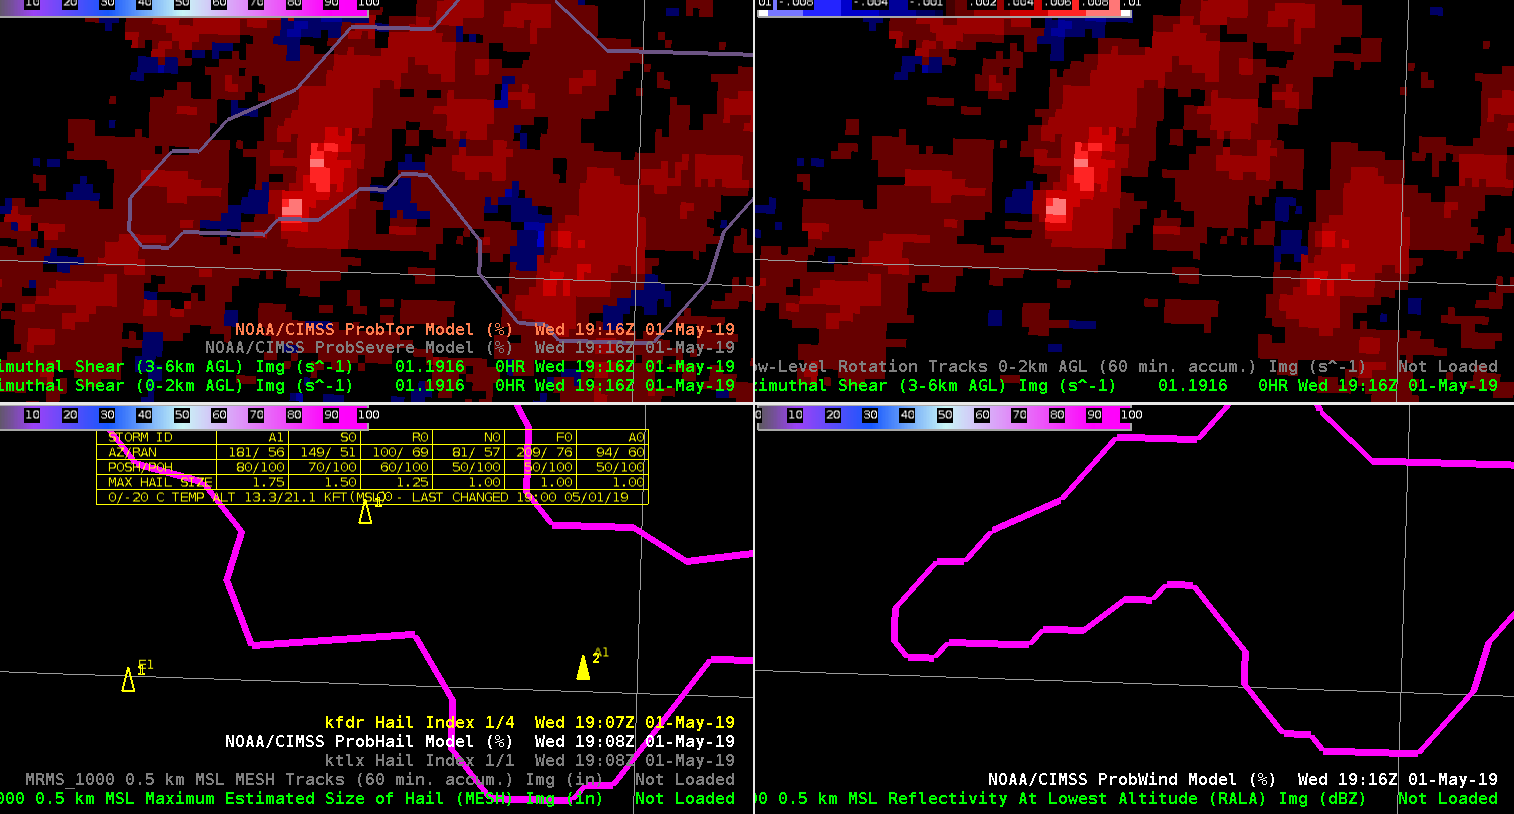
A quick look at the single radar AzShear product vs. the merged 0-2km product for a QLCS event. The single radar AzShear is far more granular and brings my attention to specific points of the line to interrogate further. However, the merged product is washed out…As a result, it’s potential utility to highlight areas of interest is degraded. Perhaps it would be most useful for general trends, but for storm-scale interrogation it leaves me wanting.
I do think the single radar AzShear product has promise with respect to increasing lead times, especially for QLCS circulations. But without other cases to examine, I can’t say for sure. It does show promise (especially when coupled with base velocity and spectrum width) with highlighting the areas of interest a scan or two before velocity couplets develop.
–Stanley Cupp
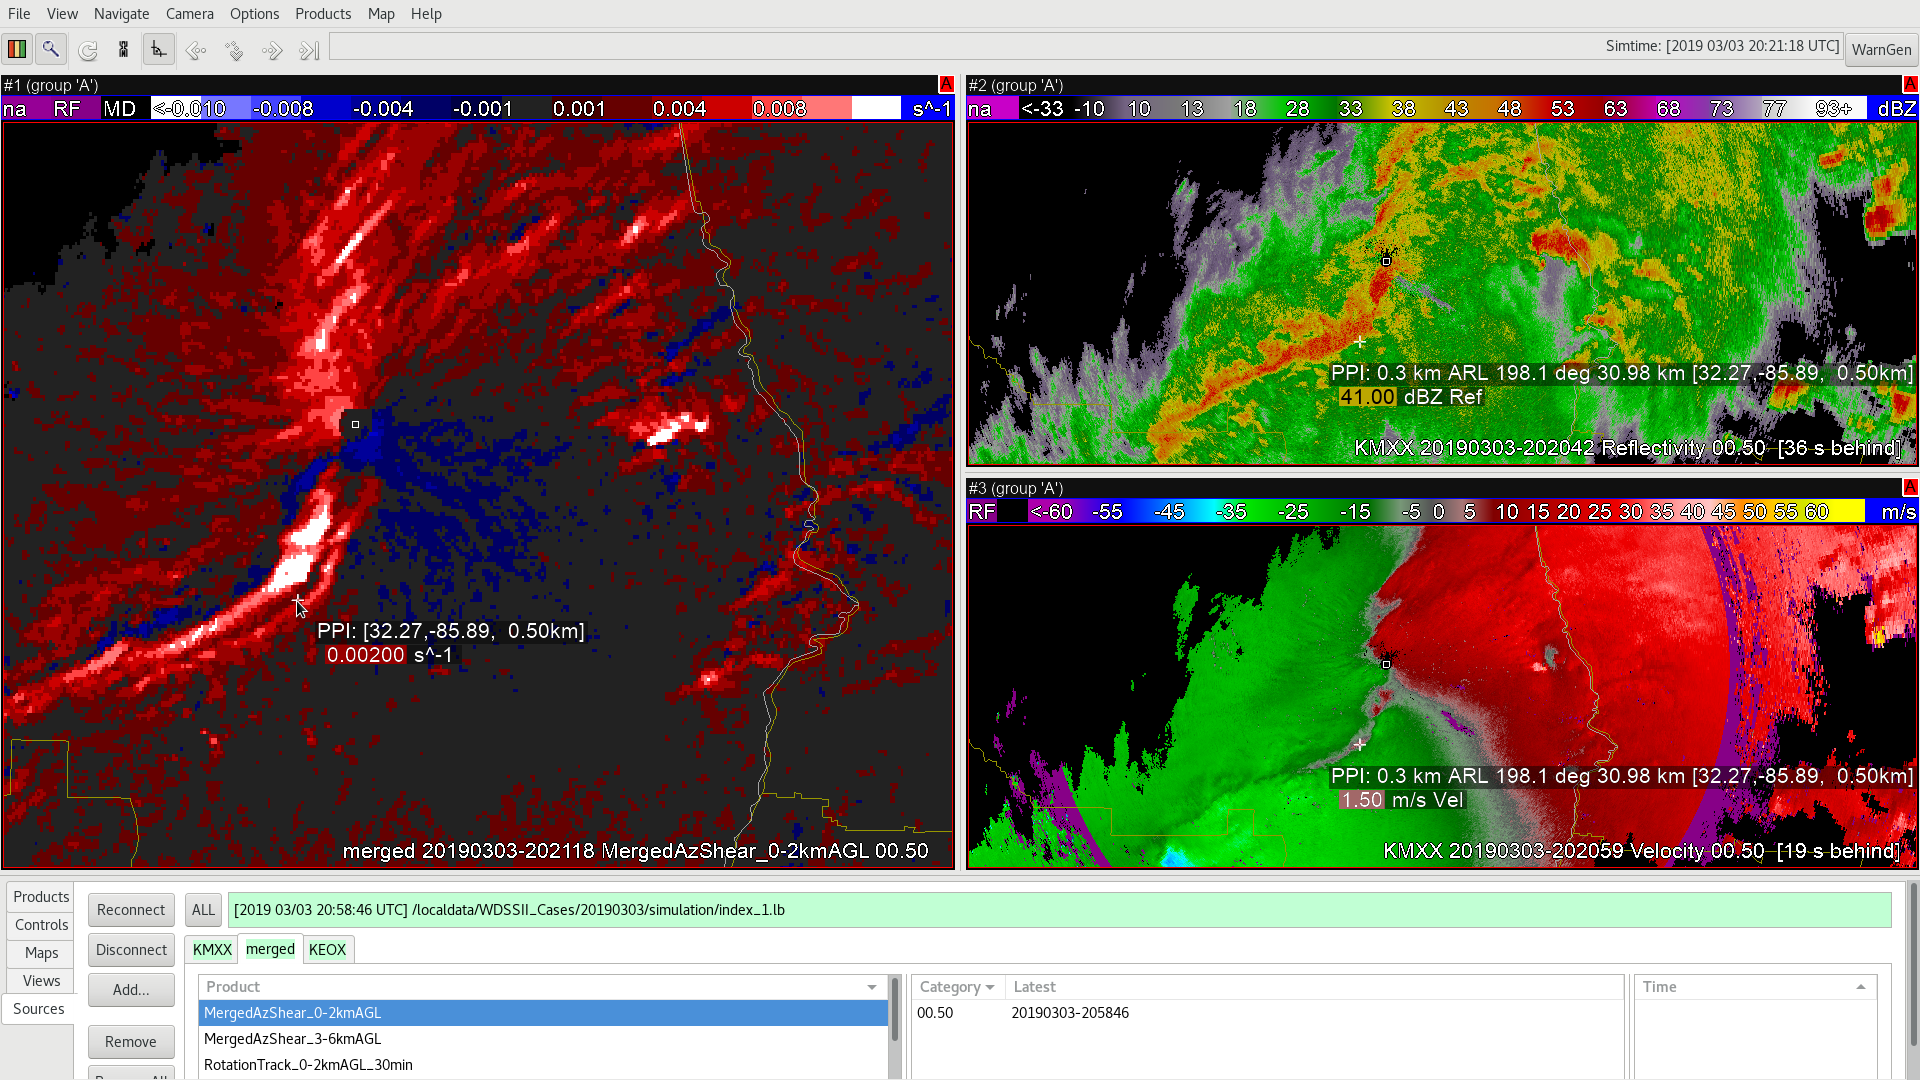
2021z merged 0-2km AzShear (left): very messy and washes out a lot of the storm-scale features. Also shows a leading area of shear ahead of the main line. This is likely due to SAILS cuts and different scanning modes for the radars used in the creation of the product. Something to watch out for in future events – this is an artifact that needs to be identified when using this product.
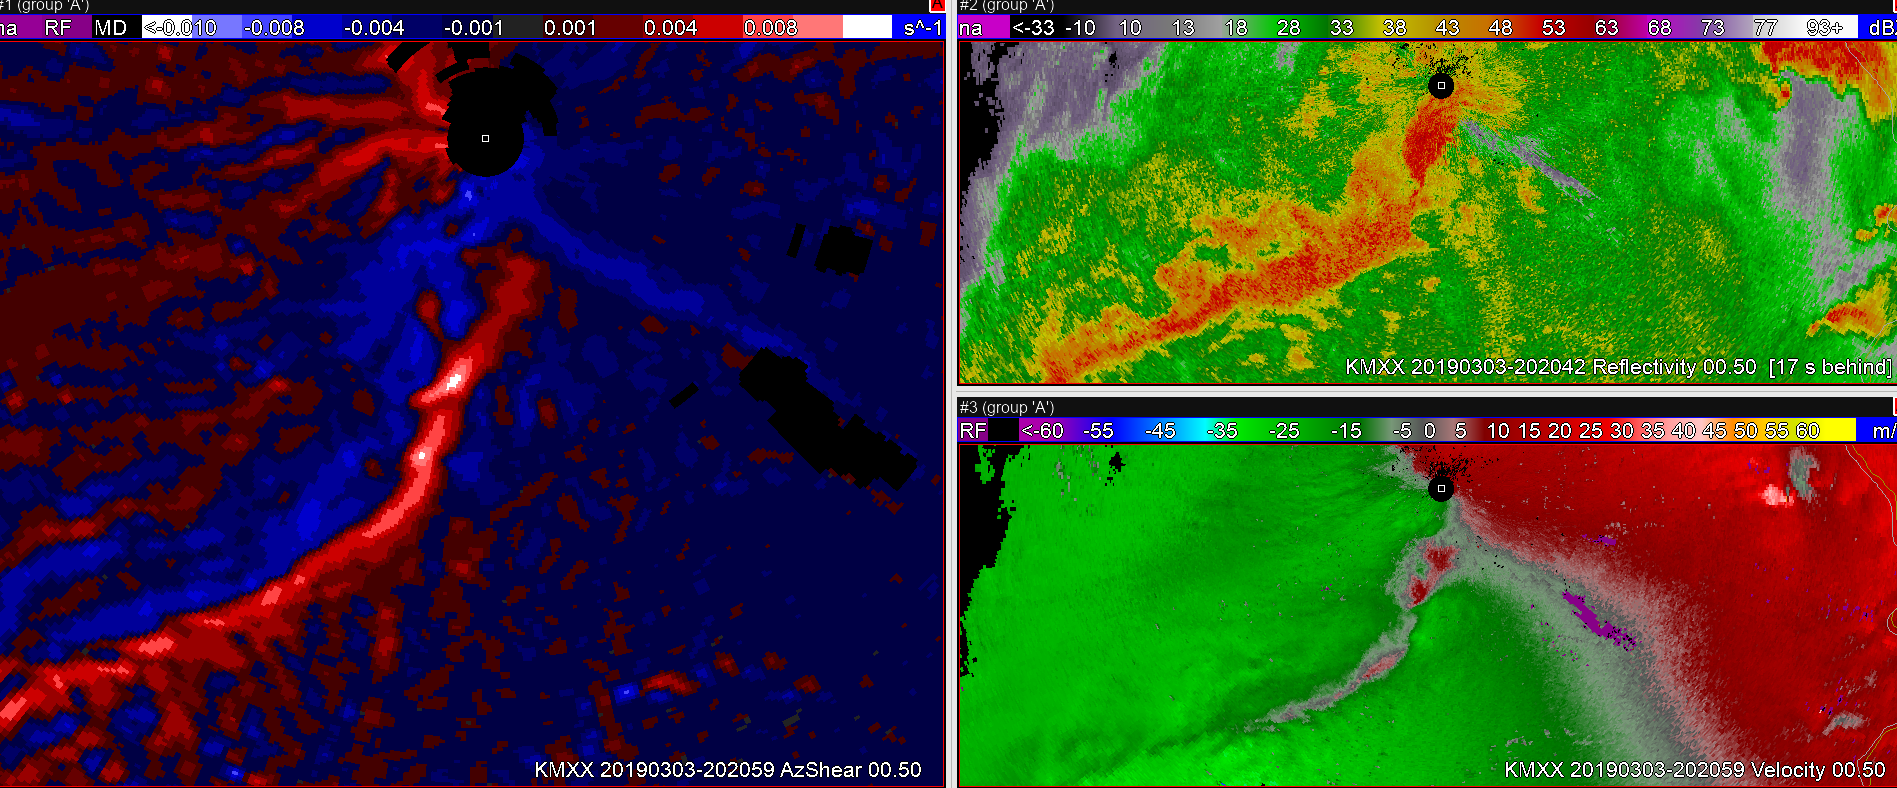
2020 KMXX AzShear highlights 2 main areas of interest along line of convection
2024z: AzShear and velocity begin to show that the southern most of the 2 areas is becoming an increasing concern. Would likely have a tornado warning out at this point, if not the prior scan (especially given the favorable environment). Spectrum Width (top right) also helps diagnose the increased velocity signature on the southern most area compared to the northern one.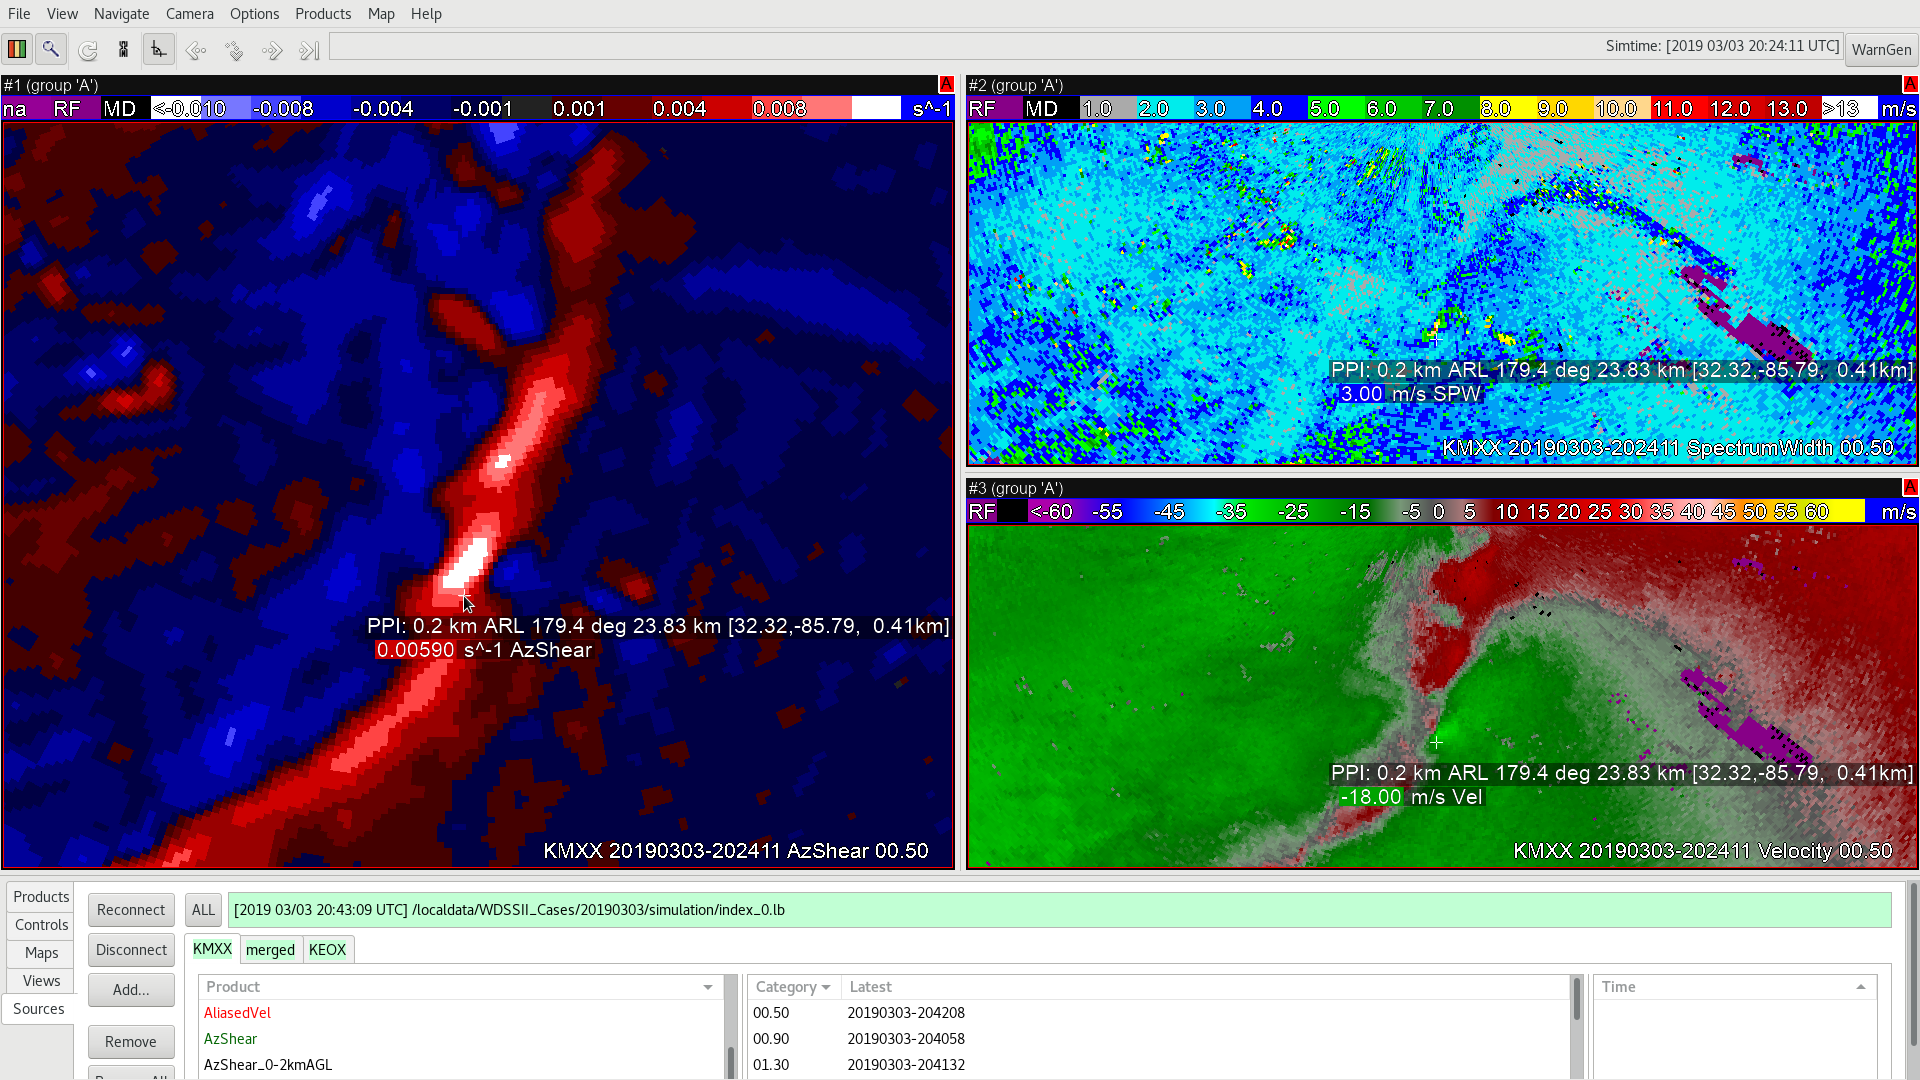
And by 2030, a distinct velocity couplet developed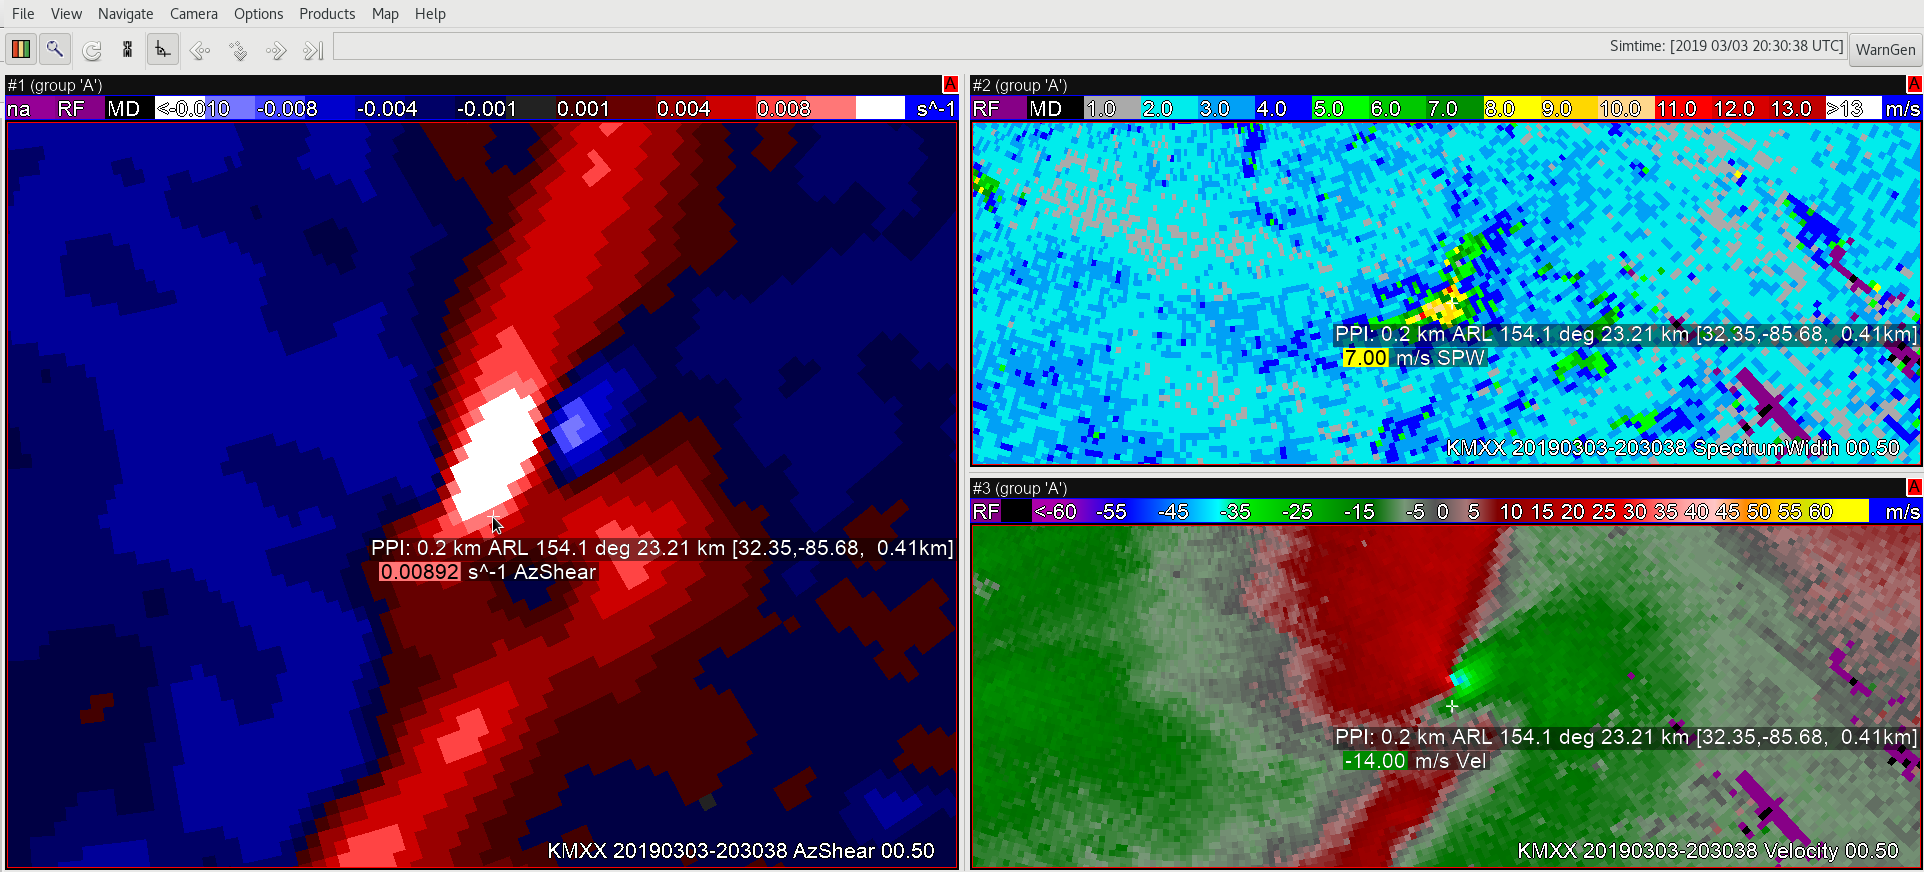
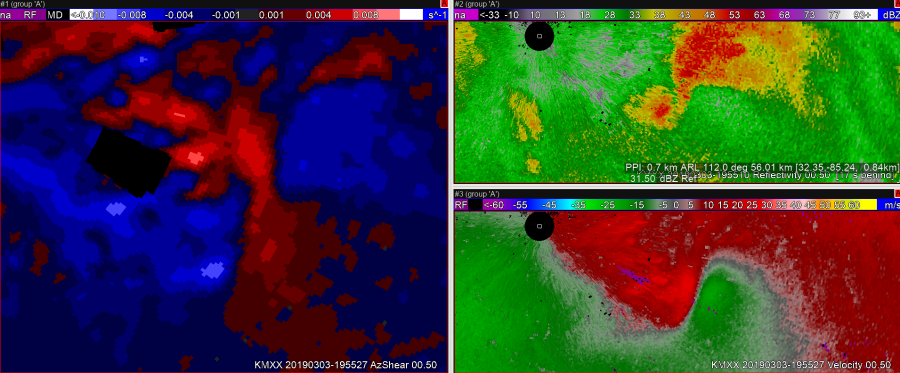 The case above shows a situation where due to the orientation of the zero isodop compared to the radar location, AzShear values are surprisingly low considering the strength of the convergent signature that preceded tornado development.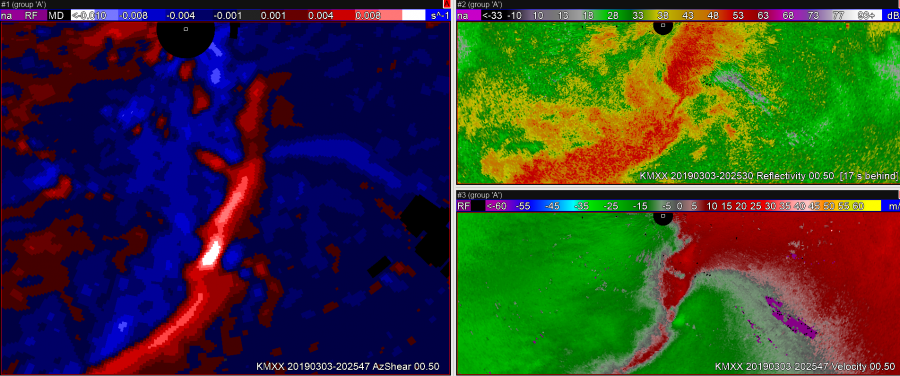
The case above shows different tornadic circulation developing, but this time to the south of the radar – a different orientation of the convergent signature relative to the radar. In both of these first two cases, the eventual tornado had not touched down yet, but the AzShear values were quite different. Training on zero isodop and how its orientation relative to the radar affects AzShear should be created for users before this product is used operationally. 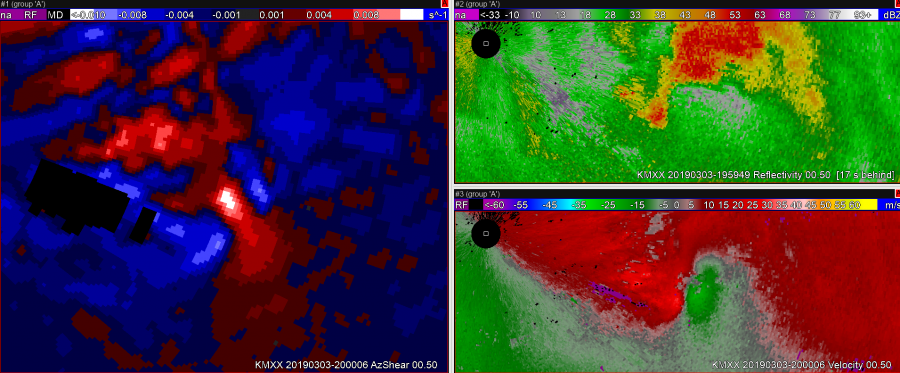
This image shows the first circulation a bit farther in time as the orientation of the convergence changed and AzShear value bins began to max out.
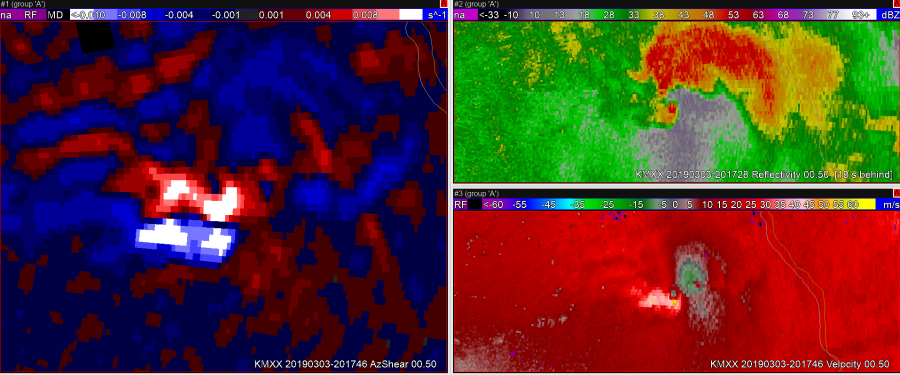
A case where using a color table with bins detracts from the usefulness of AzShear. There are two areas of high AzShear indicated, however very different things are going on in each of these locations. One is a strong tornado on ground the other is flanking line convergence. These two features should not have the same color if this product is to be used in operations. Consider a graduated color ramp with a high range instead of broad bins.
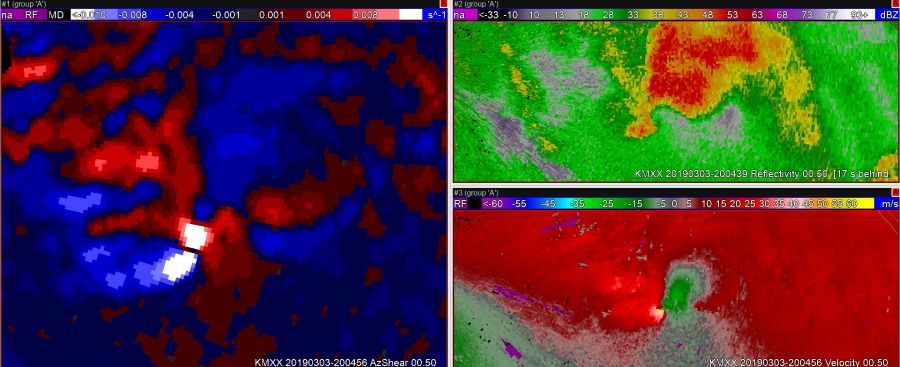 A case where the anticyclonic shear component is extremely prominent in AzShear. Are these regions useful for forecasters focusing on the tornado? Are they more of a distraction? They could be a distraction in some situations.
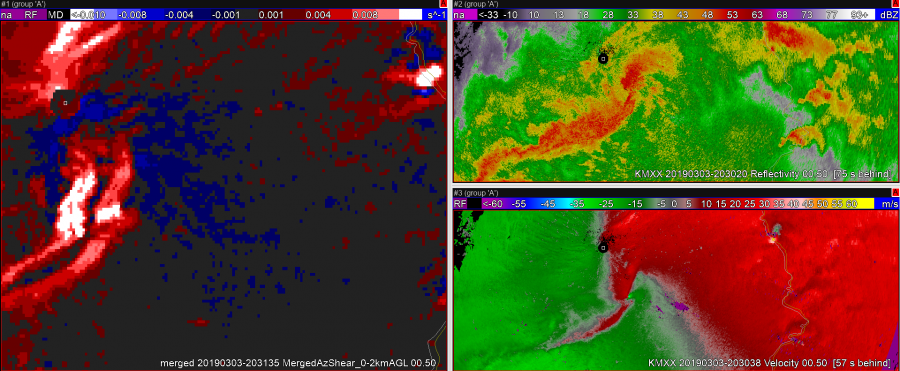
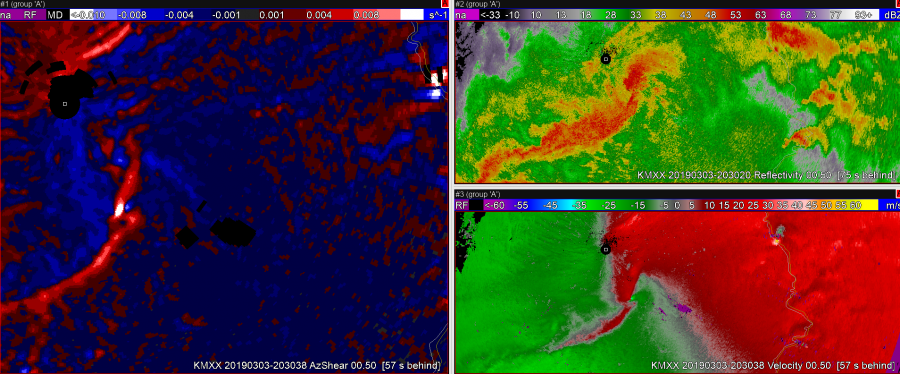
The two above images compare 0-2 AzShear (top) and single scan AzShear (bottom). Due to multiple sampling by multiple radars, it appears as though 4 different iterations of the squall line shear boundary are plotted. This renders the merged 6646data almost useless for interpretation purposes. The single scan data removes this issue. Also from these screen grabs, it appears as though the farthest east scan is coming from the KMX, the single scan site used here.
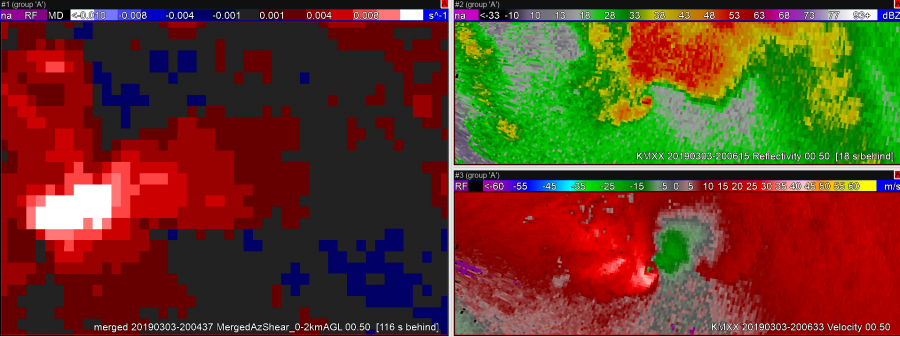
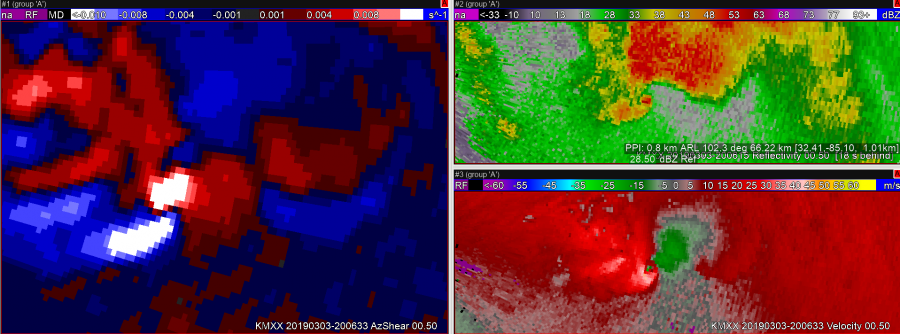
The two examples above show the benefits of single radar versus merged once again. The merged azshear core is several miles behind the circulation center at this time. The single radar data follows the current velocity scan as expected. In a time-sensitive warning operation scenario, knowing this I would likely use the single radar product exclusively.
-Dusty Davis
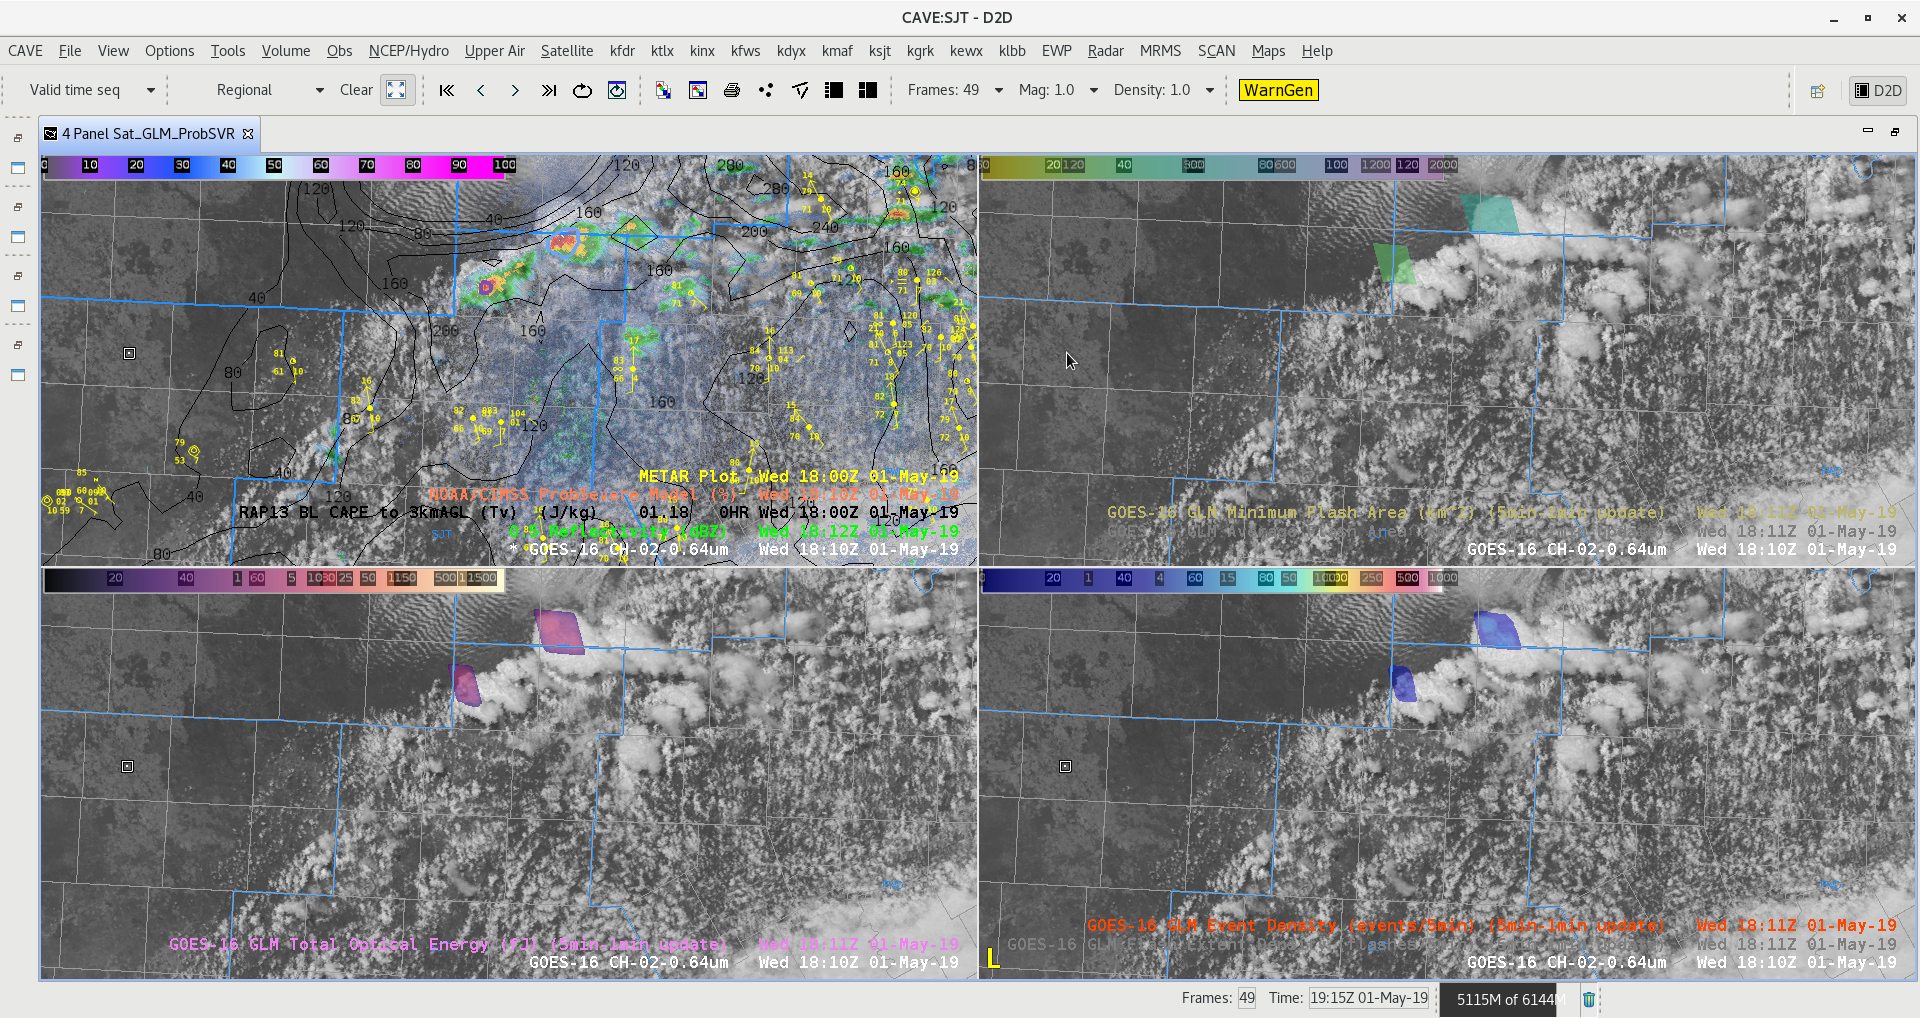
Figure A
Lightning and ProbSVR detection of first storm develop in west Texas. GLM products high-lighting two updrafts at 1810Z in Figure A.
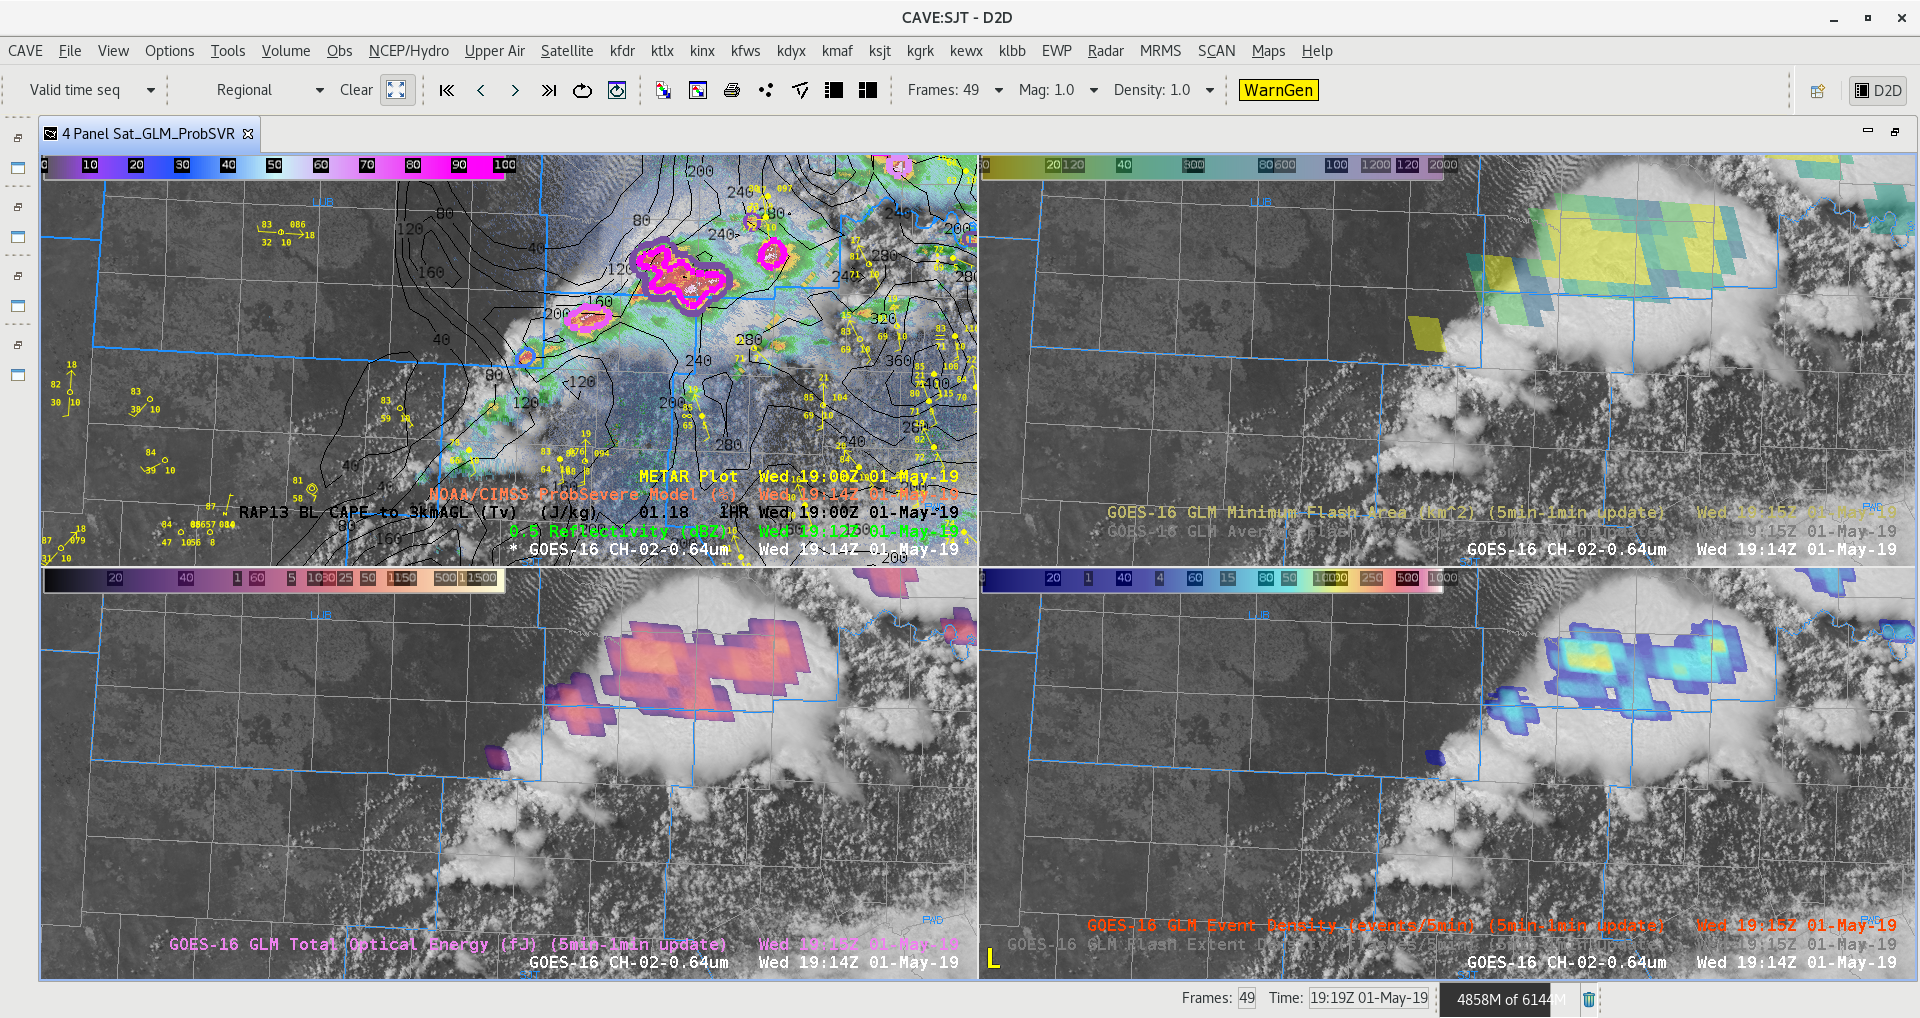
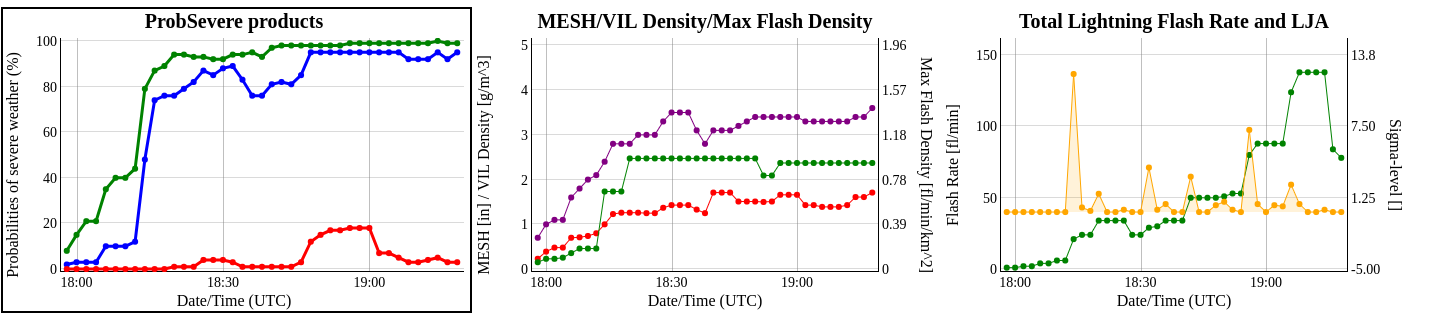
Lightning really increased showing lightning jumps and ProSVR Hail/Wind greater than 90% in time series trends. Notice Tornado trend increased slightly with lowering wall cloud report, however environment is not as favorable for tornadoes today with 0-1km shear on the low end.