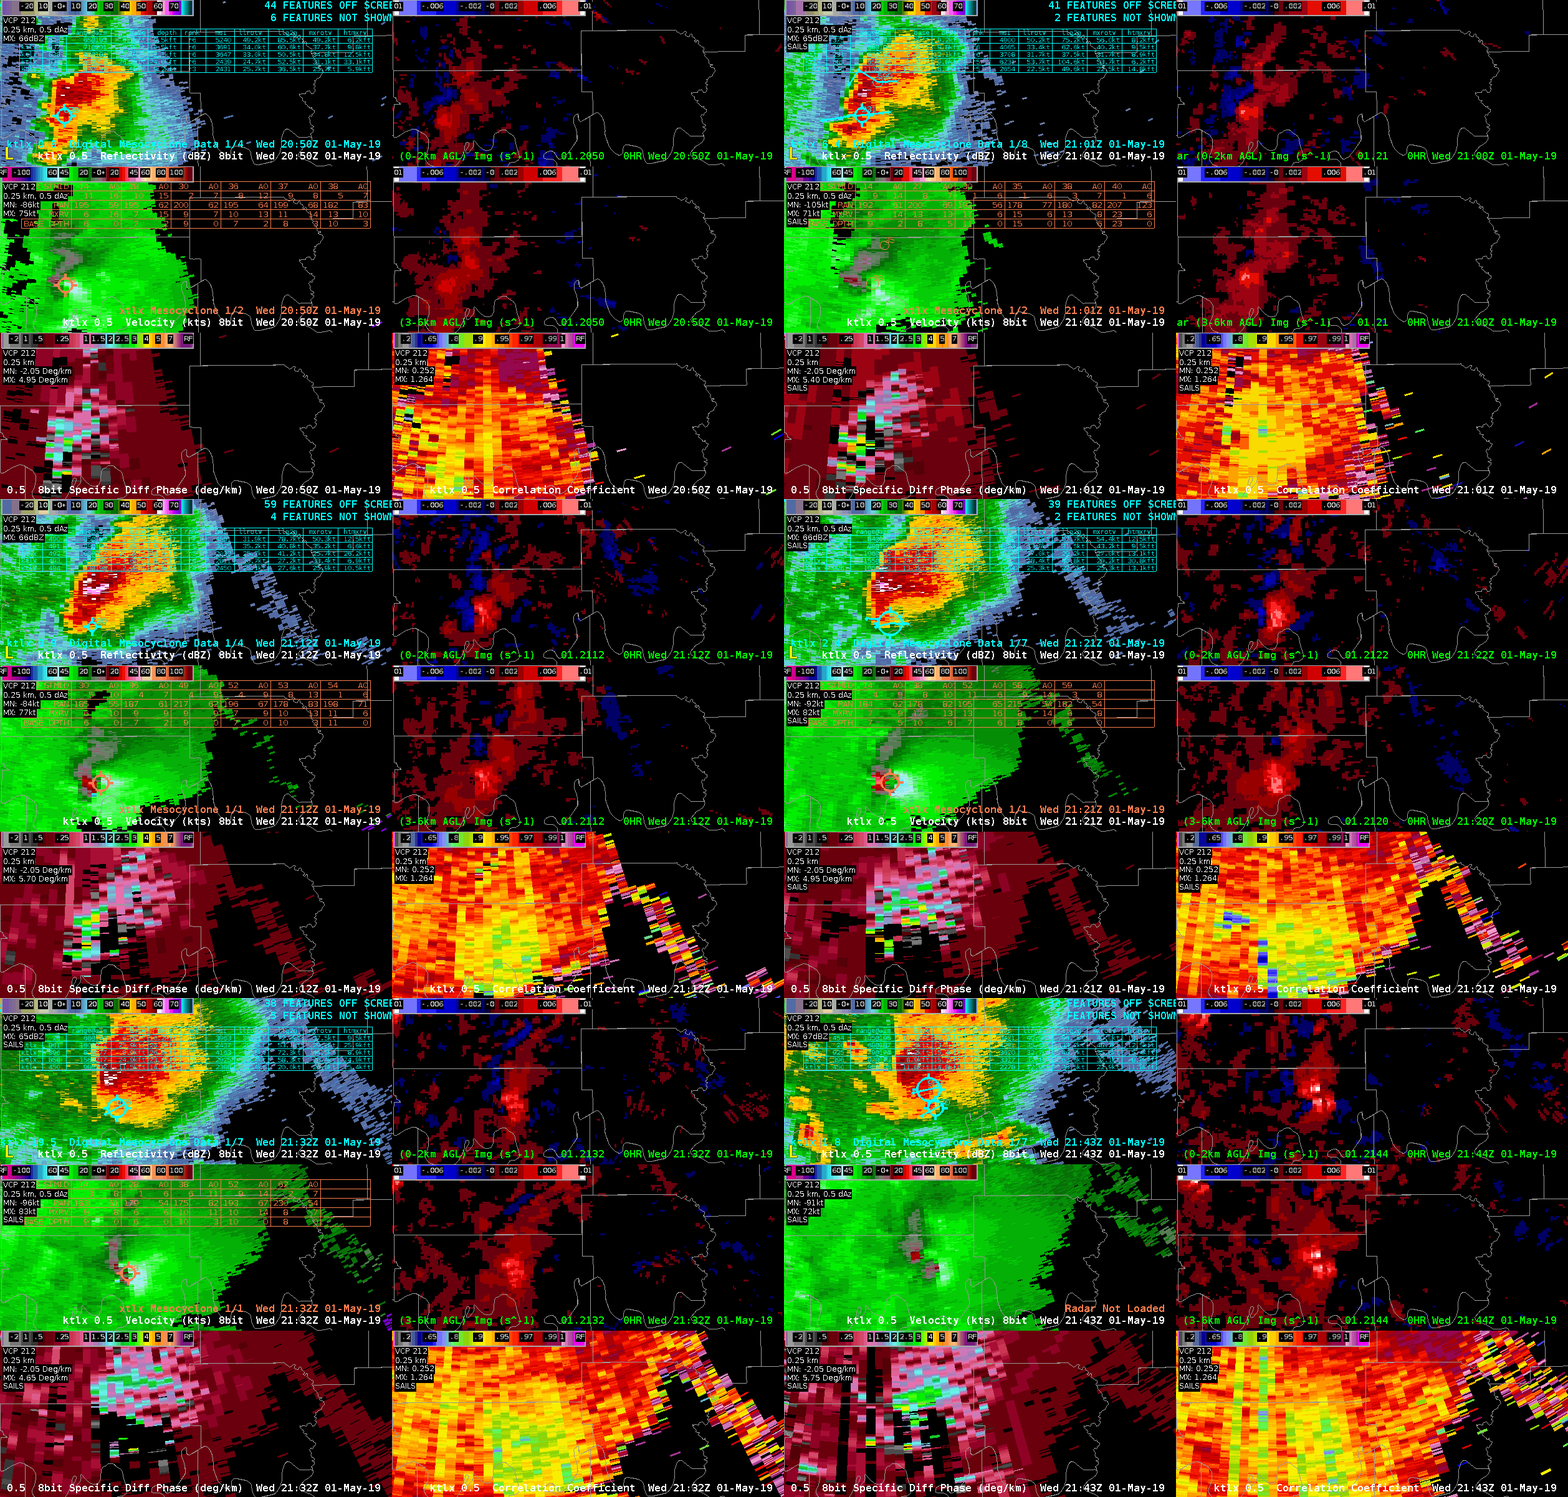
Multi-radar comparison of Tornadic Storm near Red River

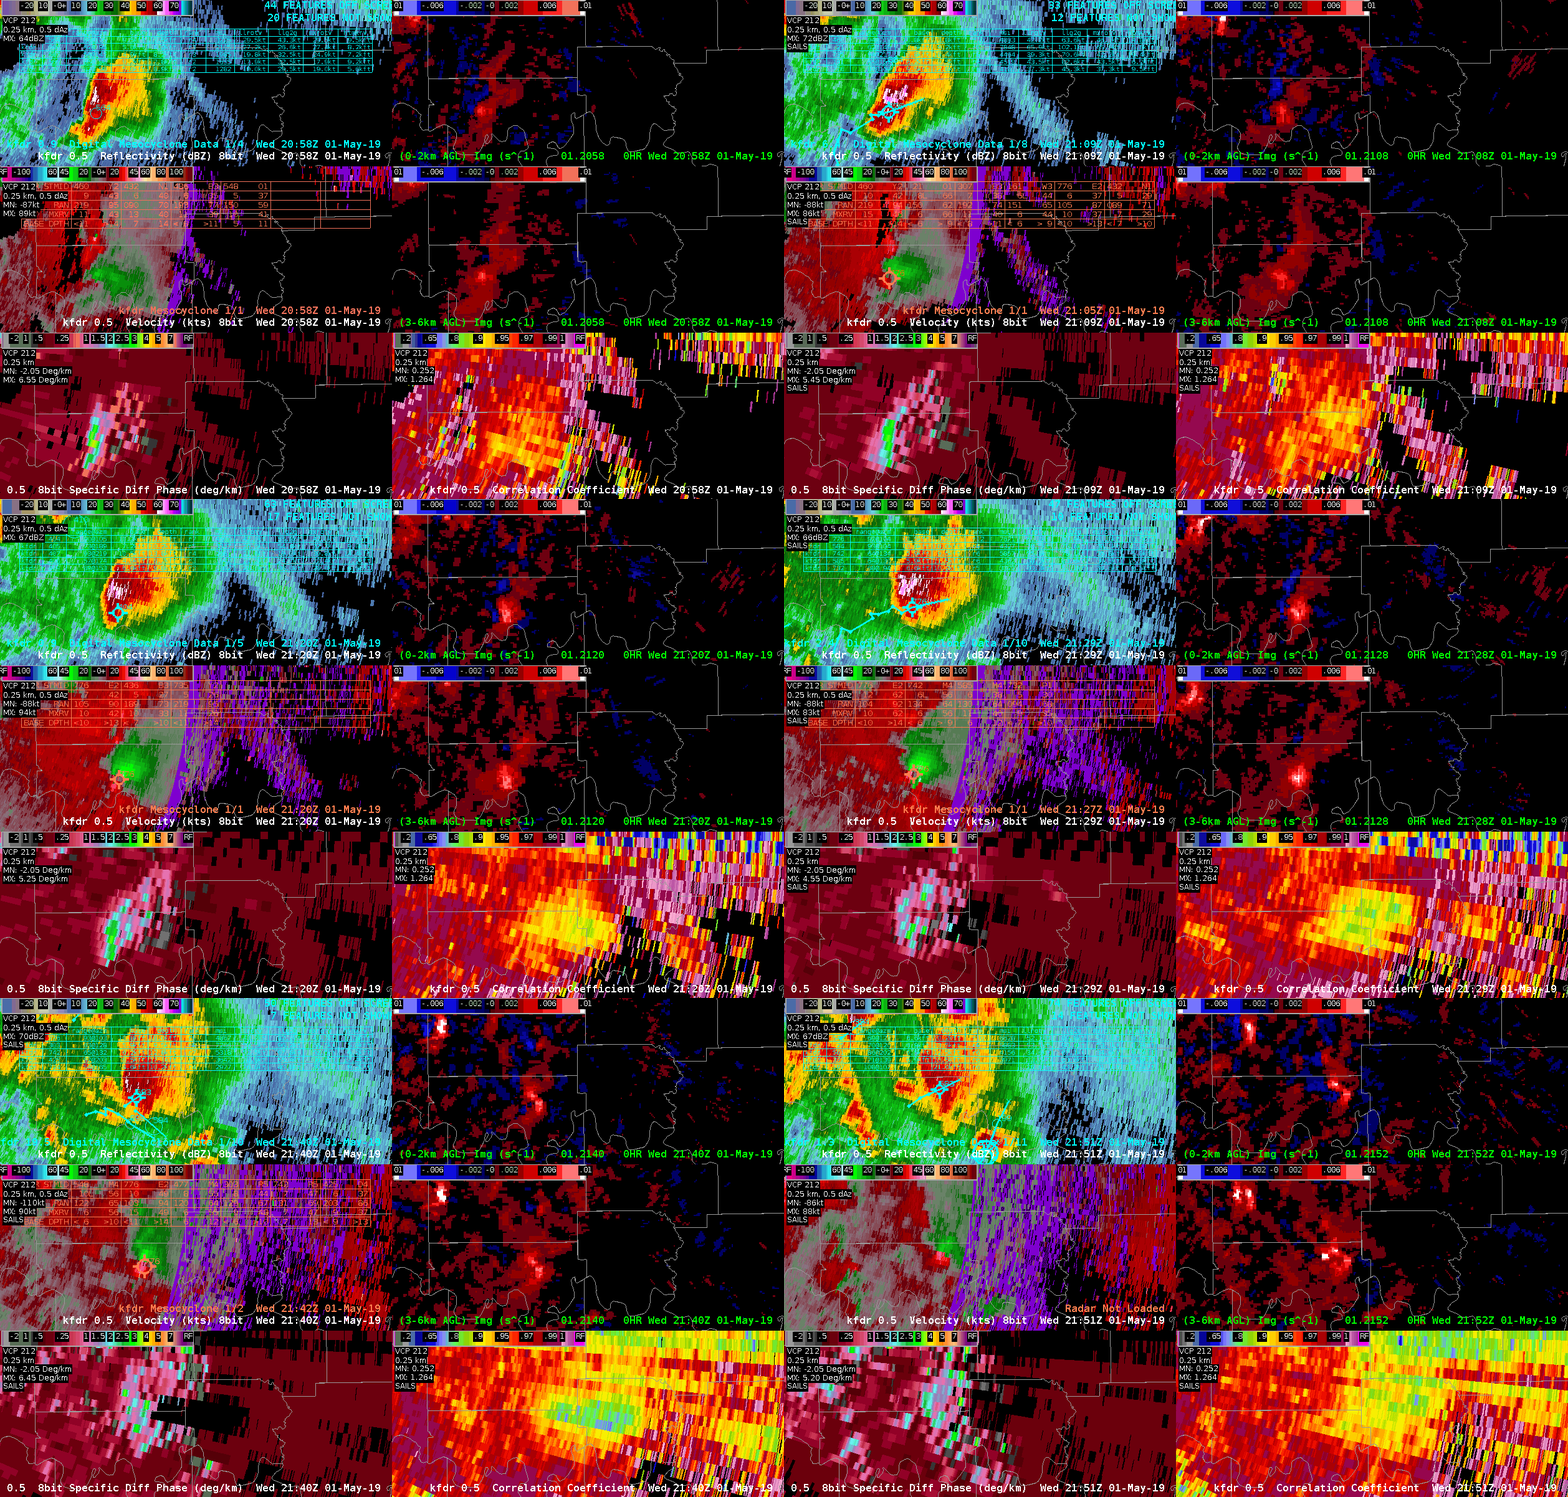
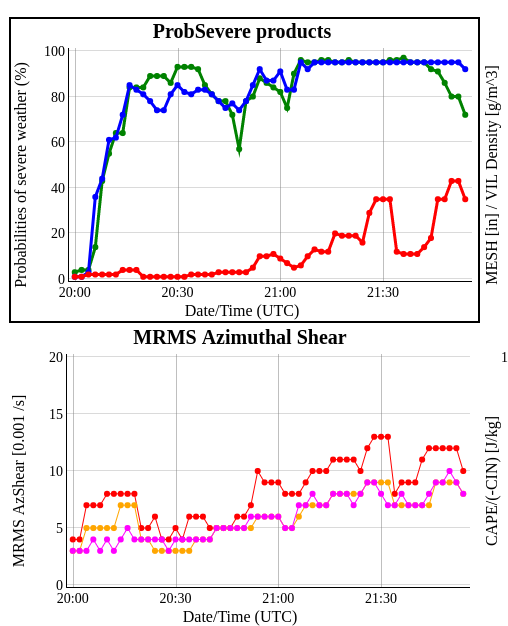
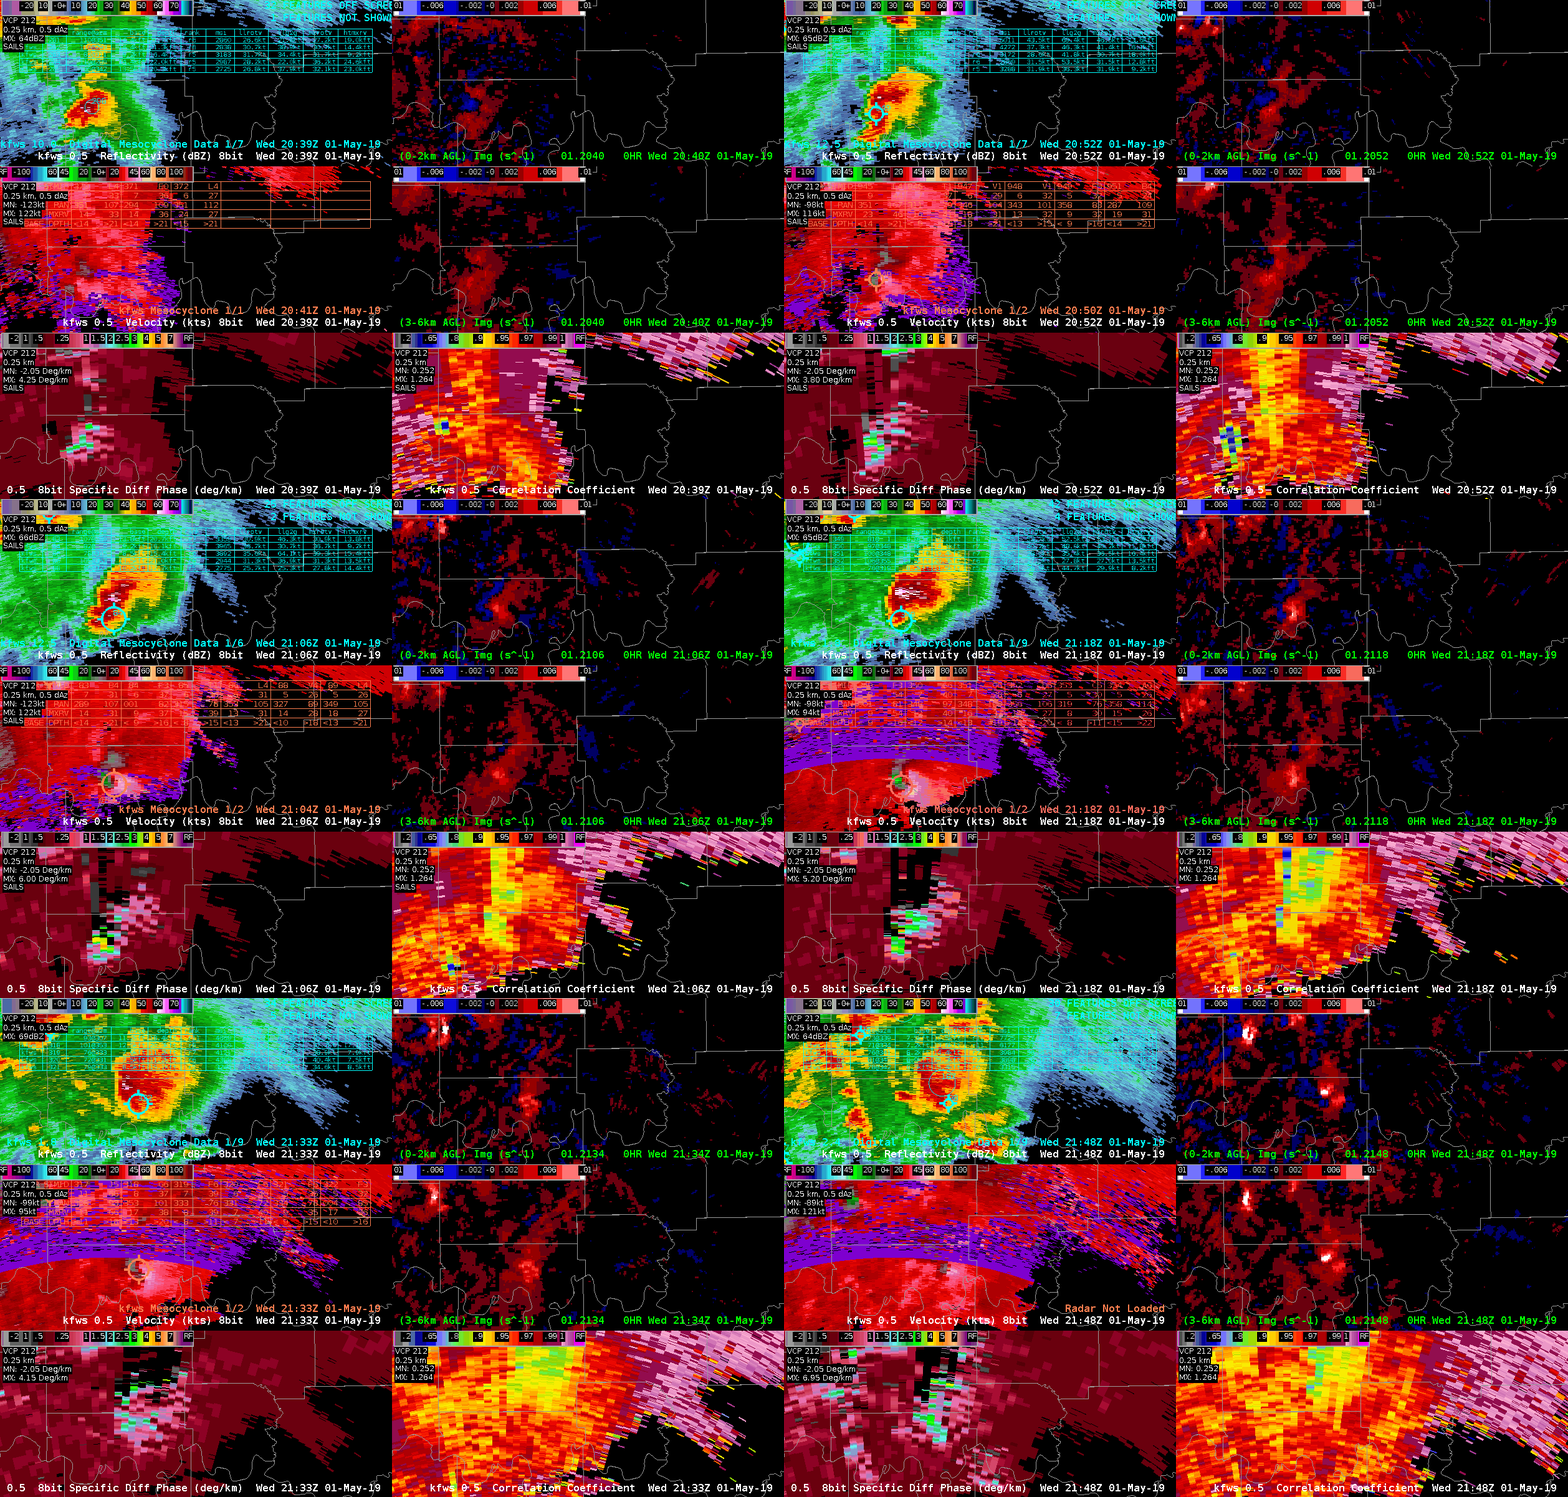
KTLX, KFWS and KFDR perspectives of tornadic supercell near the Red River.  Spotters indicated occasional brief touchdowns with this storm.  Animation is from 2050 to 2143 UTC around the time of the reported brief touchdowns.  Last image is the time trend of ProbTor  (red trace) and MRMS AzShshear (red trace).  KFDR seemed to sample the mesocyclone the best and subsequent gate-gate-shear (90 nm from RDA).  ProbTor indicated a gradual increase then took a sudden drop shortly after 2130 UTC, then continued to increase.  This may have been the result of a similar drop in the MRMS AzSHear.  Not clear why AzShear dropped off briefly (perhaps a sampling issue with one of the radars). However, radar SRM data did not show any indication of weakening circulation in any of the, in fact the velocity couplet was even stronger around 2130 UTC especially KFDR radar.  A caution to forecasters to be careful when examining trends in the ProbTor and be sure to examine the various inputs into ProbTor in conjunction with the radar (velocity trends). – Quik Twip
NUCAPS comparisons – modified versus unmodified

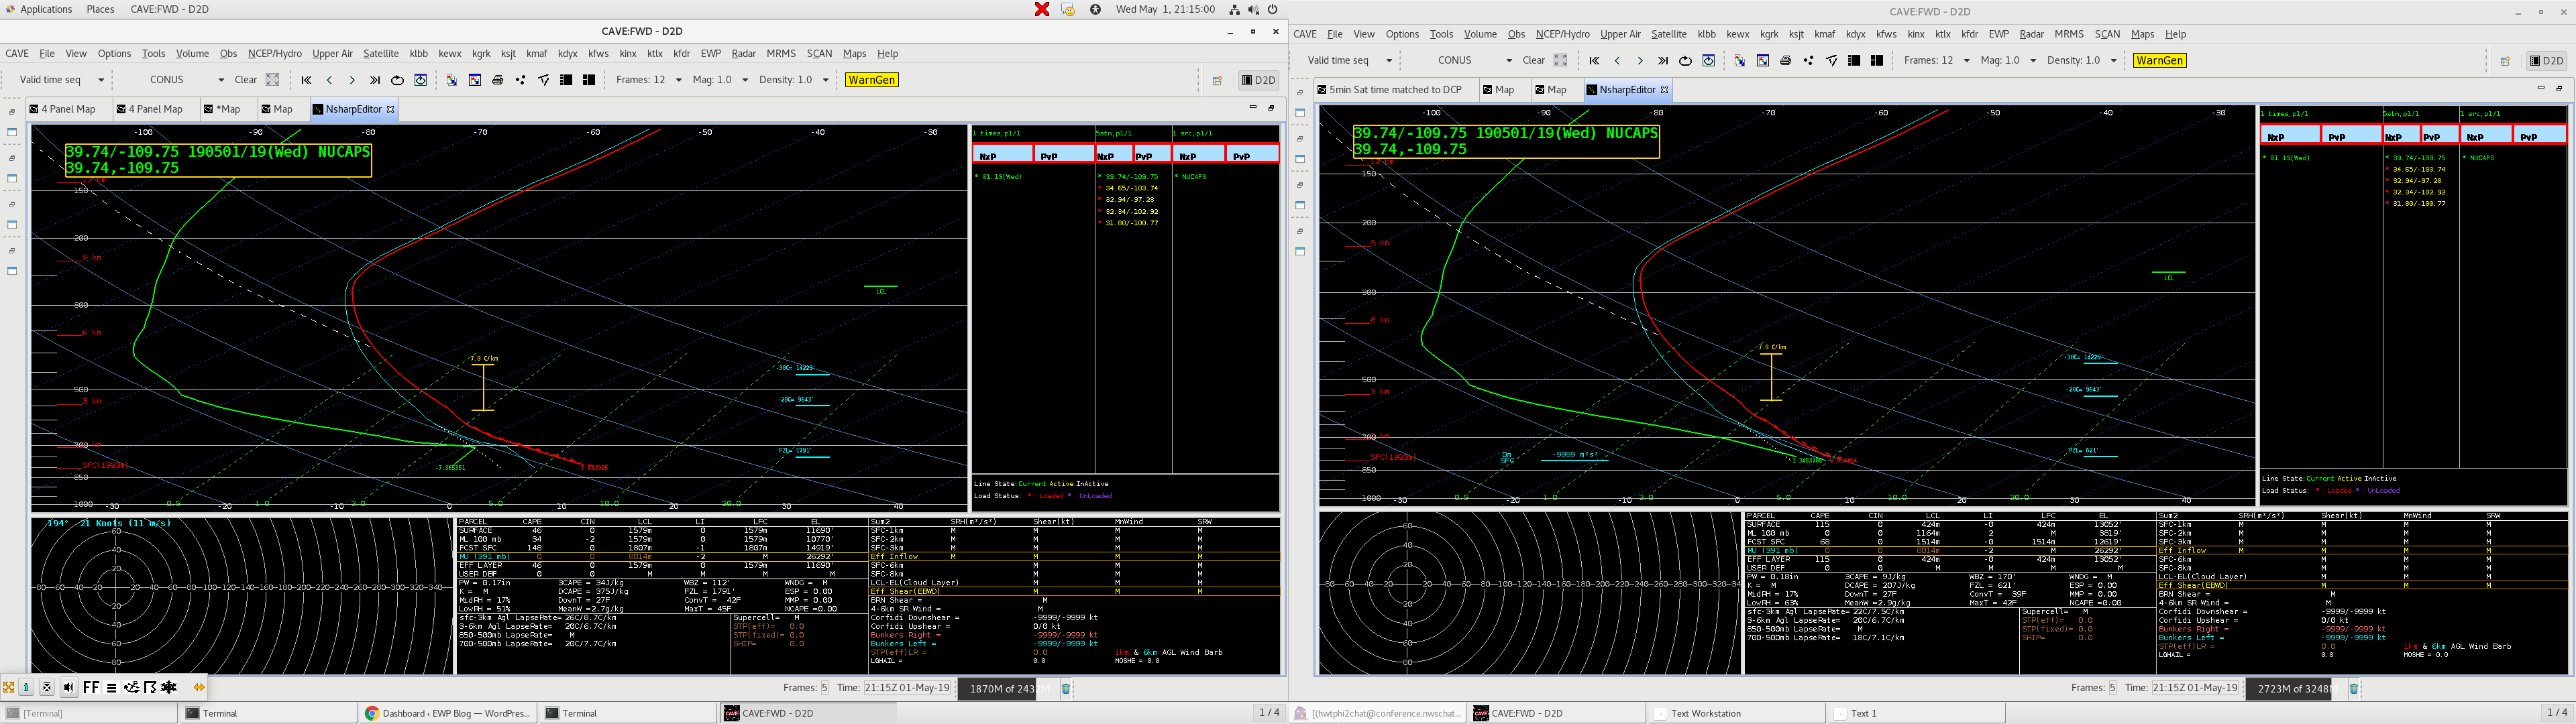
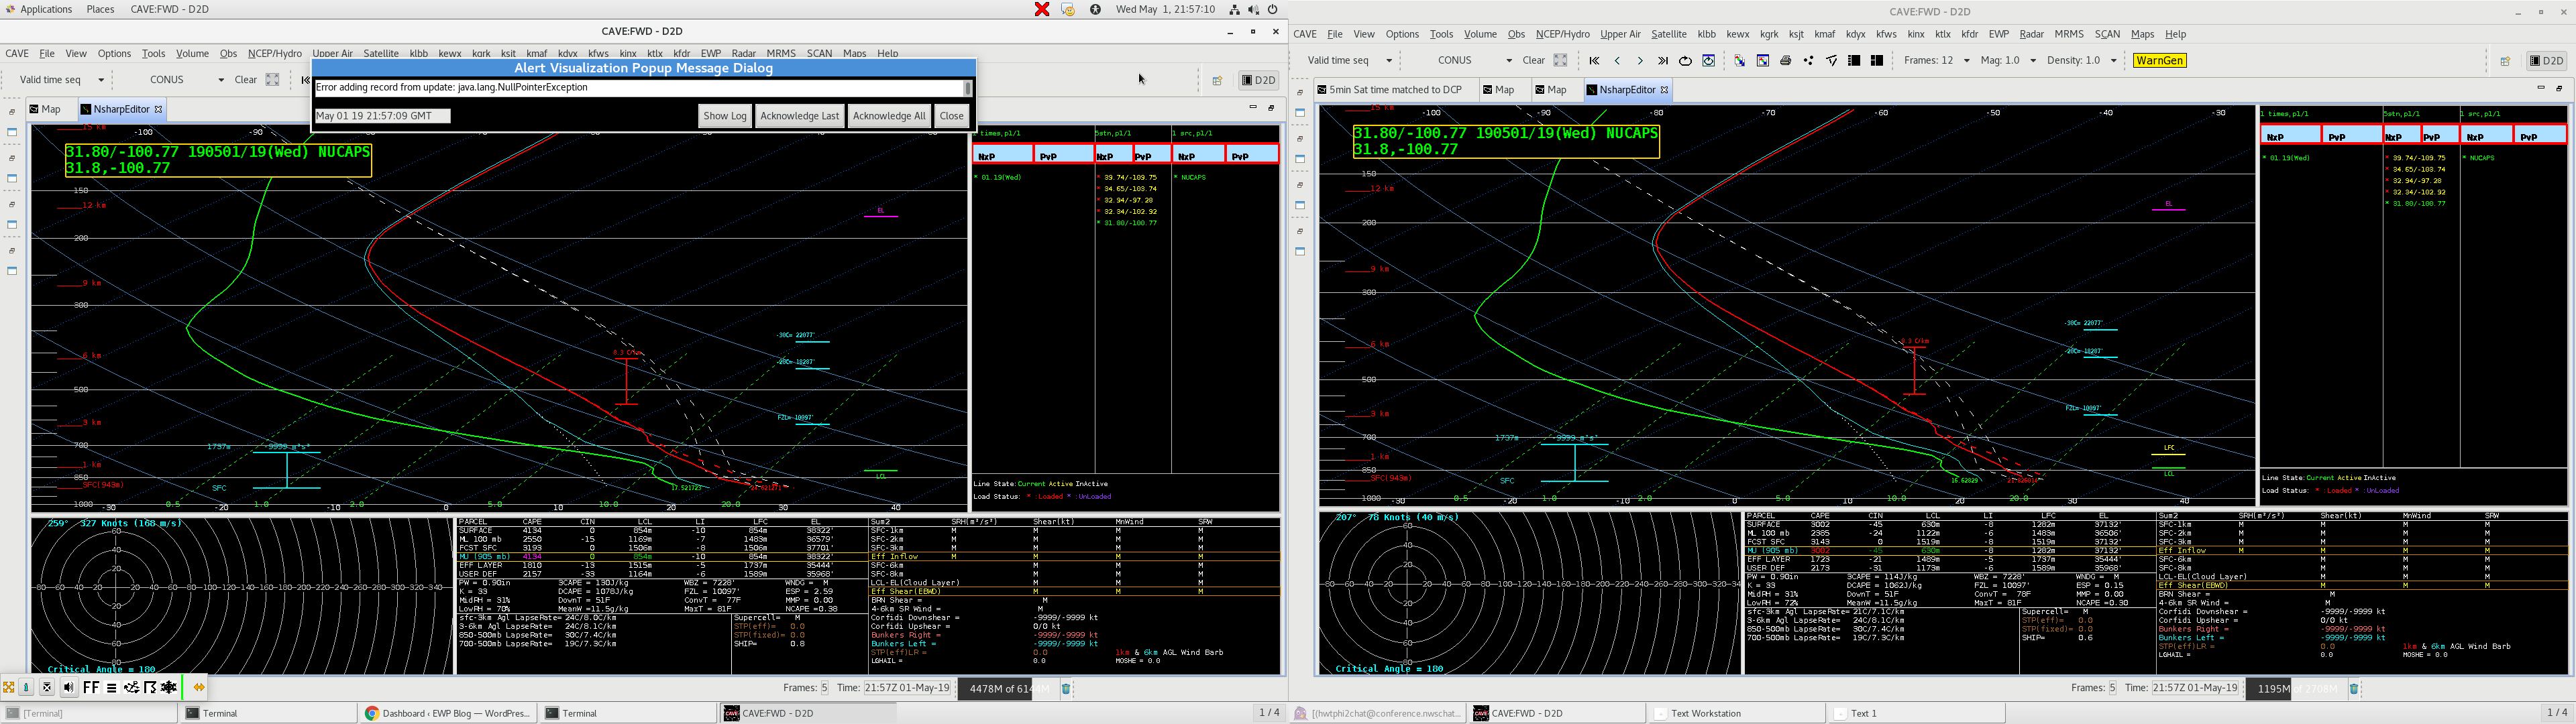
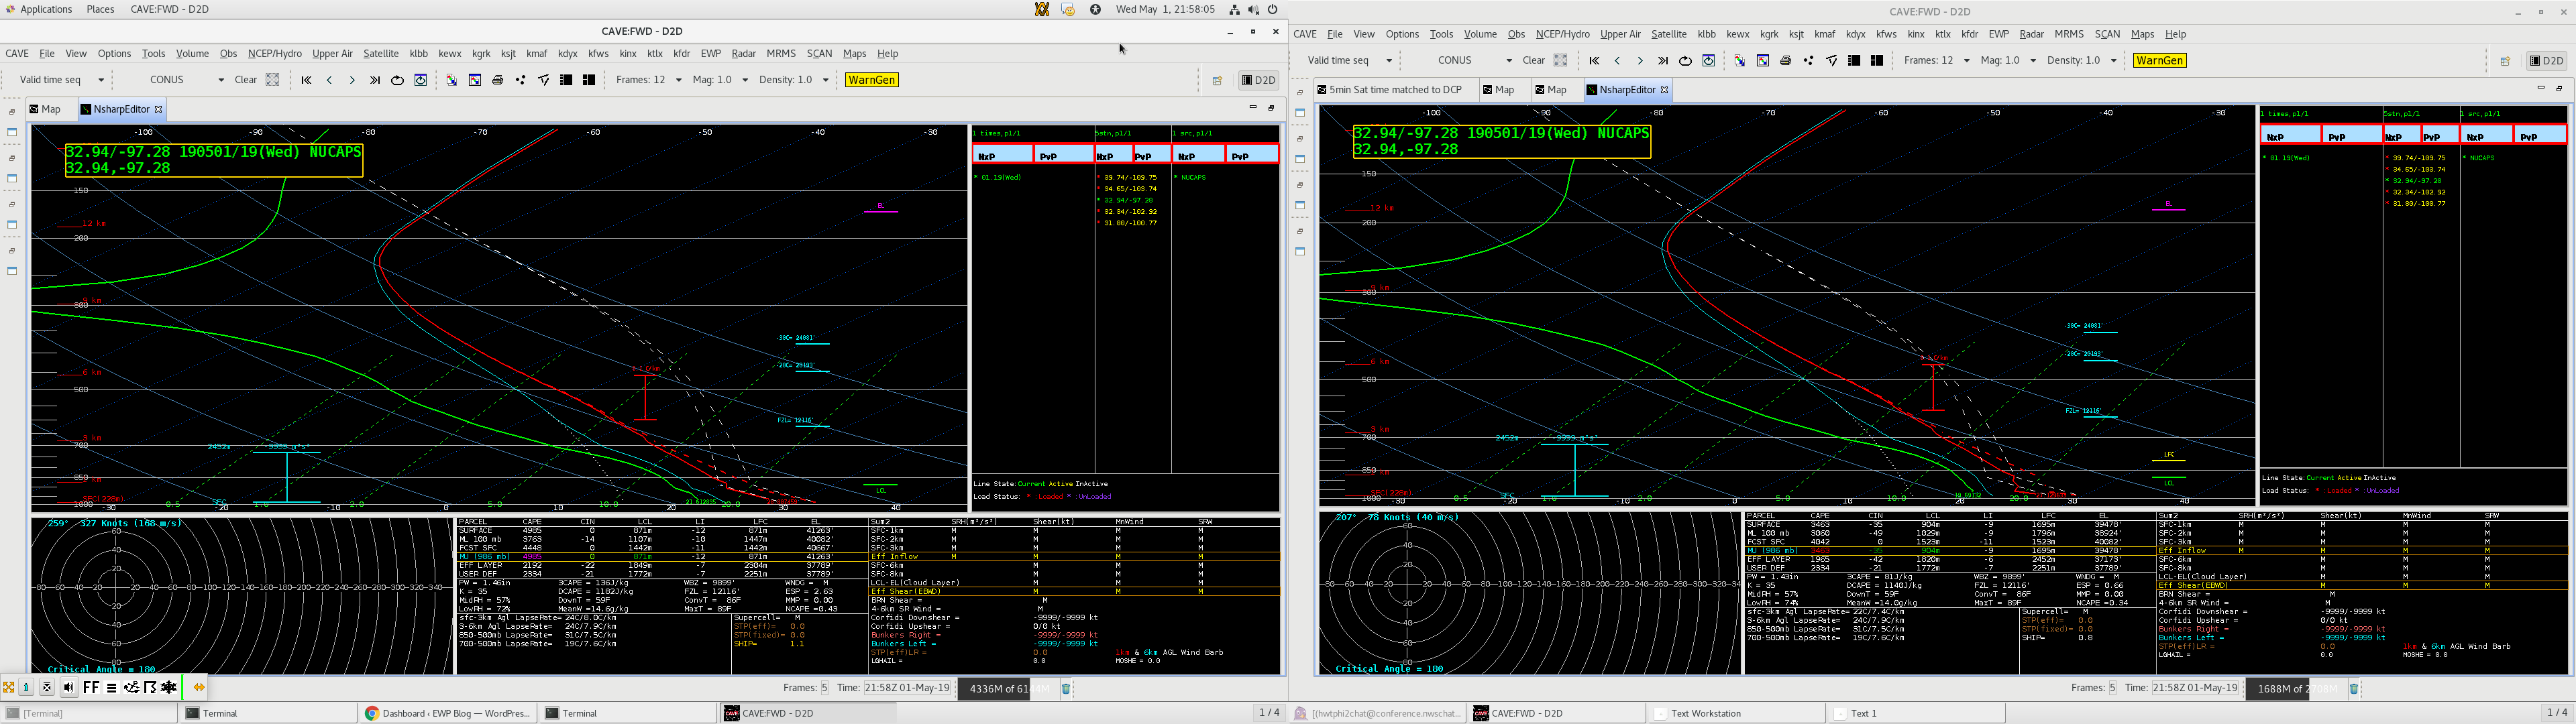
Compared several NUCAPS soundings across the pass to determine usefulness of the modified versus unmodified data. In each example, the modified is on the left and unmodified is on the right. The example above was quite dramatic. This was an example over my home CWA. The modified sounding on the left captures the true mixing likely taking place over the point to the north of GJT airport, the right has a vastly different temp/td profile. This would have dramatic impacts for fire weather and smoke dispersal forecasting in remote areas, which is a critical task provided by our office. 
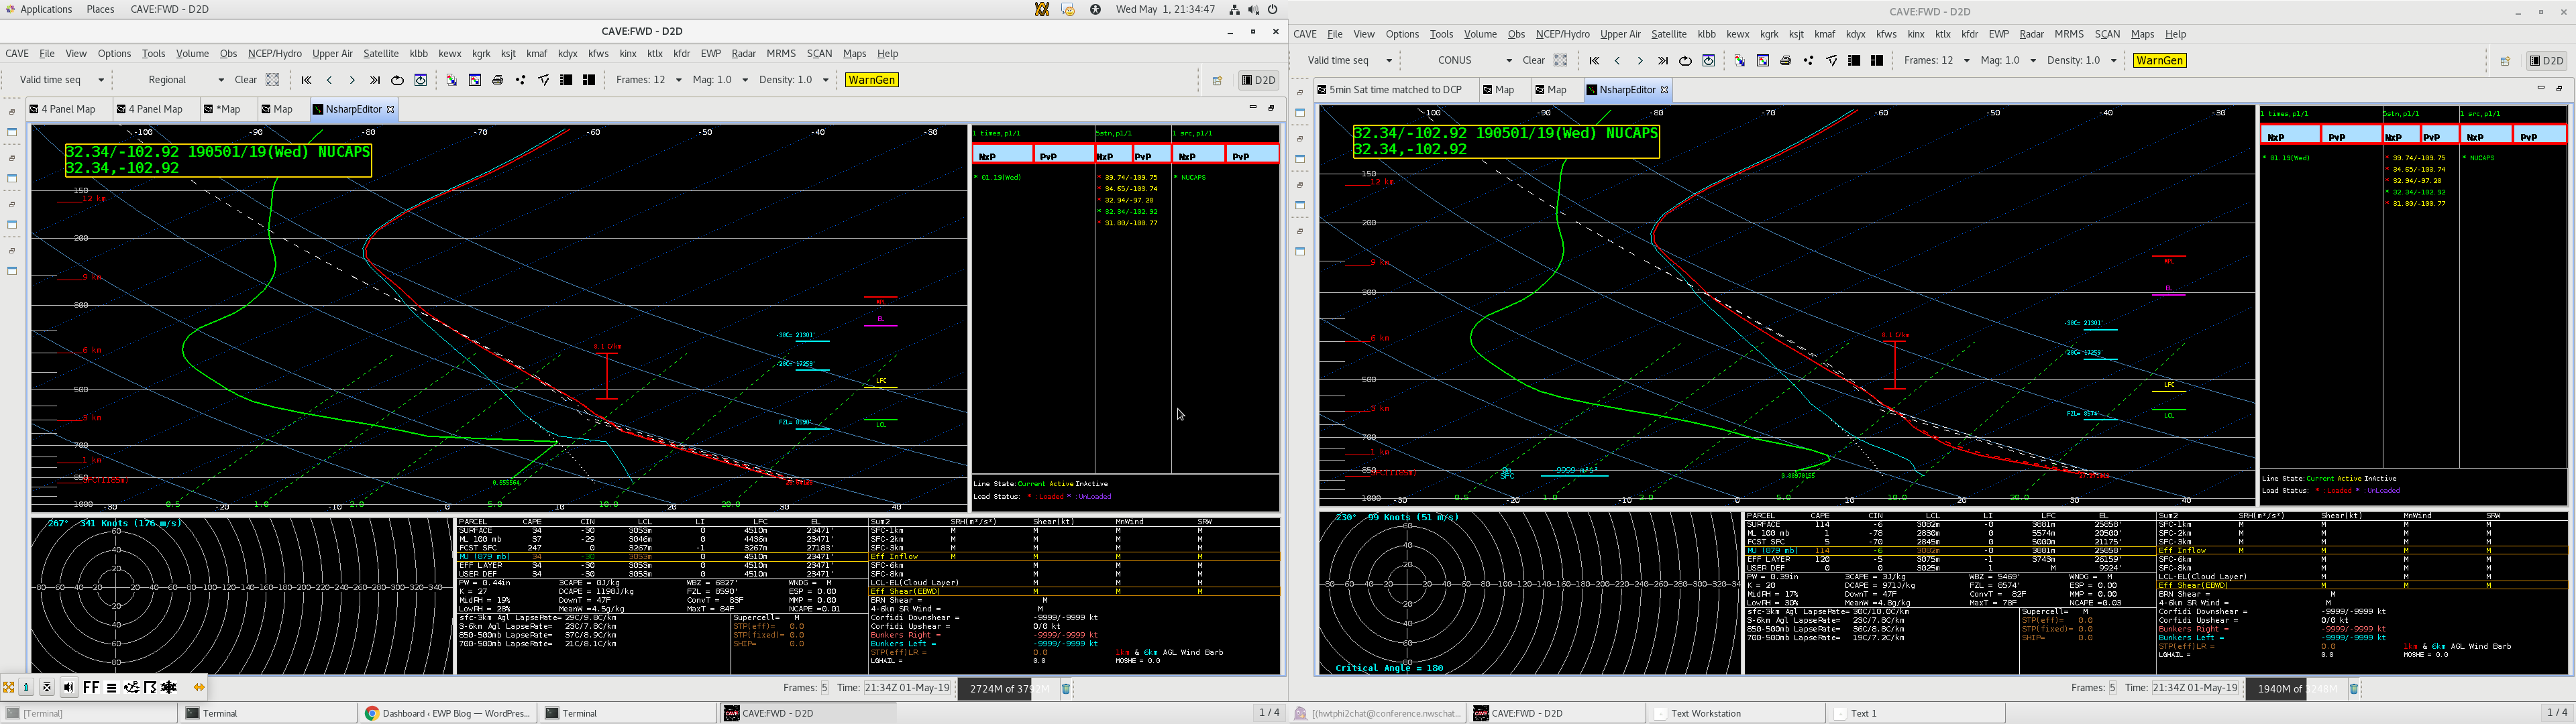
Moving south, the above example is well west of the dry line in New Mexico. Unmodified does capture a well mixed BL, but the modified shows this feature more pronounced. Clear skies were present throughout the entire day leading up to this point. 

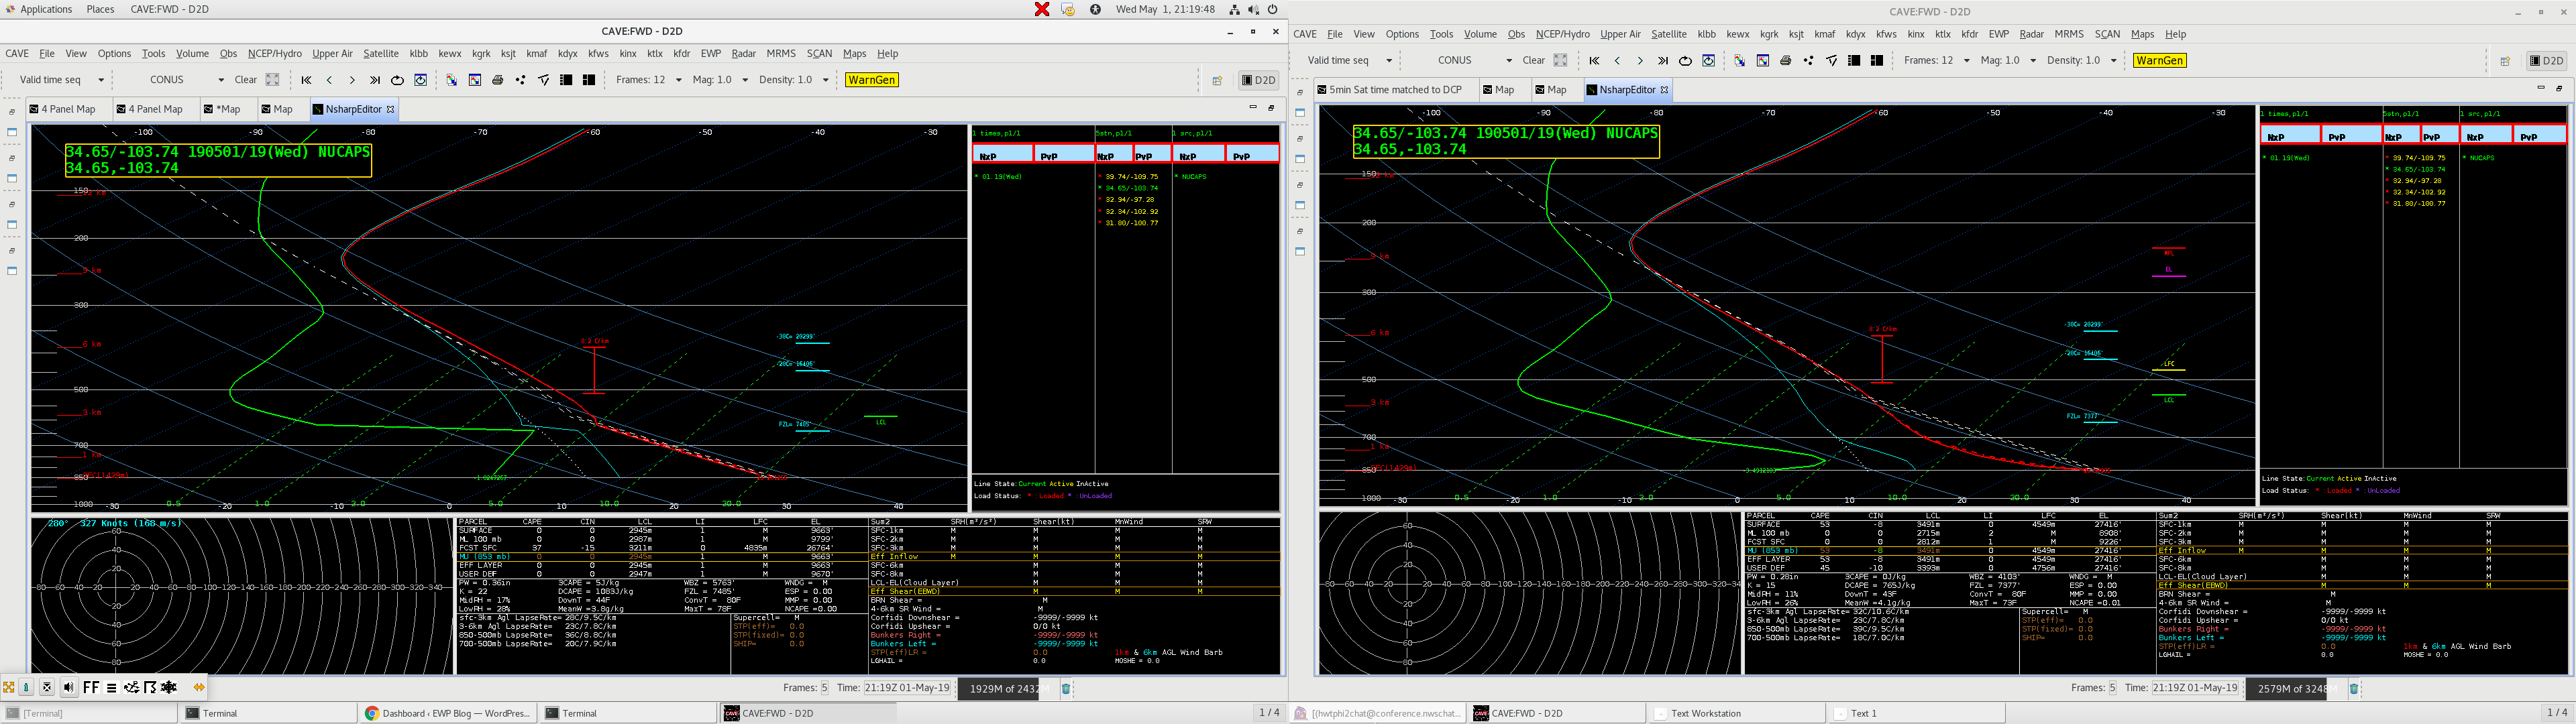
This sounding above was from just slightly west of the dryline

This sounding was a bit farther east, in the vicinity of increasing moisture east of the dry line. Finally this sounding was from well east of the dry line in the vicinity of intense thunderstorm development. Note the odd structure in the lower levels in the unmodified sounding on the left, these strange temp readings are eliminated in the modified sounding which greatly changes the CAPE values and other parameters. 


-Dusty Davis

Initial lightning detection in new storm UD

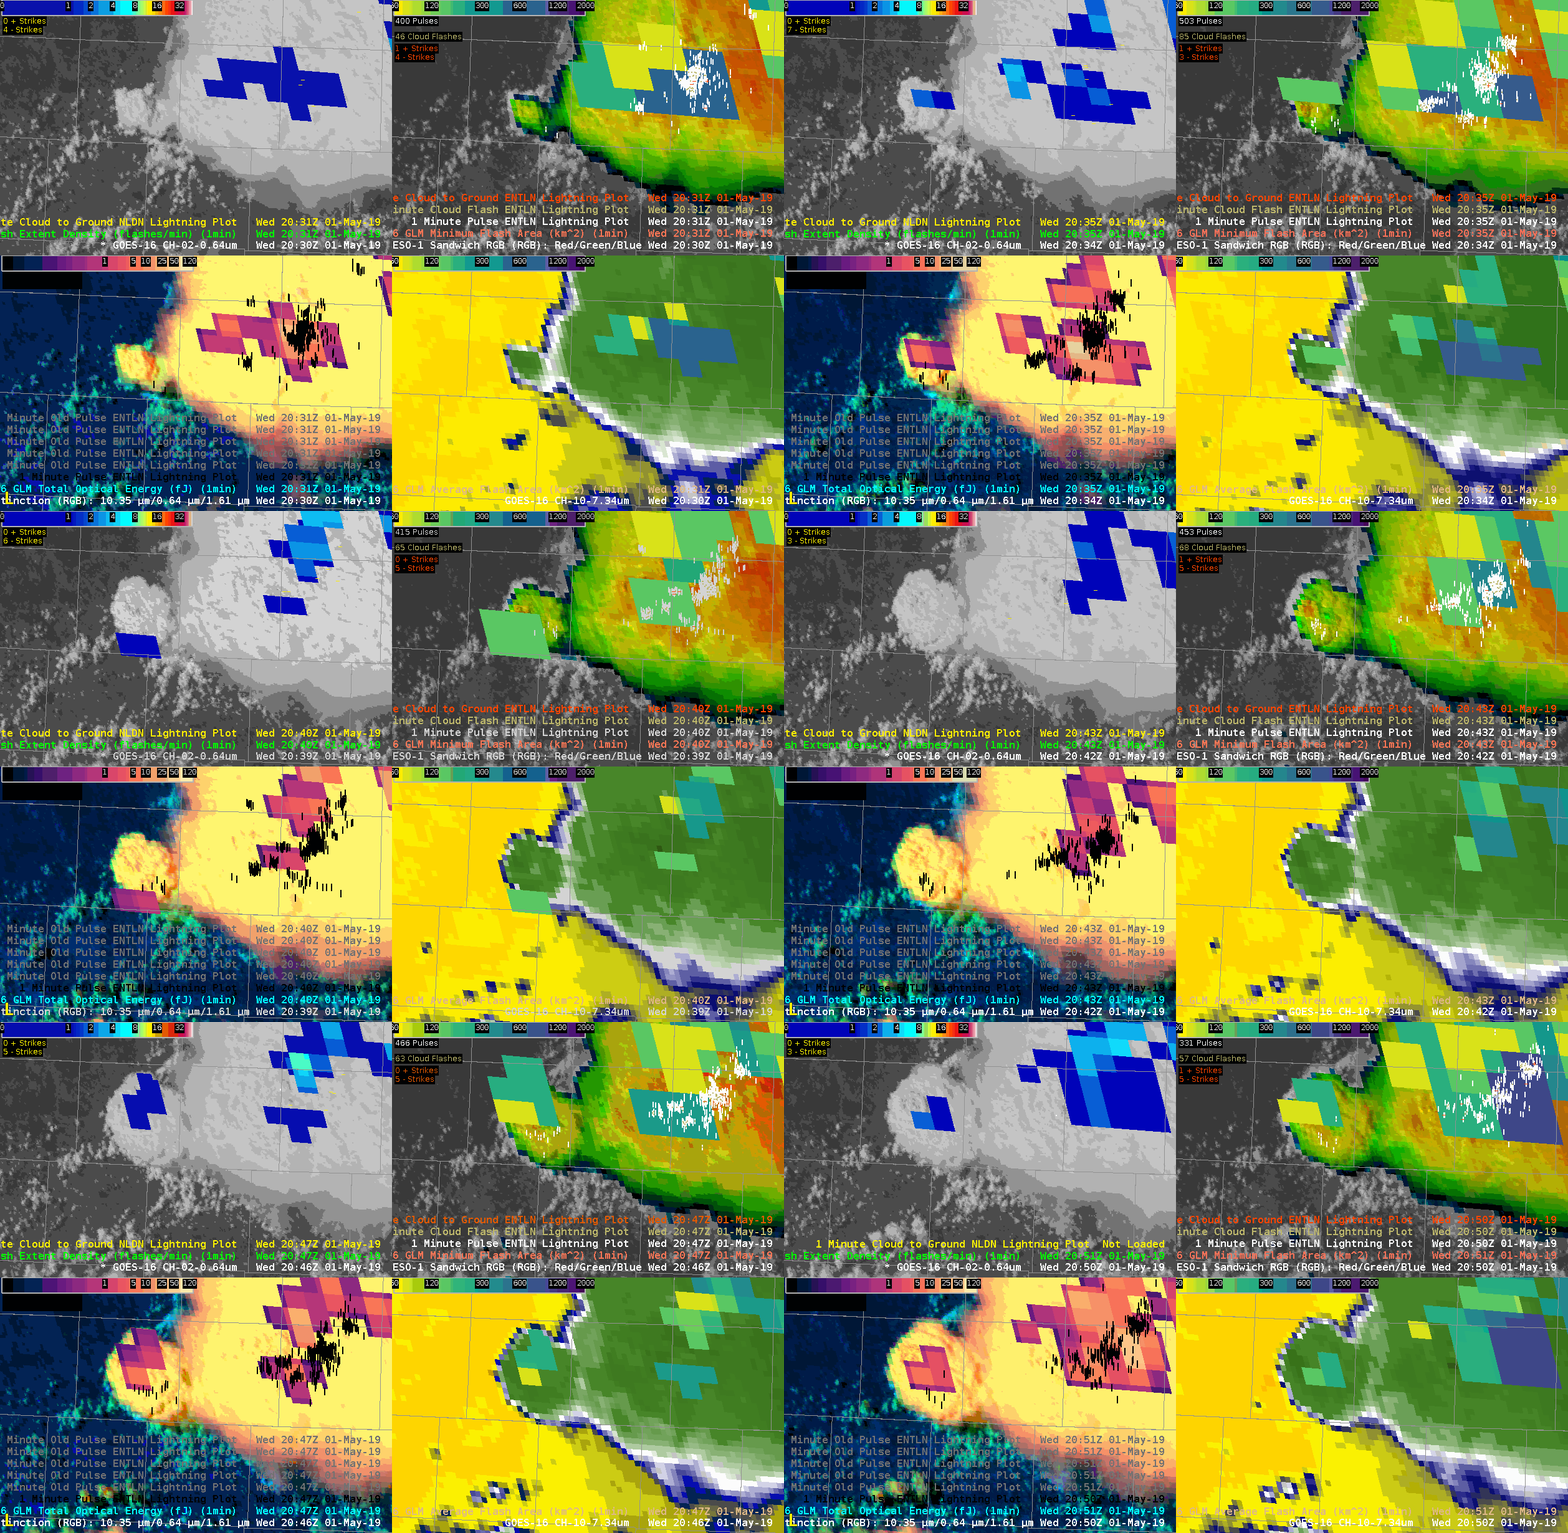
Comparison of 1 min update GLM .vs. ground-based detection for new updraft tower.

Upper-Left is FED, Upper-Right is 1 min pulse ENTLN and Minimum Flash area, Lower-Left is 1min pulse ENTLN and TOE;  and Lower-Right Average Flash area.  First detected “pulse” is evident about 5 minutes prior to first GLM detections.  Note that the initial pulses in a new updraft may not be associated with a “flash”.    Also note the parallax error in the satellite-based detection.  – Quik Twip

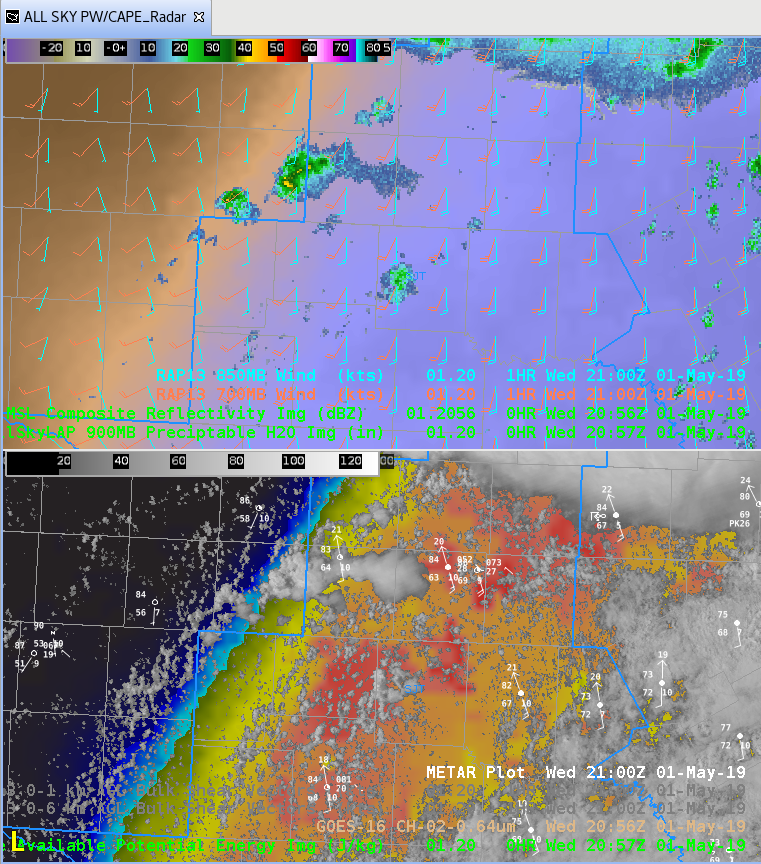
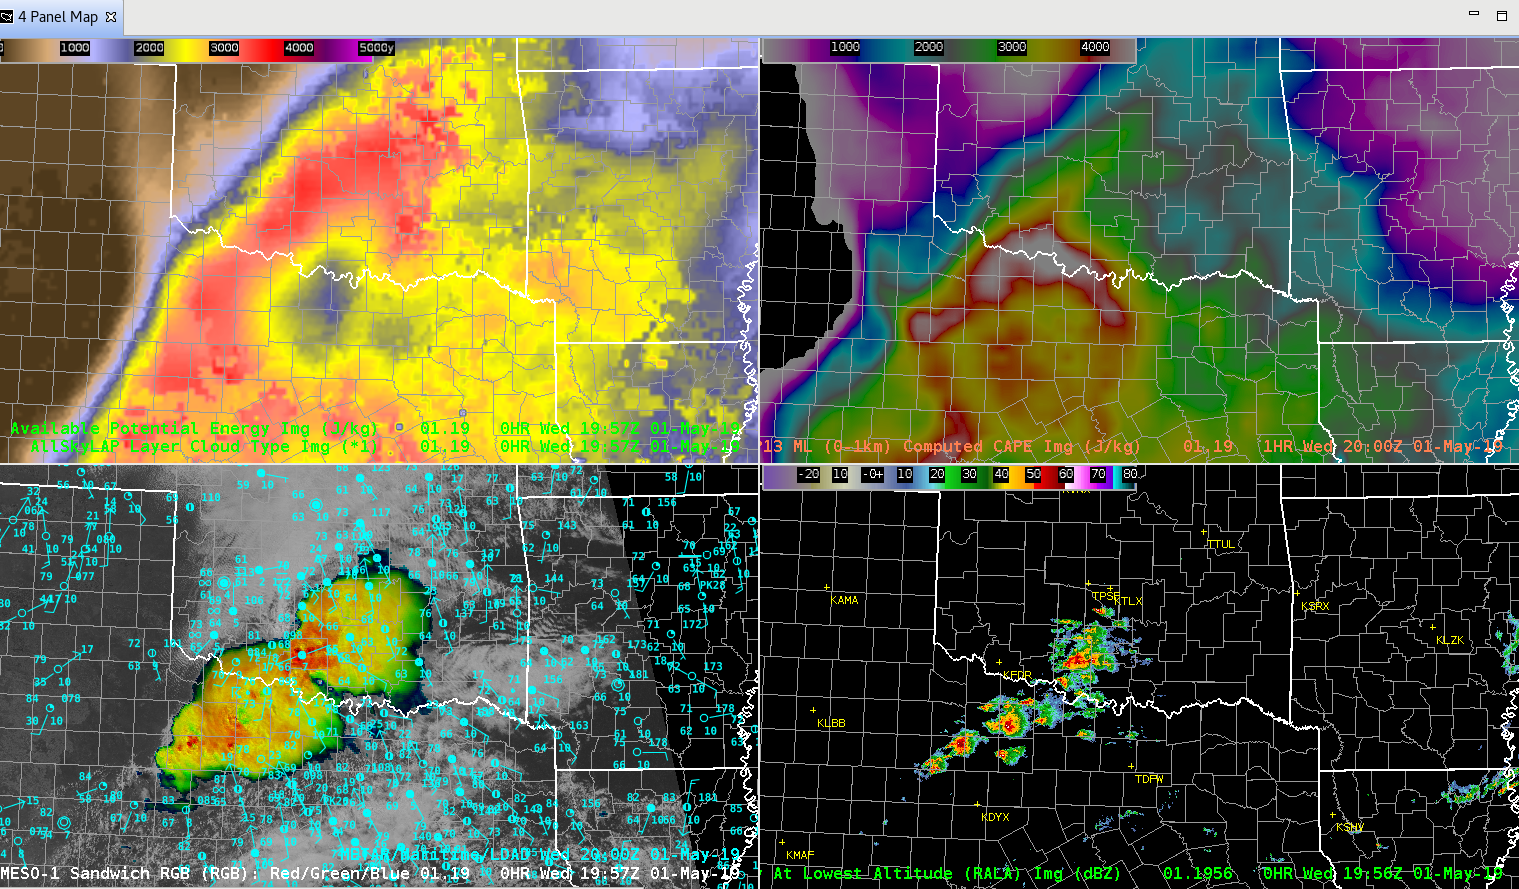
LAP all-sky CAPE hole


The LAP all-sky CAPE developed a min over north TX during the late afternoon. The RAP 0-1km MLCAPE had a similar min. Convection was struggling to develop in this region giving support to the lower derived values. CAPE was overall much higher across the warm sector and into central OK for LAP when compared to the RAP although the RAP had a ring of ~4500 J/kg CAPE around the relative min (~3300 J/kg).

NUCAPS vs. Obs

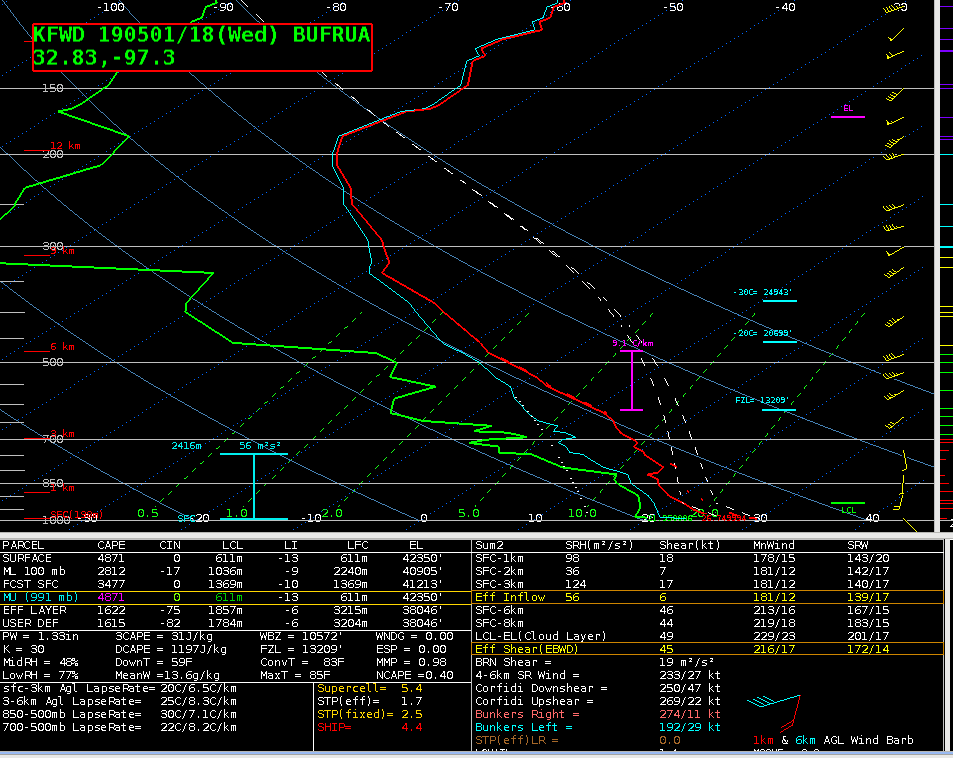
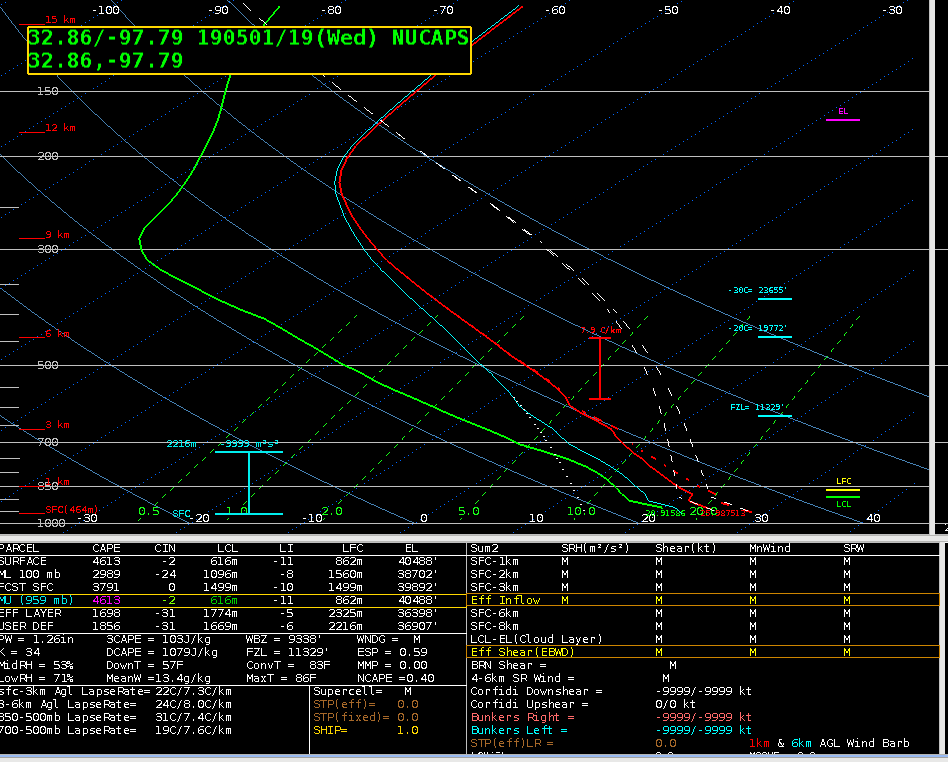
Perfect conditions to utilize NUCAPS soundings today in the FWD CWA. FWD did a special release at 18z and I was able to compare that to a 19z NUCAPS sounding immediately west of FWD, ahead of the ongoing convection north and west of the CWA. They are remarkably similar from the boundary layer upward with very similar MUCAPE/SBCAPE values around 4600-4800 J/kg.

This highlights how important these NUCAPS soundings can be in the absence of any 18-20z special balloon releases. I’m very impressed with how well it lines up with the observed 18z launch and have more confidence in using these in pre-convective environments.

–Stanley Cupp

18z FWD sounding:

19z modified-NUCAPS sounding ~25 miles west of FWD

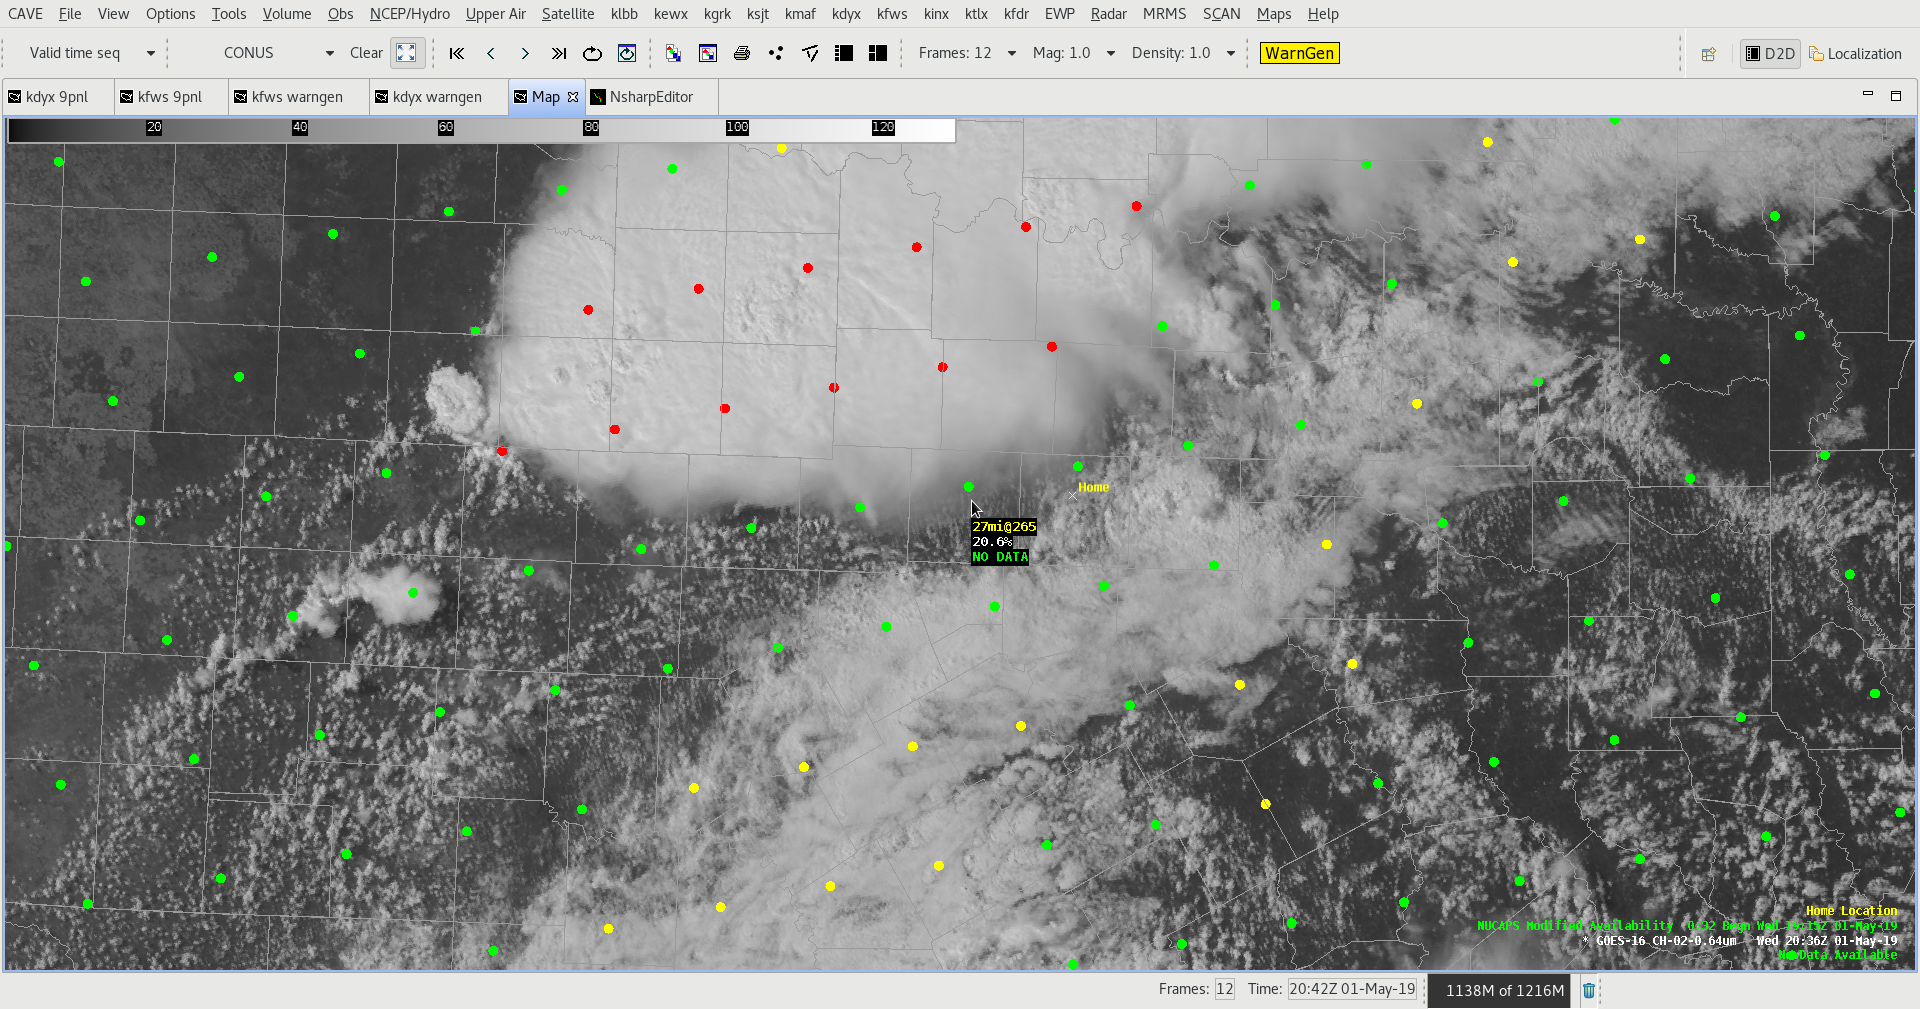
NUCAPS location (green dot above mouse cursor) vs. FWD location (yellow home cursor) and 1 minute vis imagery

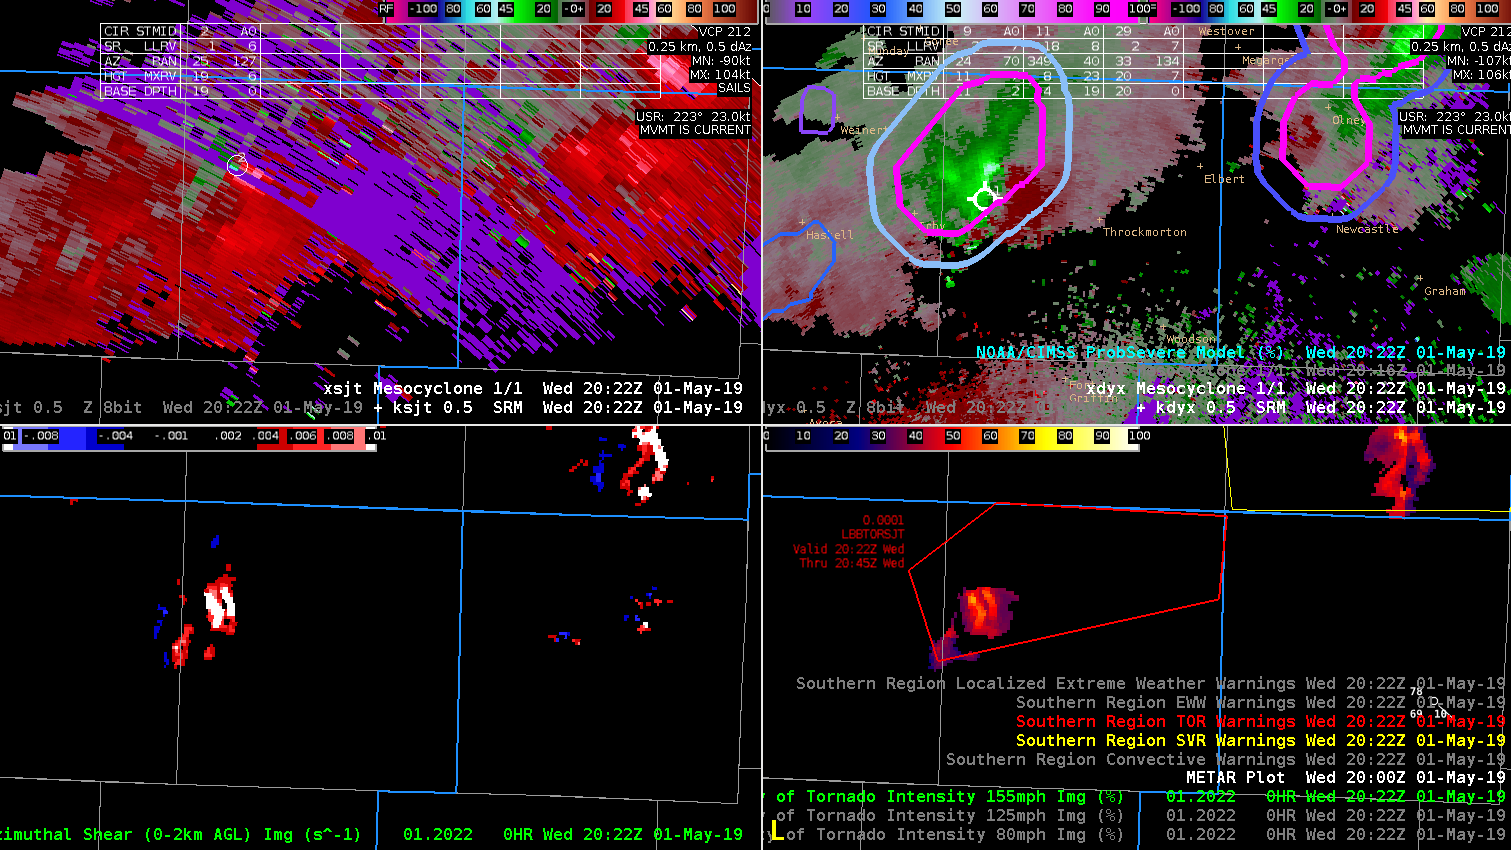
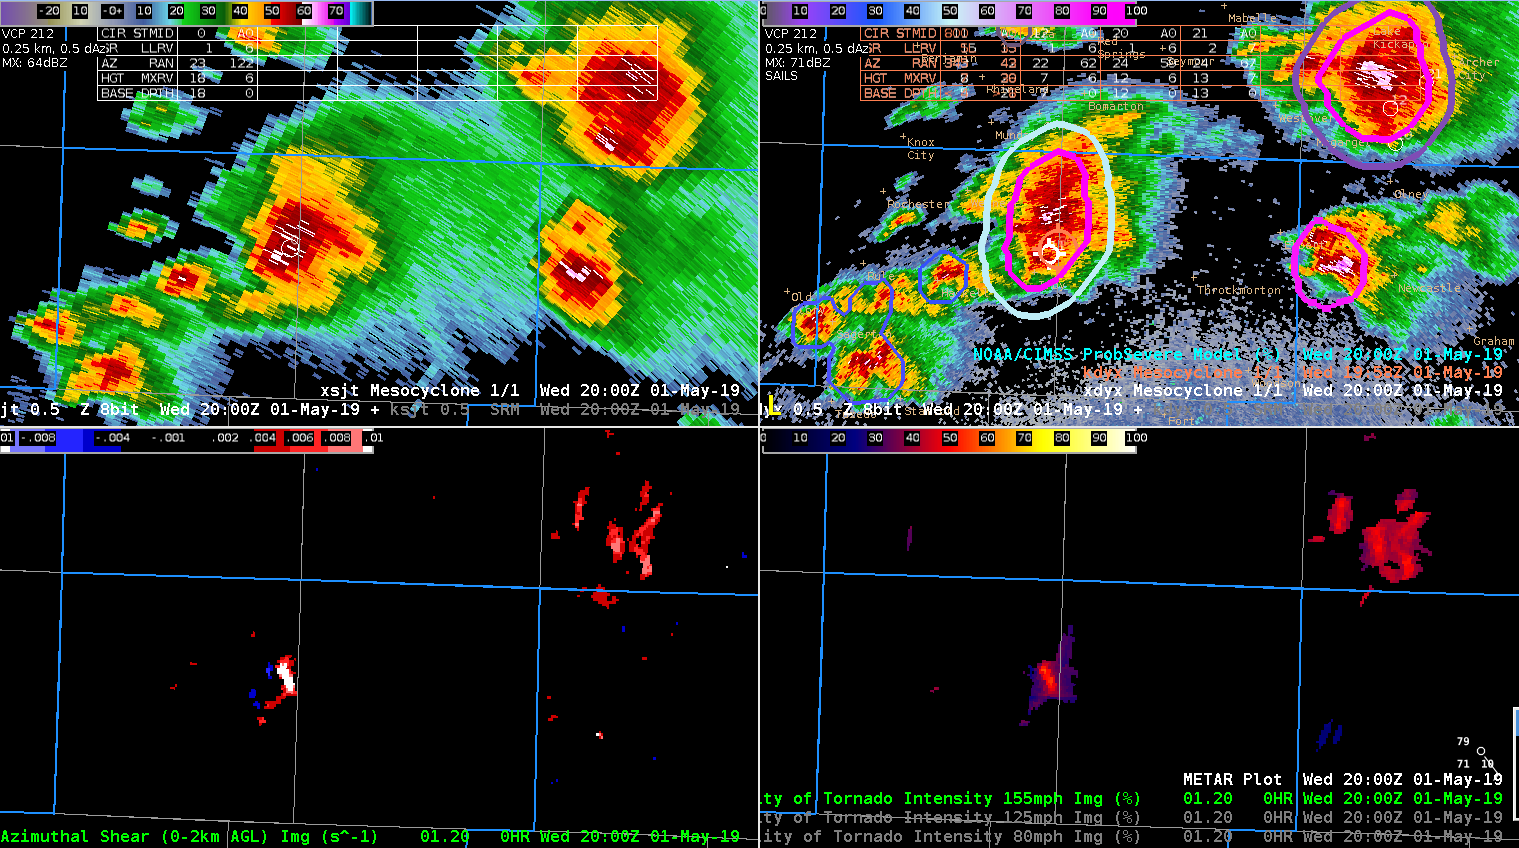
AZ_shear CPTI for possible tornadic storm


AZ_shear was showing double shear signature and also showed in the CPTI product.  Did finally see a bit of an increase on the 155mph for CPTI, however the 125mph and 80mph were similar values.  My conceptual thinking would be that 80mph would be 100%, 125mph 80%, and 155mph 60%, thus would make more sense versus all threshold values being closer to 50-60% range.  -Jake Johnson

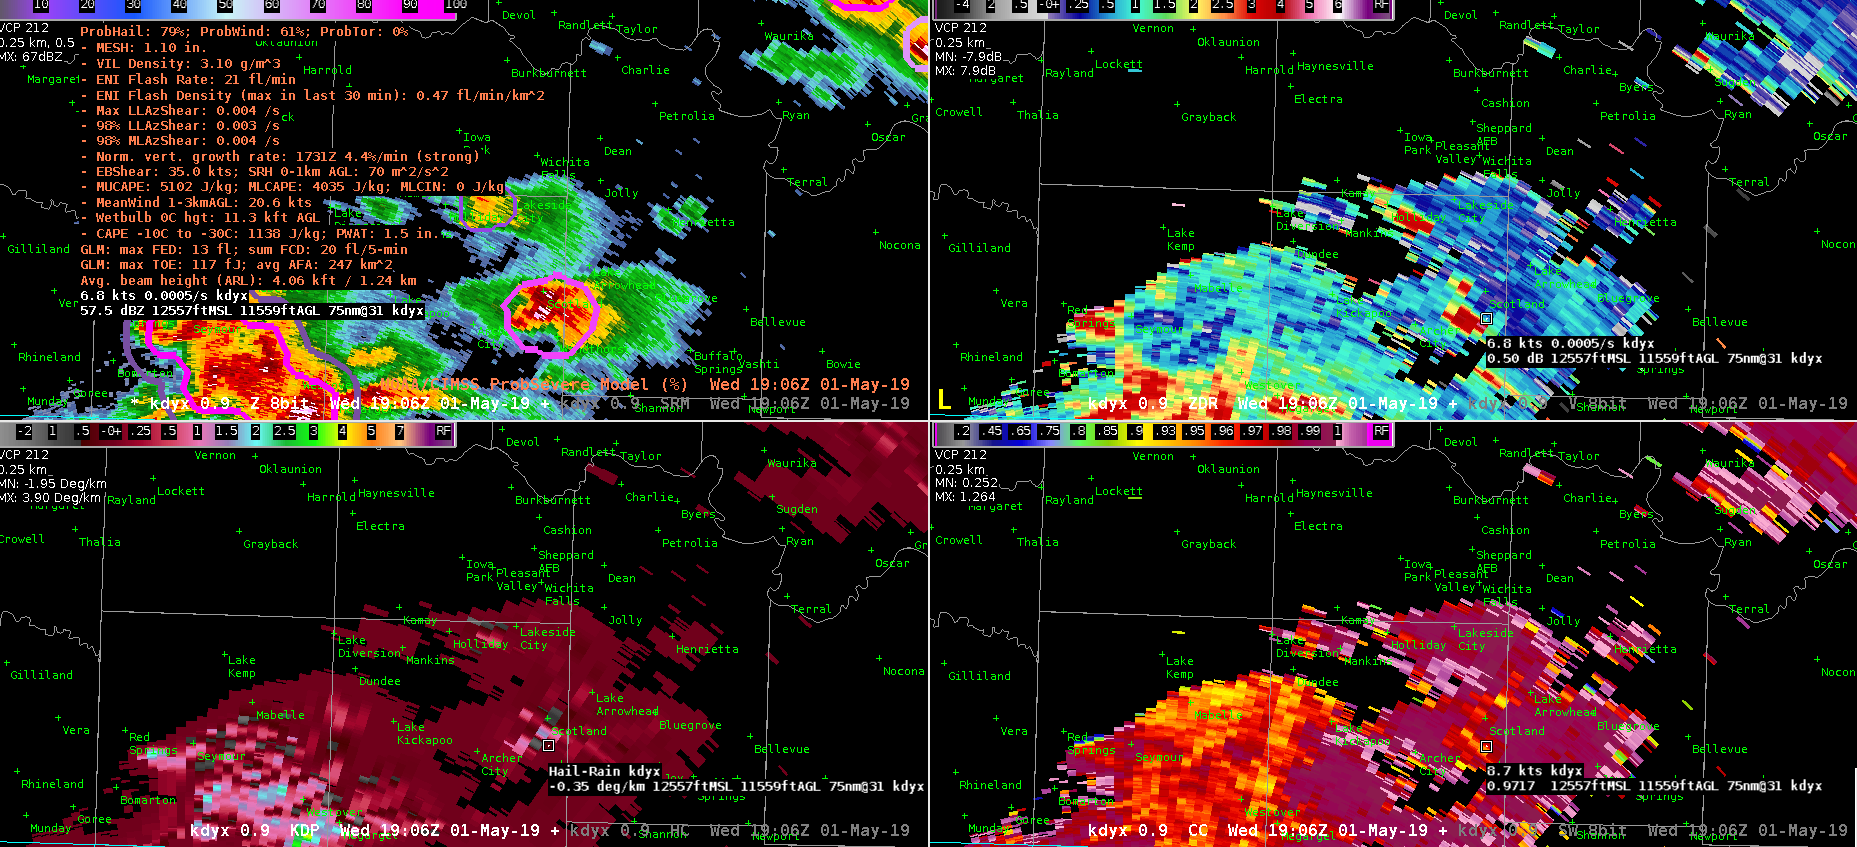
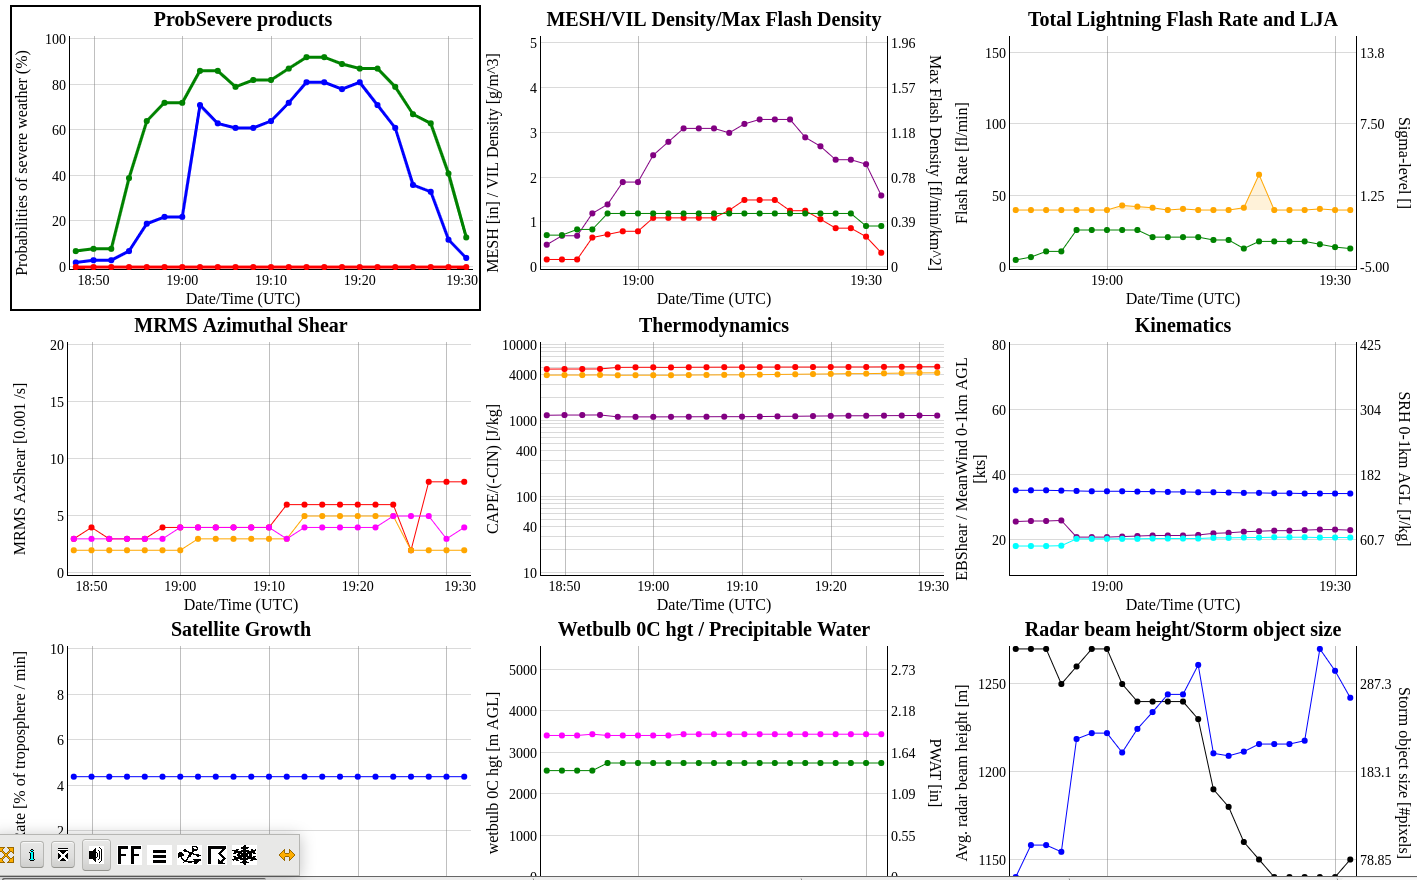
Prob Hail

With Large Hail being the biggest concern today. Focus has been primarily on that aspect. Notice how high the severe hail probability climbed very rapidly. With a report coming in just after a major jump in the probability of severe hail.

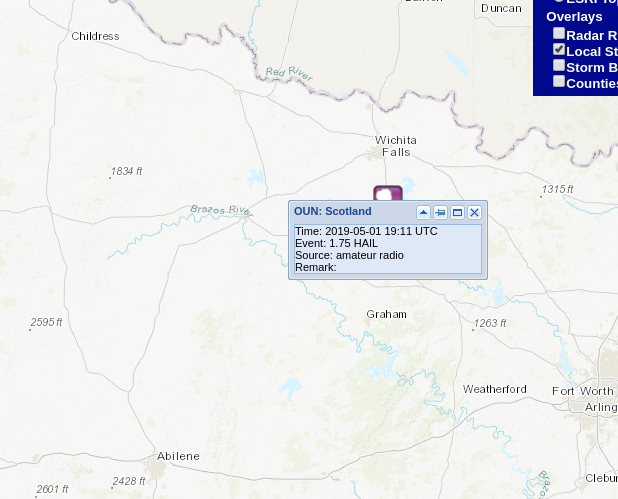
Prob Severe output over a storm which has a report of 1.75 inch hail (S of Wichita Falls TX)

Notice the report came in 10 minutes after the large jump in probability.

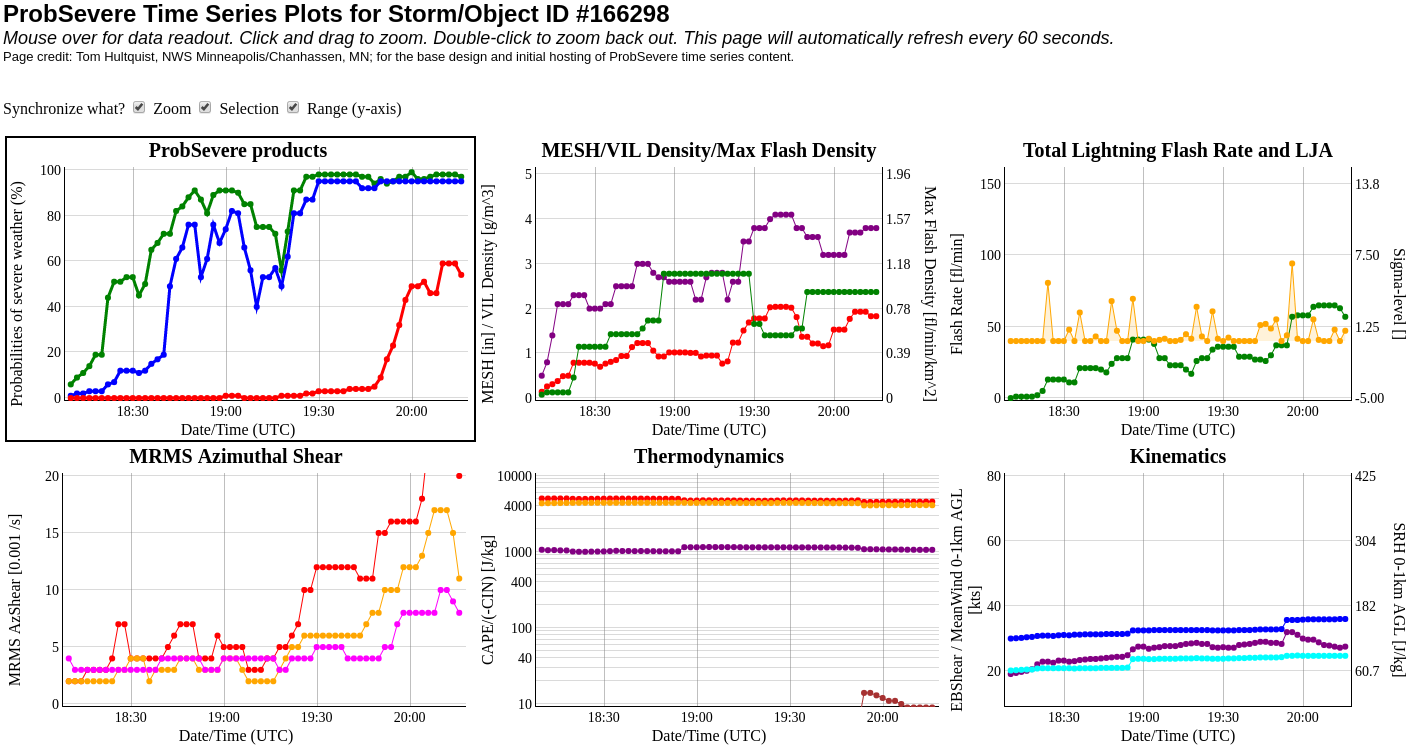
Trends

A great way to track your storm intensity trending.

Report of 1.75 inch hail

South Beach

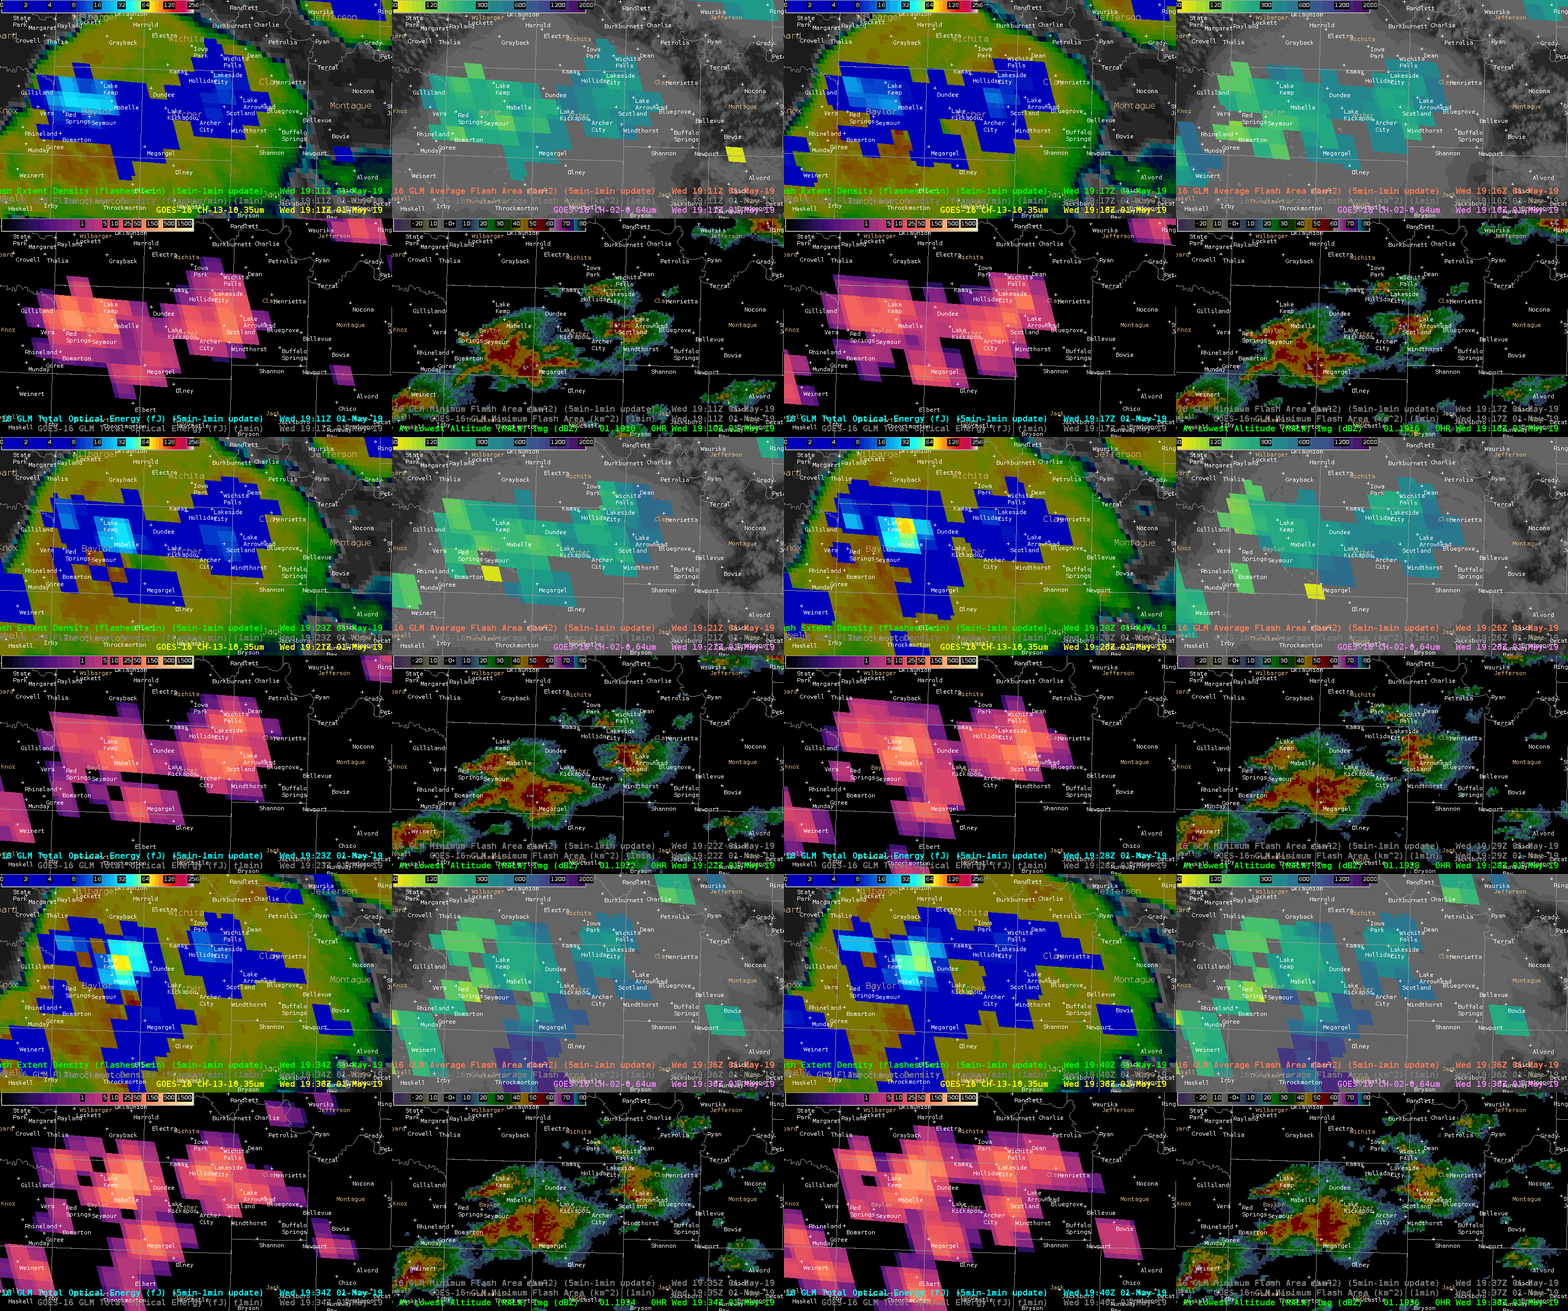
Baylor Co TX Split

The storm split over Baylor county was seen in GLM. Higher flash rates remained with the right mover. The average flash area remained small through the transition but eventually some larger flashes were observed in the right mover.

There was also a significant lightning increase with the right mover, from 20 fl/5-min to over 80 fl/5-min in 10 minute period.

— SCoulomb