


NMDA shows several false meso’s which can be a little too sensitive at times for the weaker meso’s. -Jake Johnson
Official websites use .gov
A
.gov website belongs to an official government
organization in the United States.
Secure .gov websites use HTTPS
A
lock (
) or https:// means you’ve safely connected to
the .gov website. Share sensitive information only on official,
secure websites.

NMDA shows several false meso’s which can be a little too sensitive at times for the weaker meso’s. -Jake Johnson
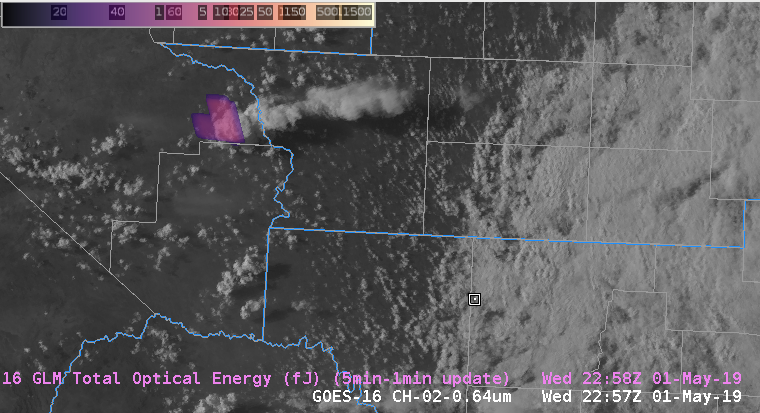
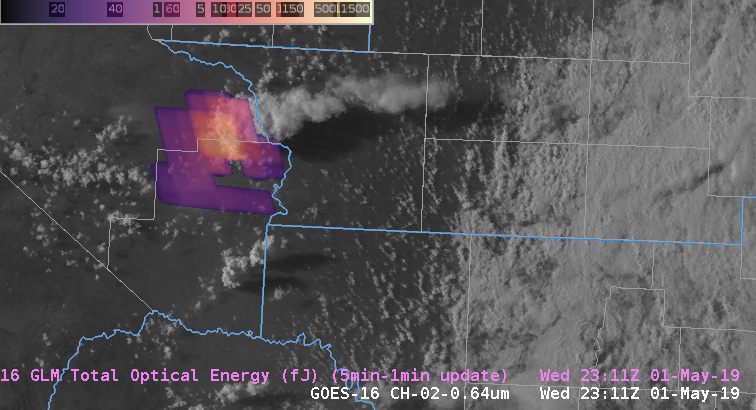
GLM Total Optical Energy product shows rapid increase of lightning in a 14 minute span for a developing thunderstorm in southwest Texas. This is useful information to forecasters for diagnosing storm intensification which usually precedes a response on radar. -Jake Johnson
As many have already mentioned, the new All-Sky LAP layered PW and CAPE products are very useful tools for mesoanalysis and quick identification of key meteorological gradients (I bet my grandmother could ID the dryline below…). Earlier today, these products seemed to pick up on the outflow boundary that stretched from SE AR into southern OK/northern TX. It was extremely subtle and slightly offset from the actual boundary, but if you looked just right you could see it (tried to get a good animation, but the contrast is lost so you’ll have to take my word for it…). The color table provided for these products, specifically the PW products, make identifying key/obvious boundaries easy, but the more subtle things are easily missed. I would caution anyone from using them for anything other than IDing the main players, unless the color table could be tweaked to enhance those low-to-mid range values (~0.4 to 0.8). I’m not sure it’s worth exploring given these products are 6km resolution, I was just surprised to see the subtle reflection of the outflow boundary. Perhaps I’ll play around with the color tables now…
–Stanley Cupp
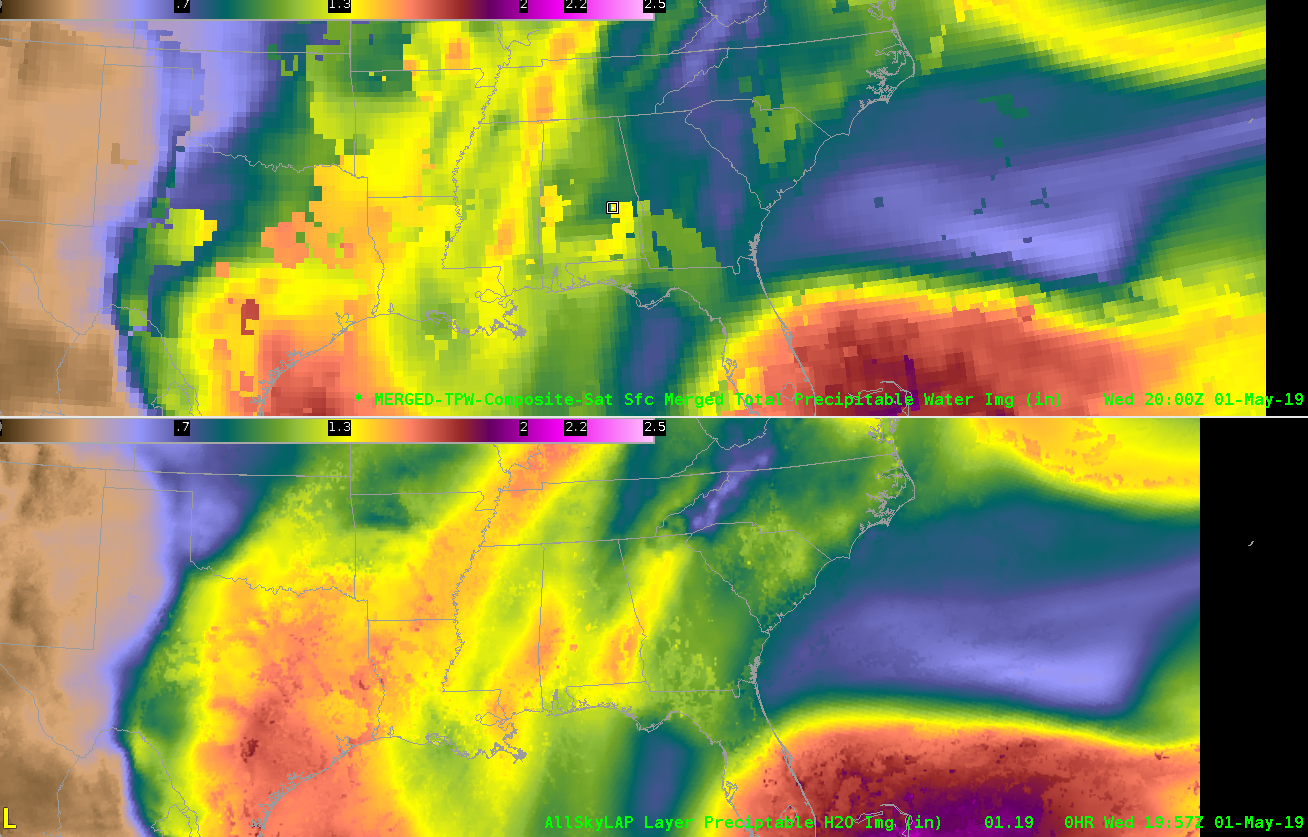
The AllSkyLAP Precipitable Water Product continues to be my favorite of the two options. There are too many unrealistic gradients that form within the composite merge. In this case notice how Texas seems to be especially prone to the errors where numerous sharp & and unrealistic gradients exist east of the dryline.
South Beach
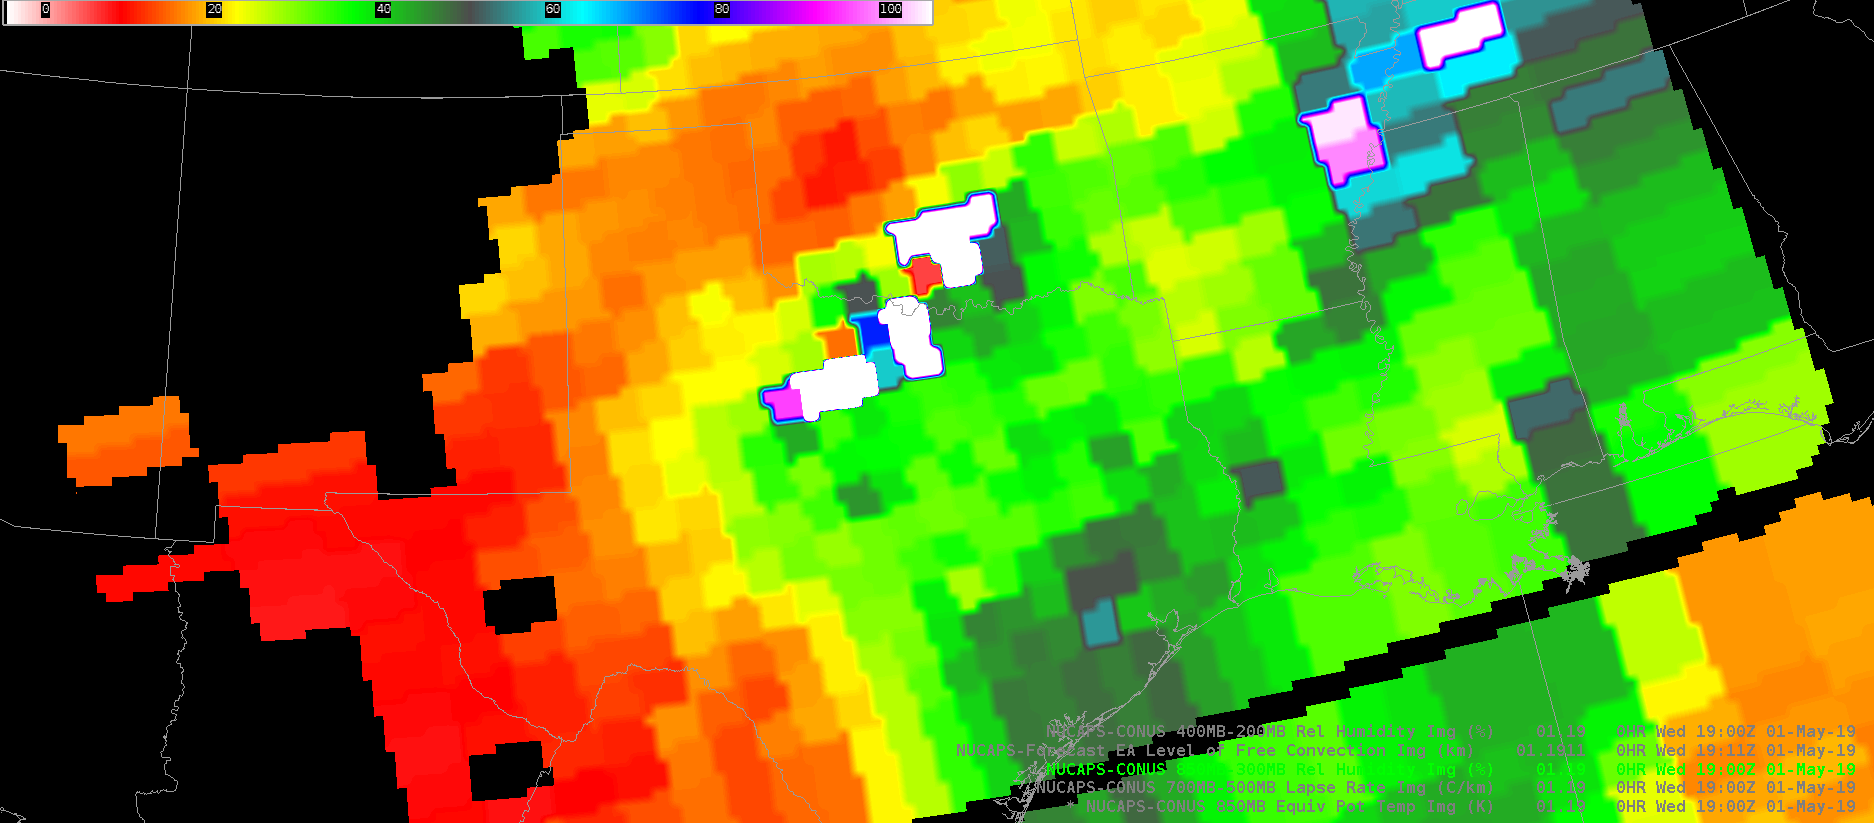
An example of NUCAPS gridded data over Texas. Convection was already underway at this time, as seen by the very high pixels in south OK and north TX. This field is 850-300mb RH. The dryline is evident, however the usefulness of this and other NUCAPS gridded data is questionable for operations because of the poor resolution. With so many other much higher resolution surface and gridded data sources available, I doubt I would be using these products much at all in operations.
-Dusty Davis
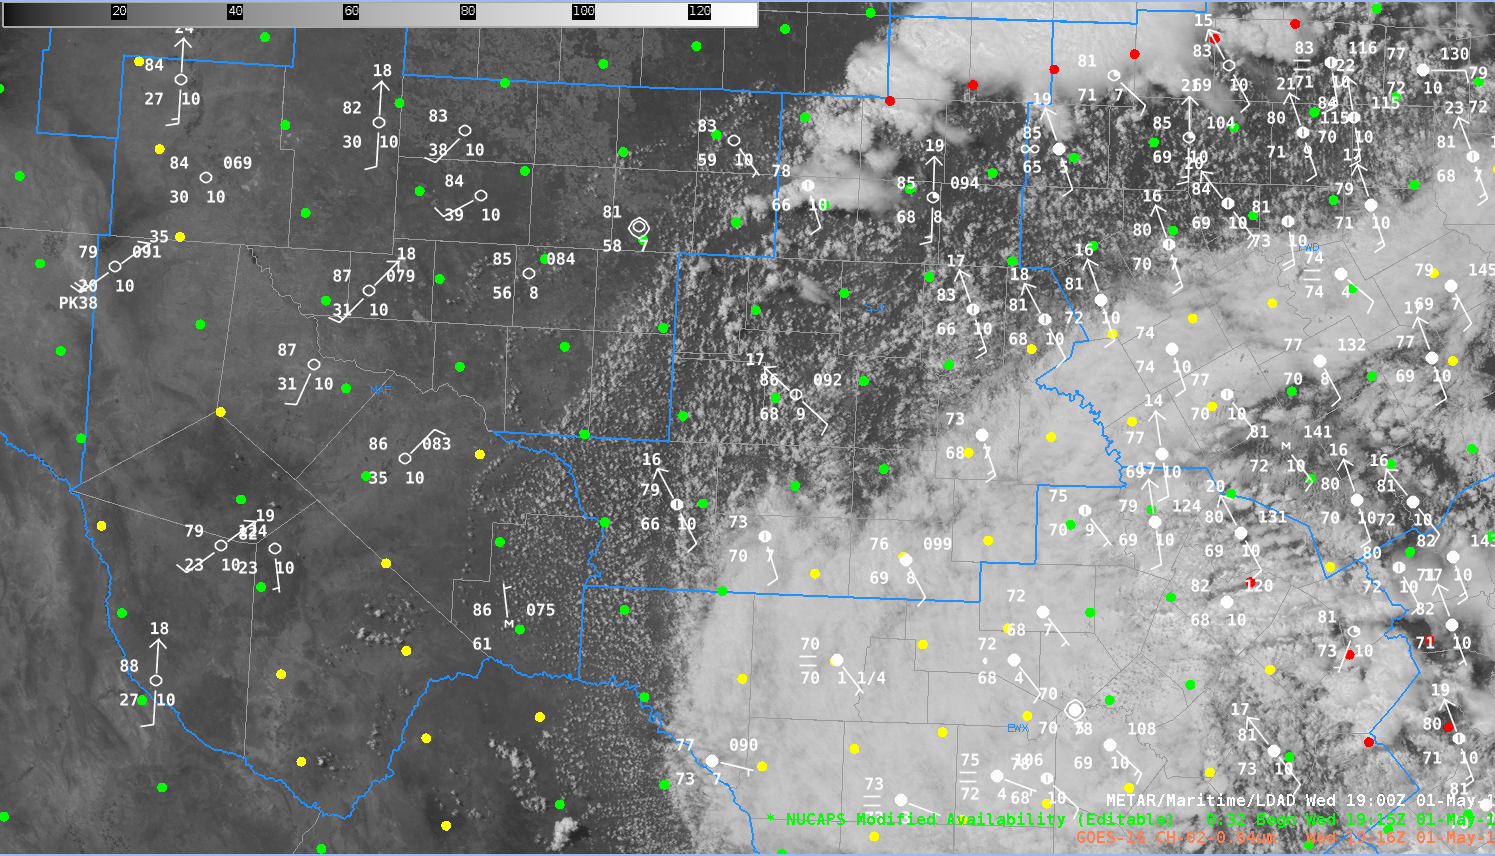
Figure A (NUCAPS Modified sounding points 1915Z
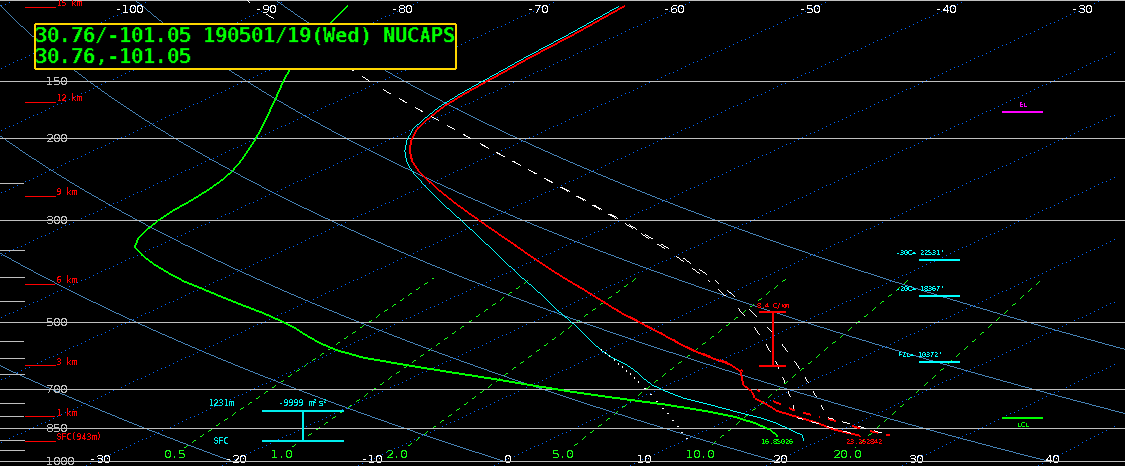
Figure B (NUCAPS Modified sounding point near KOZA, in the moist sector)
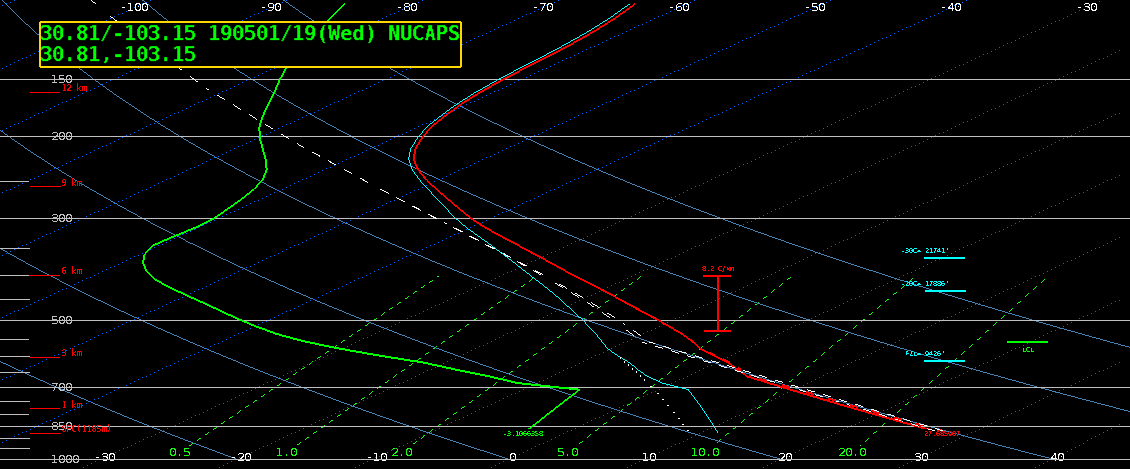
Figure C (NUCAPS Modified sounding point near KFST, behind the dry-line)
This is a comparison of NUCAPS modified sounding for locations west/east of the dry line.
Figure C NUCAPS Modified Temp/Dew….82/27 KFST Metar Temp/Dew….86/35
Figure B NUCAPS Modified Temp/Dew…75/62 KOZA Meter Temp/Dew…79/66
-Jake Johnson
Investigating the MDA algorithms, it continues to seem as though the NMDA (shown in light blue) continues to do a better job at identifying mesocyclones compared with the “normal” algorithm. Its performance may be comparable with the DMD (yellow).

South Beach
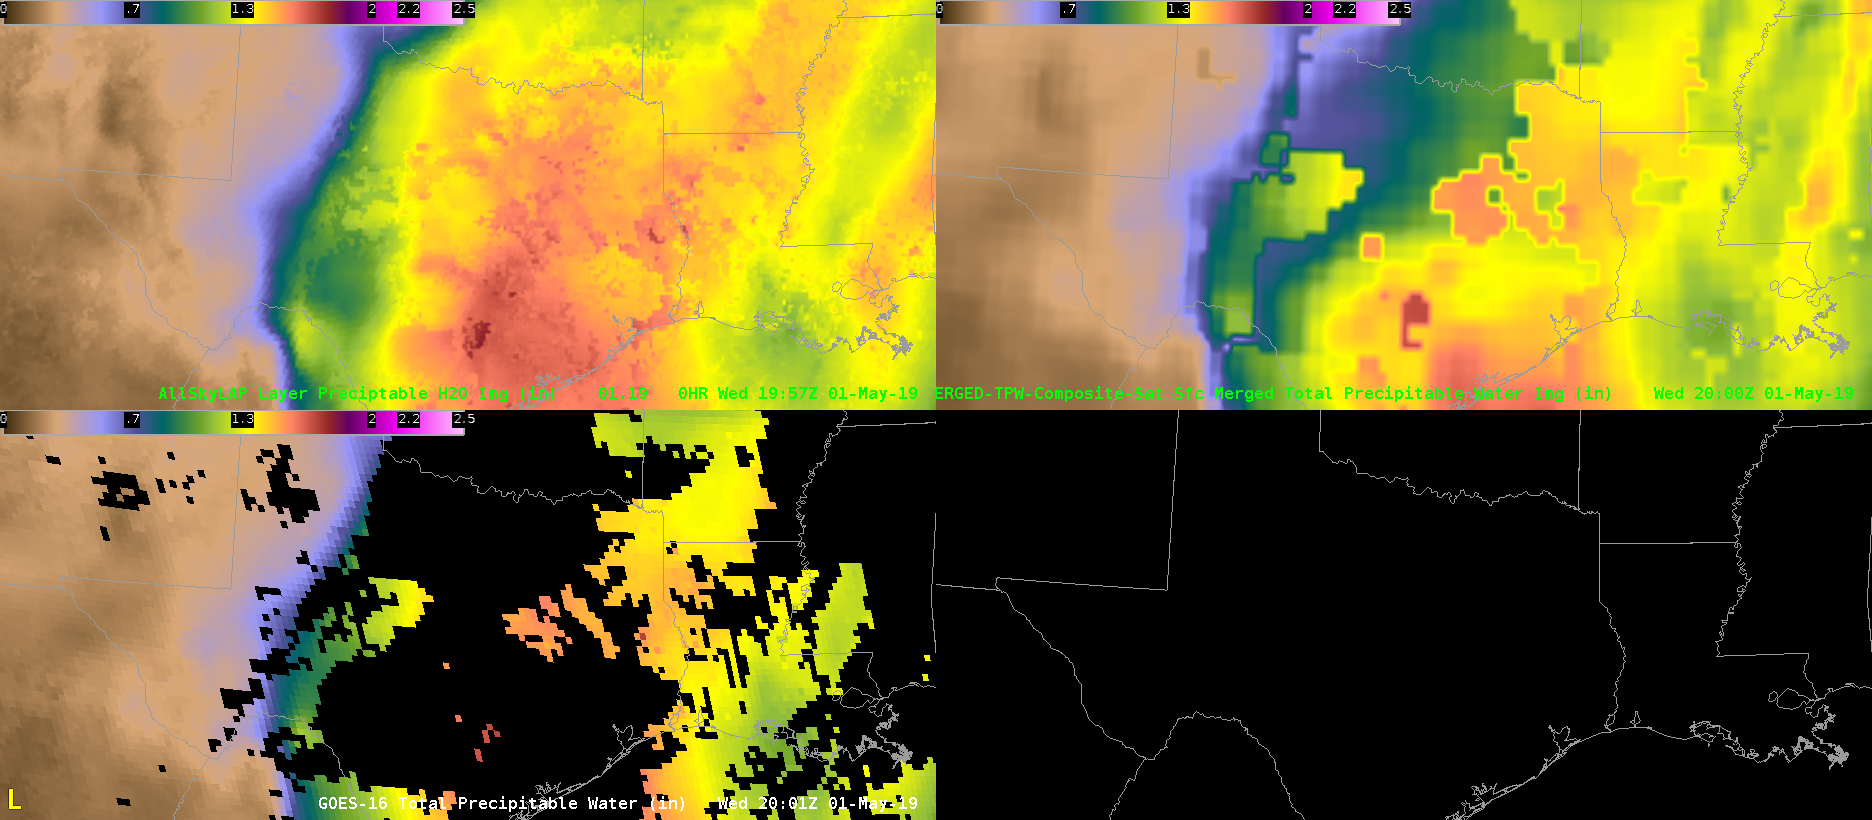
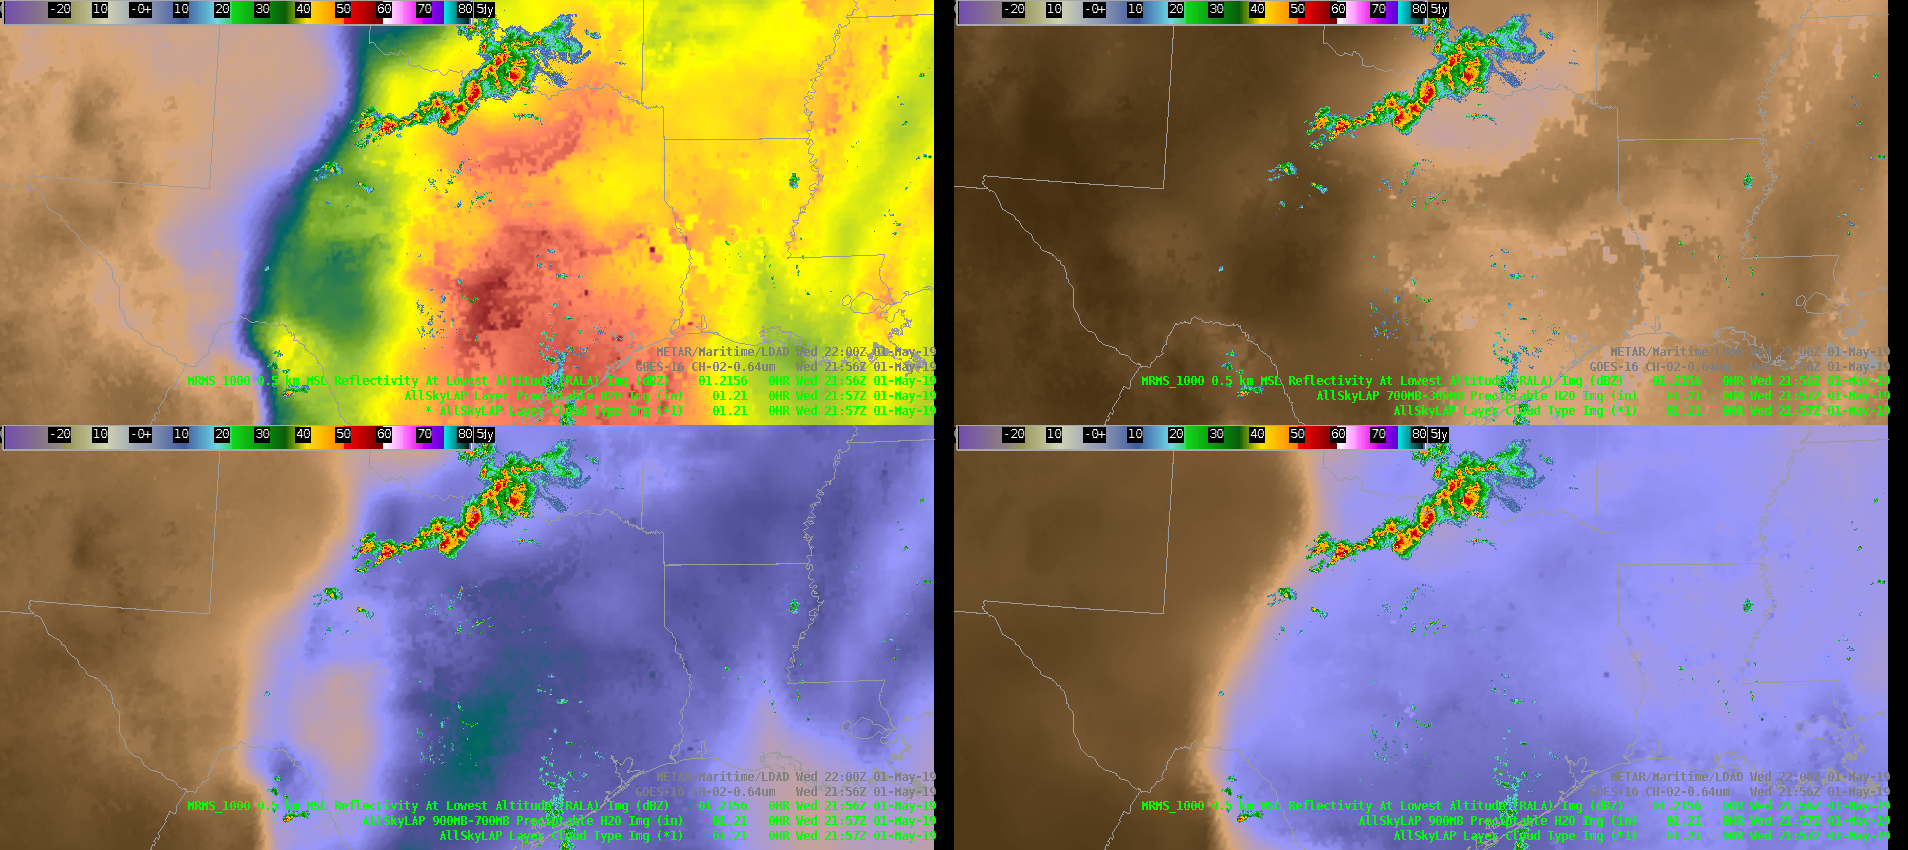
PWAT comparison. Allsky LAP is on the top left, Merged TWP is on the top right, and data from GOES that we see in AWIPS in our offices on the bottom left. The blotchyness of the merged product renders it mostly useless for operational purposes. Additionally, the Allsky LAP depicts a much more realistic PWAT spread in north central Texas where convection is ongoing.
-Dusty Davis
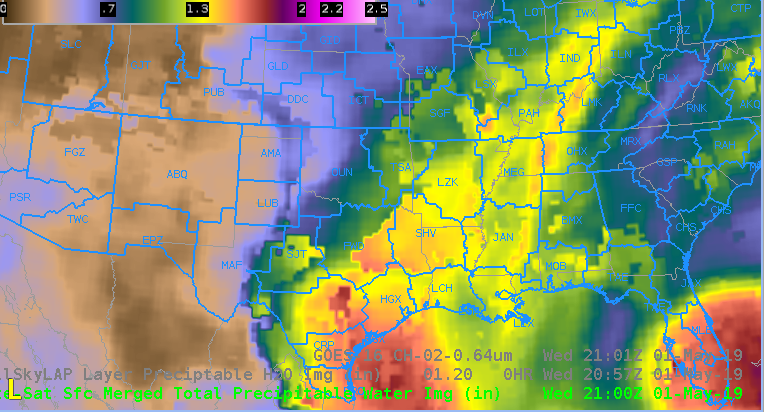
Figure A (CIRA Merged PW)
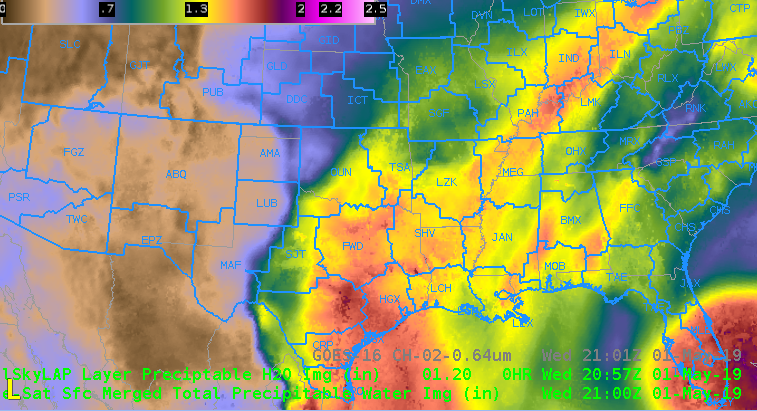
Figure B (All Sky Total PW)
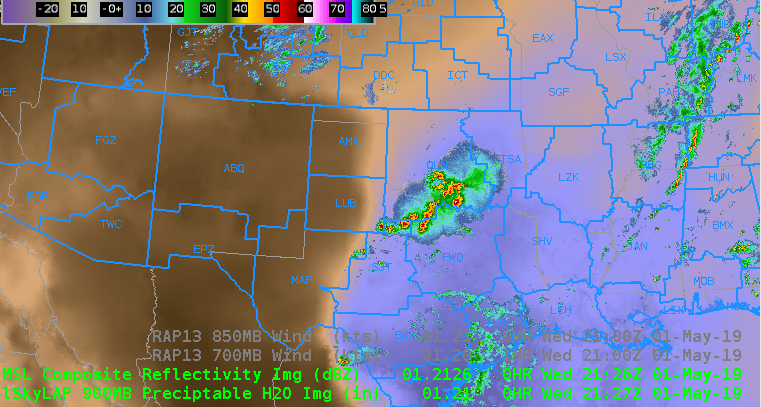
Figure C (All Sky Sfc-900mb PW)
Notice the big difference in Figure A compared to Figure B from DFW to OUN coverage area, Figure B with All Sky Total PW was handling the plume of moisture streaming northward much better. This also correlates well to area of deep convection in Figure C in the deeper moisture region. -Jake Johnson
ProbTor showed a noticeable increase in values as the circulation on the Love County storm improved from 21:24-21:28 however there was a significant drop off at 21:34 even though the circulation from KFDR maintained its intensity and actually improved gate-to-gate. Looking at the MRMS AzShear graph you can see the same trends pinpointing the main driver in the ProbTor behavior. By 21:44 the AzShear recovered and ProbTor also returned to its previous value and continued to climb. There was some apparent “funky data” that got into AzShear to cause the unexpected drop. This emphasizes the need to have the proper products paired in AWIPS displays in order to diagnose why some algorithms may “fail” at times.
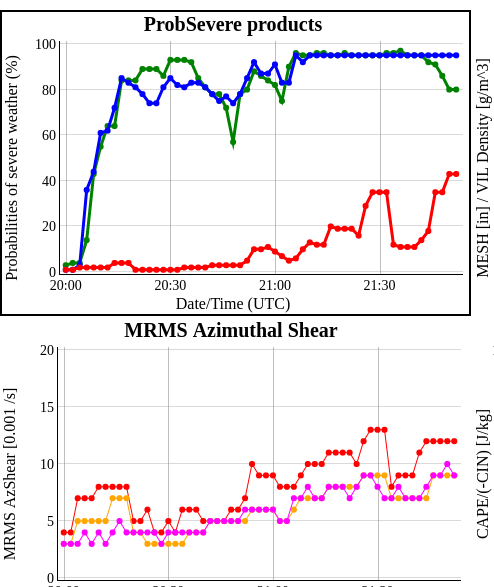
ProbSevere Time series. (http://cimss.ssec.wisc.edu/severe_conv/plots/PSplots.php?ID=166605)
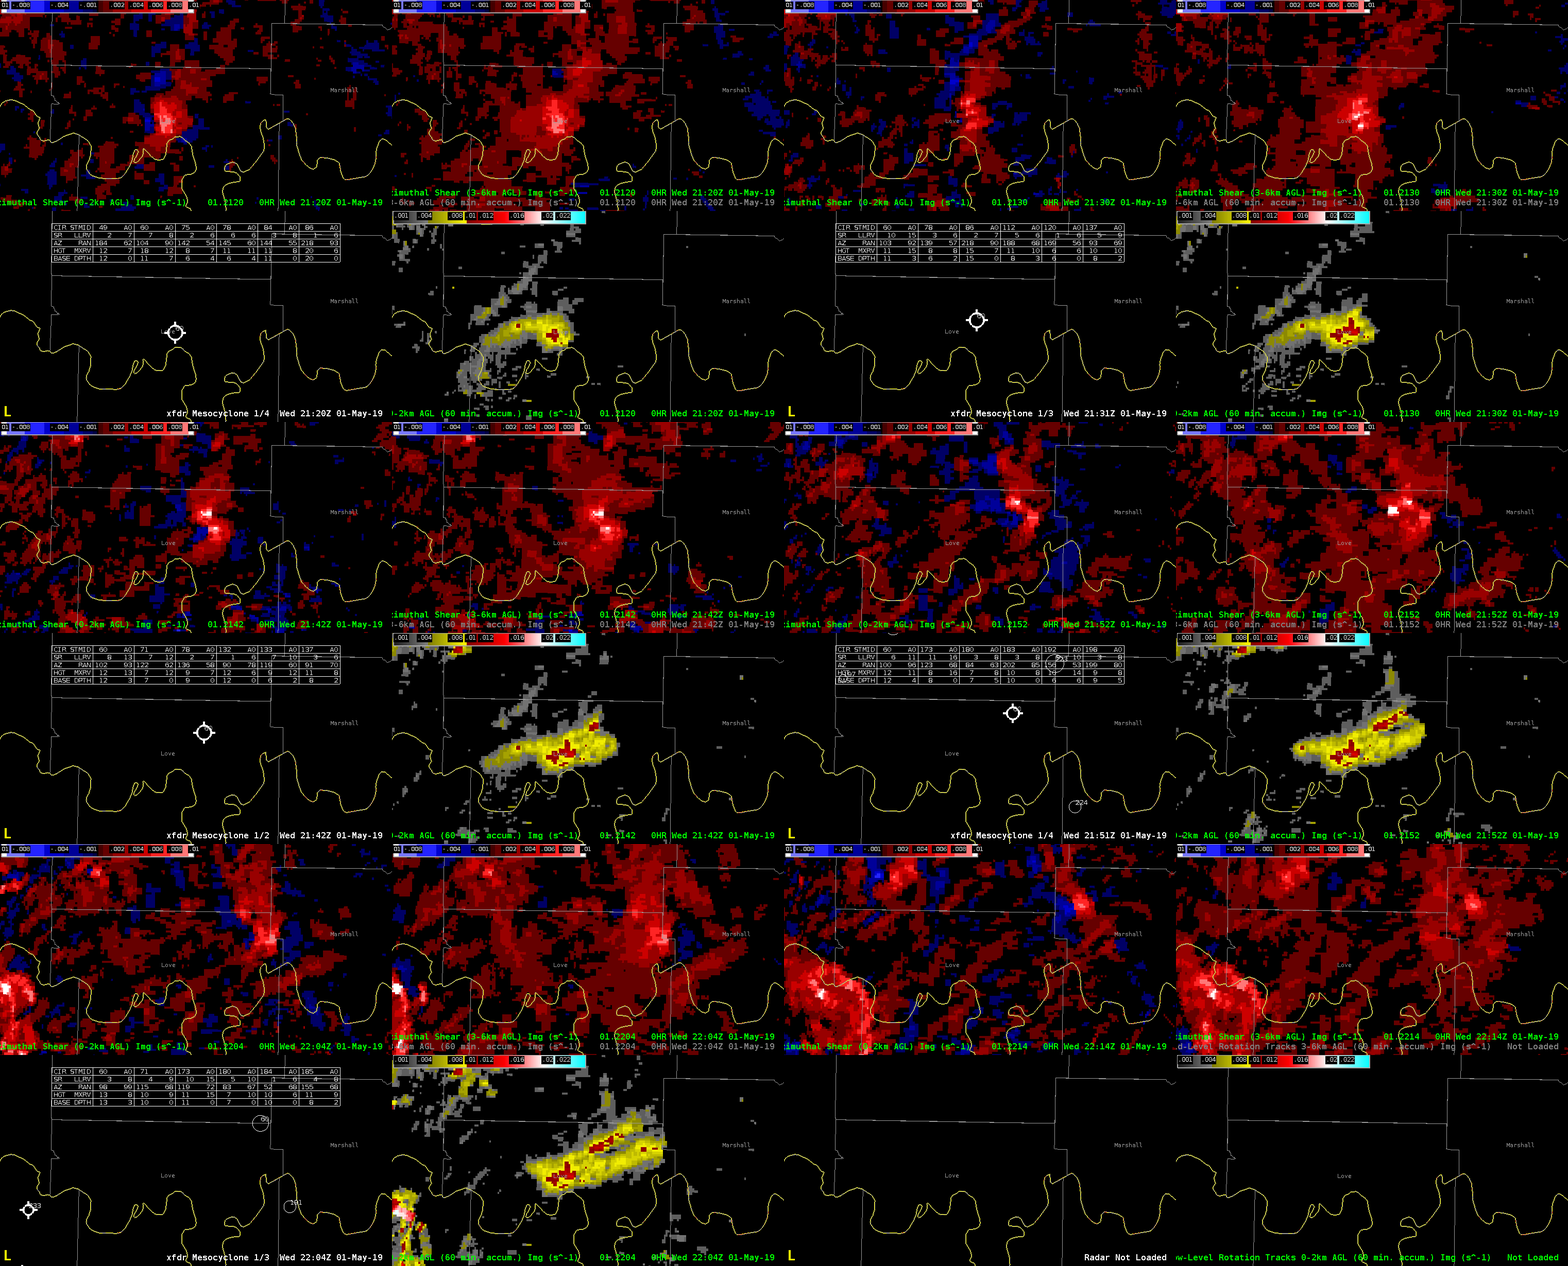
Low Level AzShear (UL), Mid Level AzShear (UR), New Mesocyclone Detection Algorithm (KFDR) (LL), Low Level Rotation Tracks (LR) 21:20-22:14
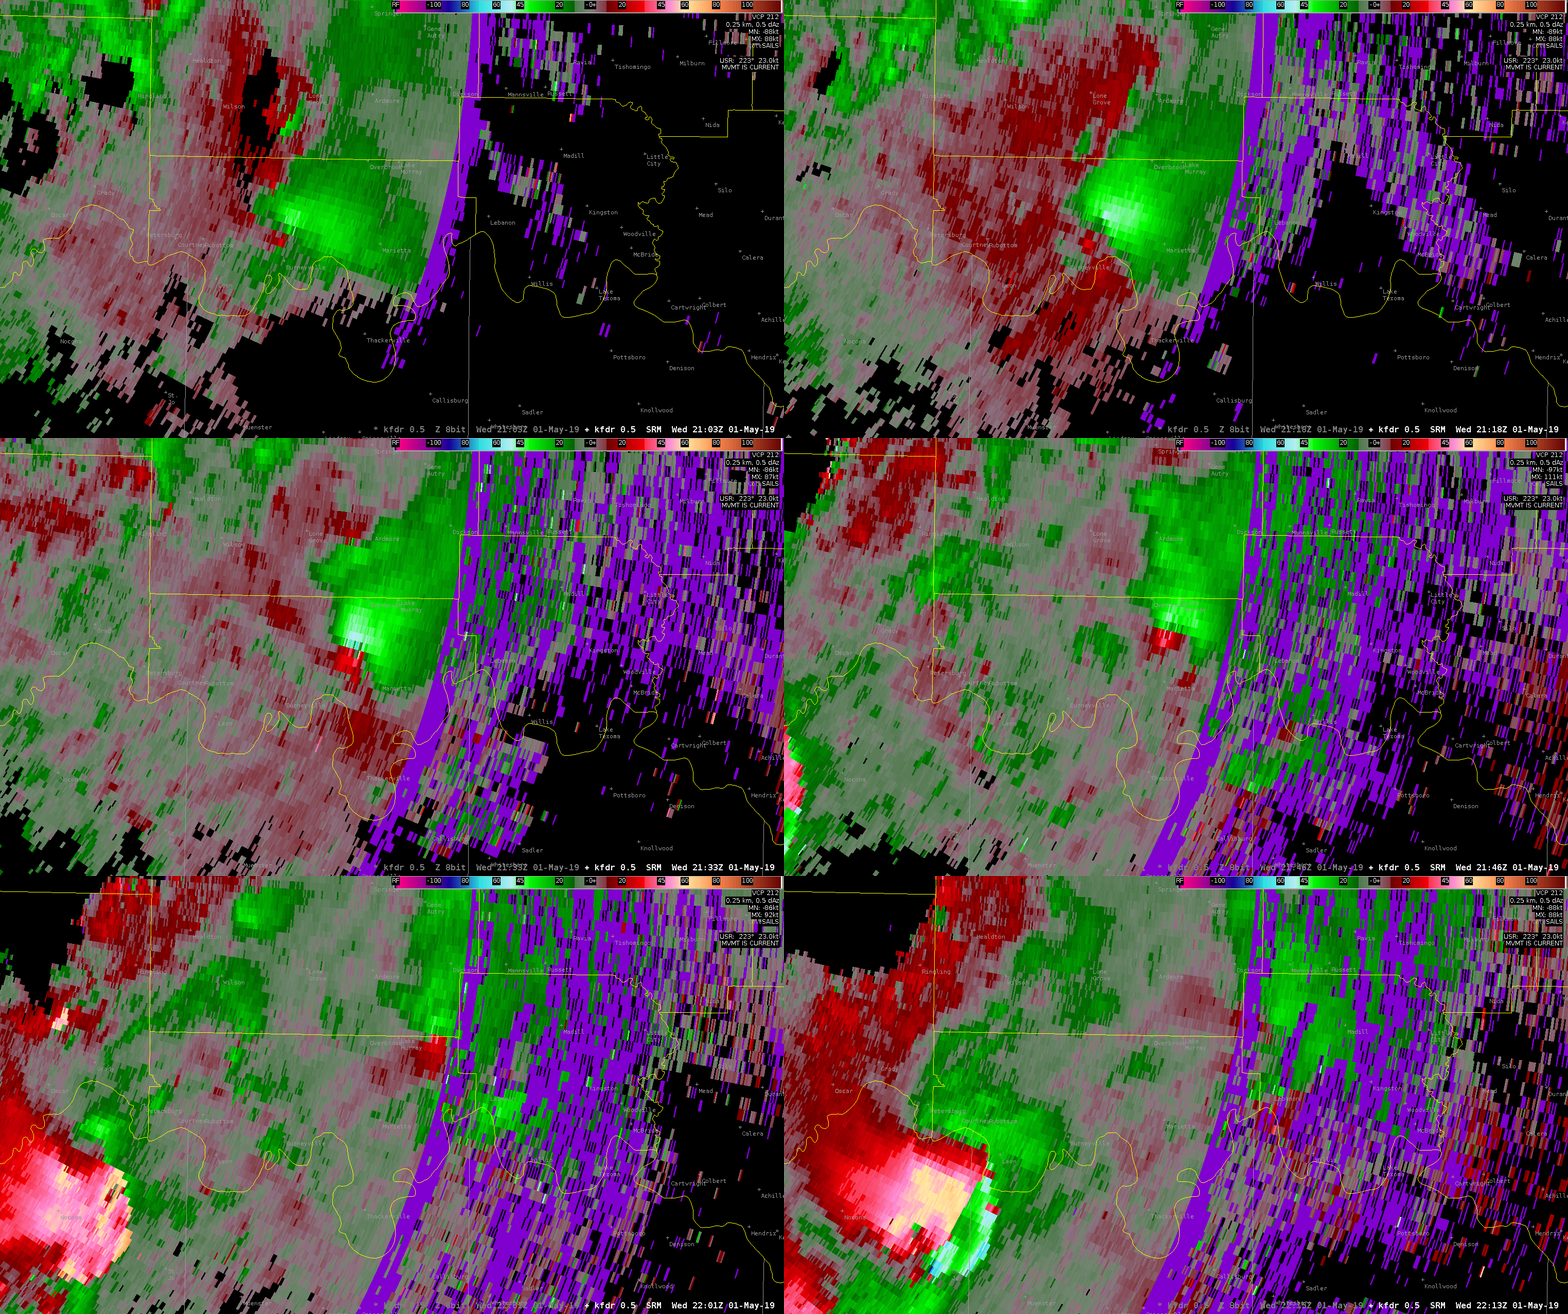
KFDR 0.5 deg SRM 21:03-22:13.