May 2, 2019 All Sky Total PW vs Merged Total TPW

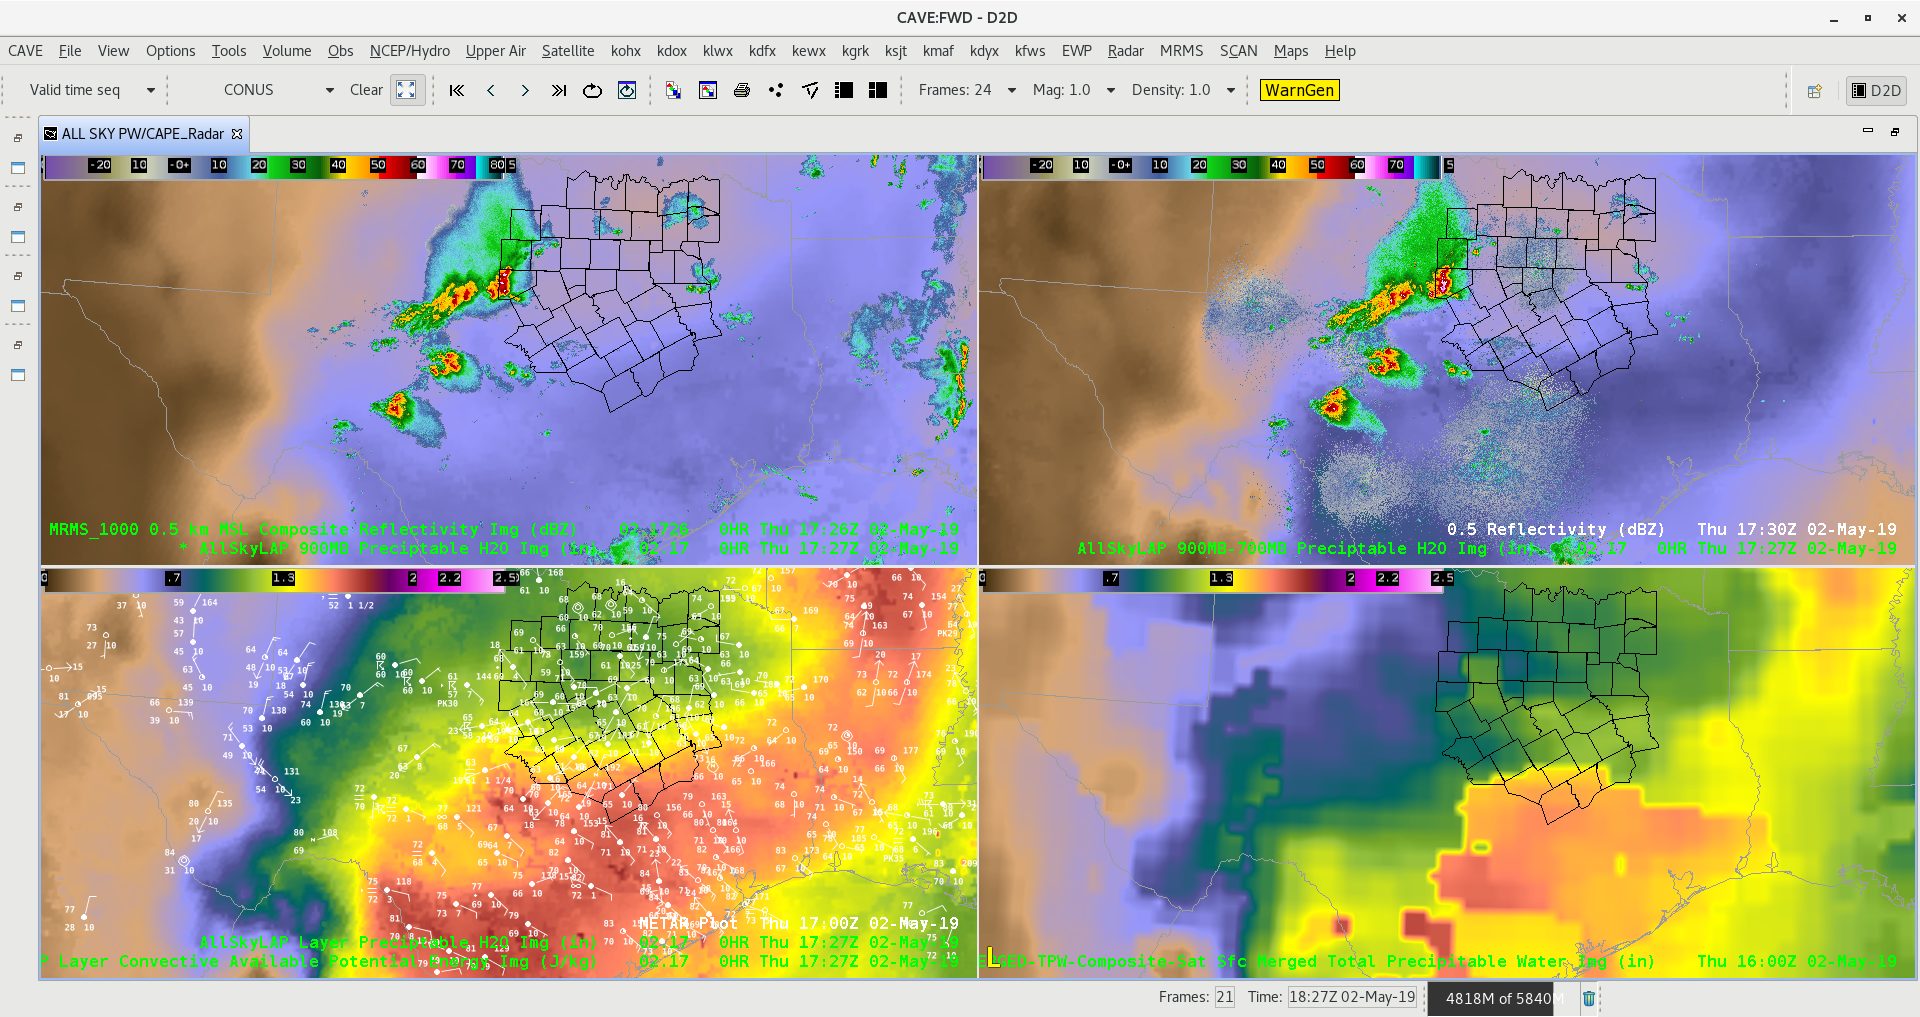
Figure A

All sky continues to handle total PW better than CIRA Merged Total PW looking at the bottom two frames. Notice the westward expansion of better moisture in the All Sky which matches up with surface obs compared to much lower values further west on Merged Total PW.

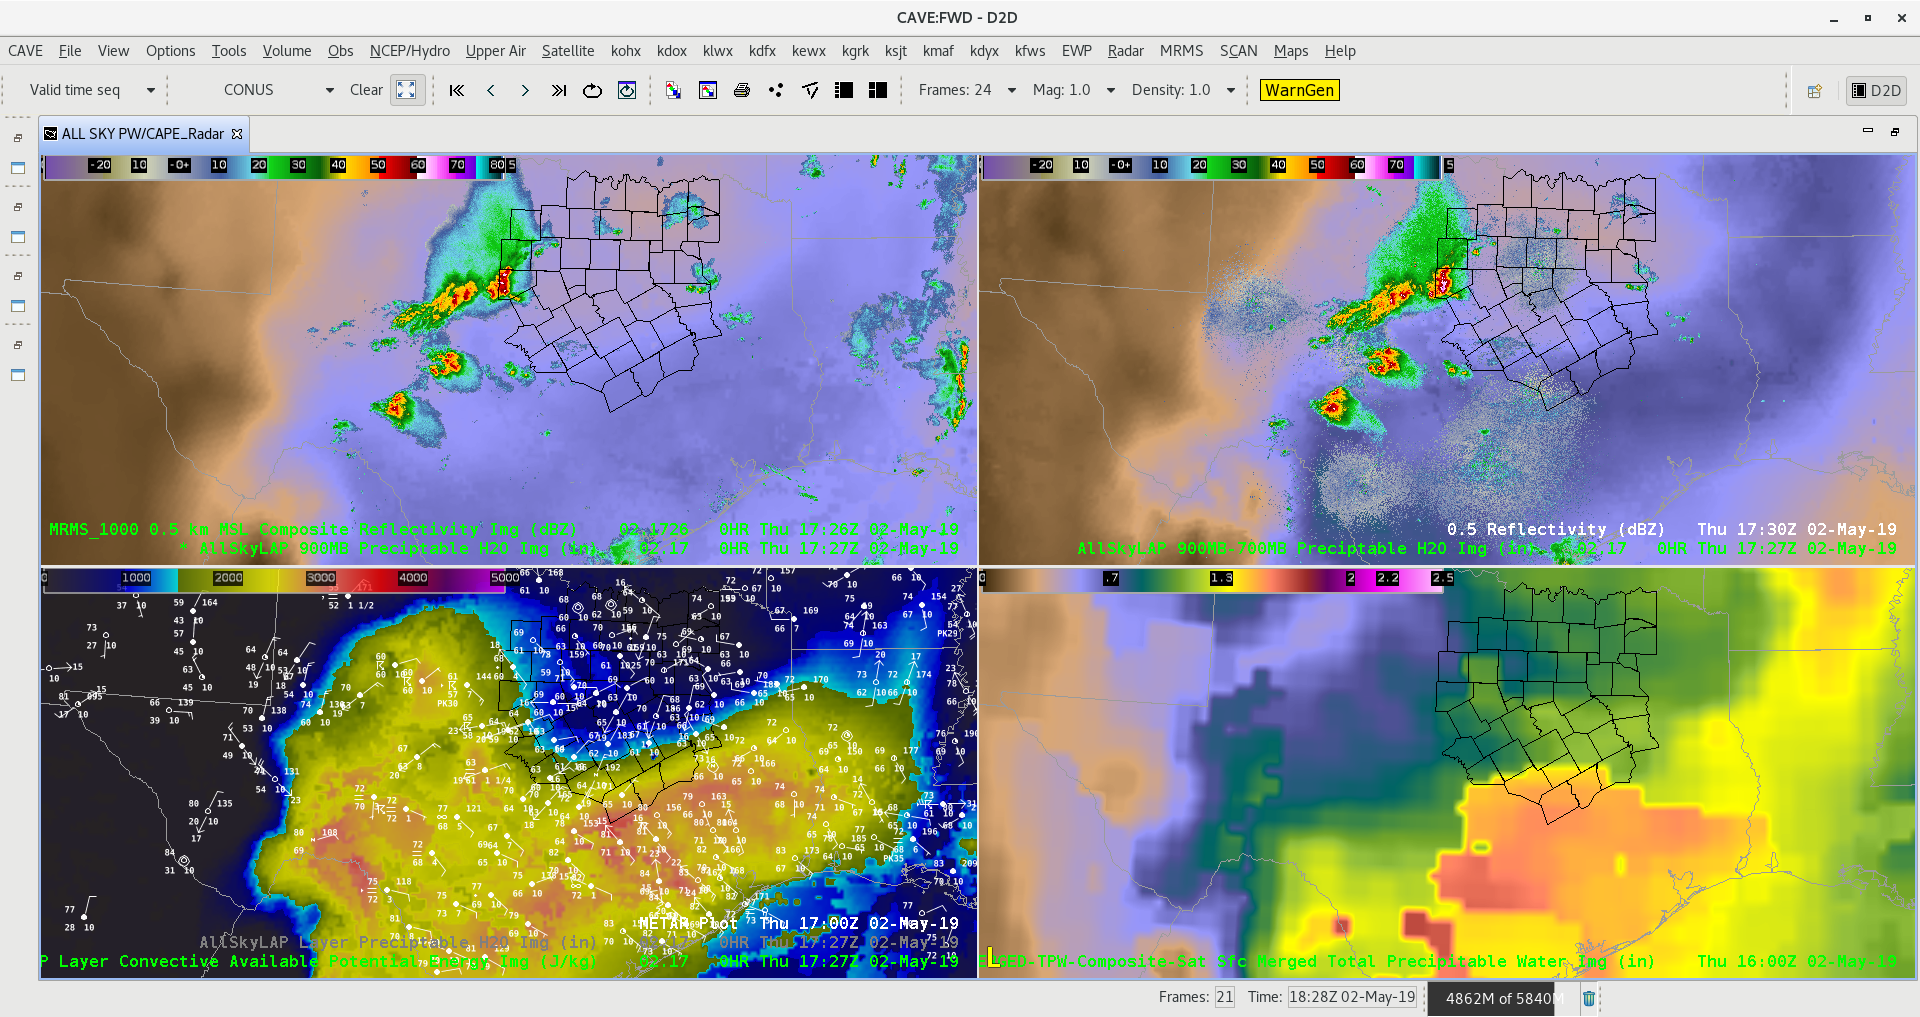
Figure B

Looking at the lower left panel for CAPE in the All Sky product we see a well defined instability gradient in southern FWS area which has our interest for higher probability of severe weather. Storms across central and northern parts of Dallas/Fort Worth area will be elevated, however storms that develop in southern part of the CWA could become surface based along the instability gradient.  -Jake Johnson

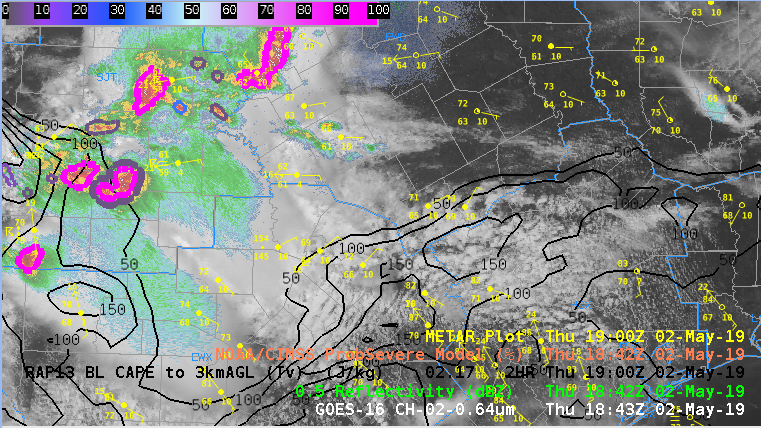
Figure C

RAP13 0-3km CAPE is favorable for surface based storms in far southern FWS CWA.

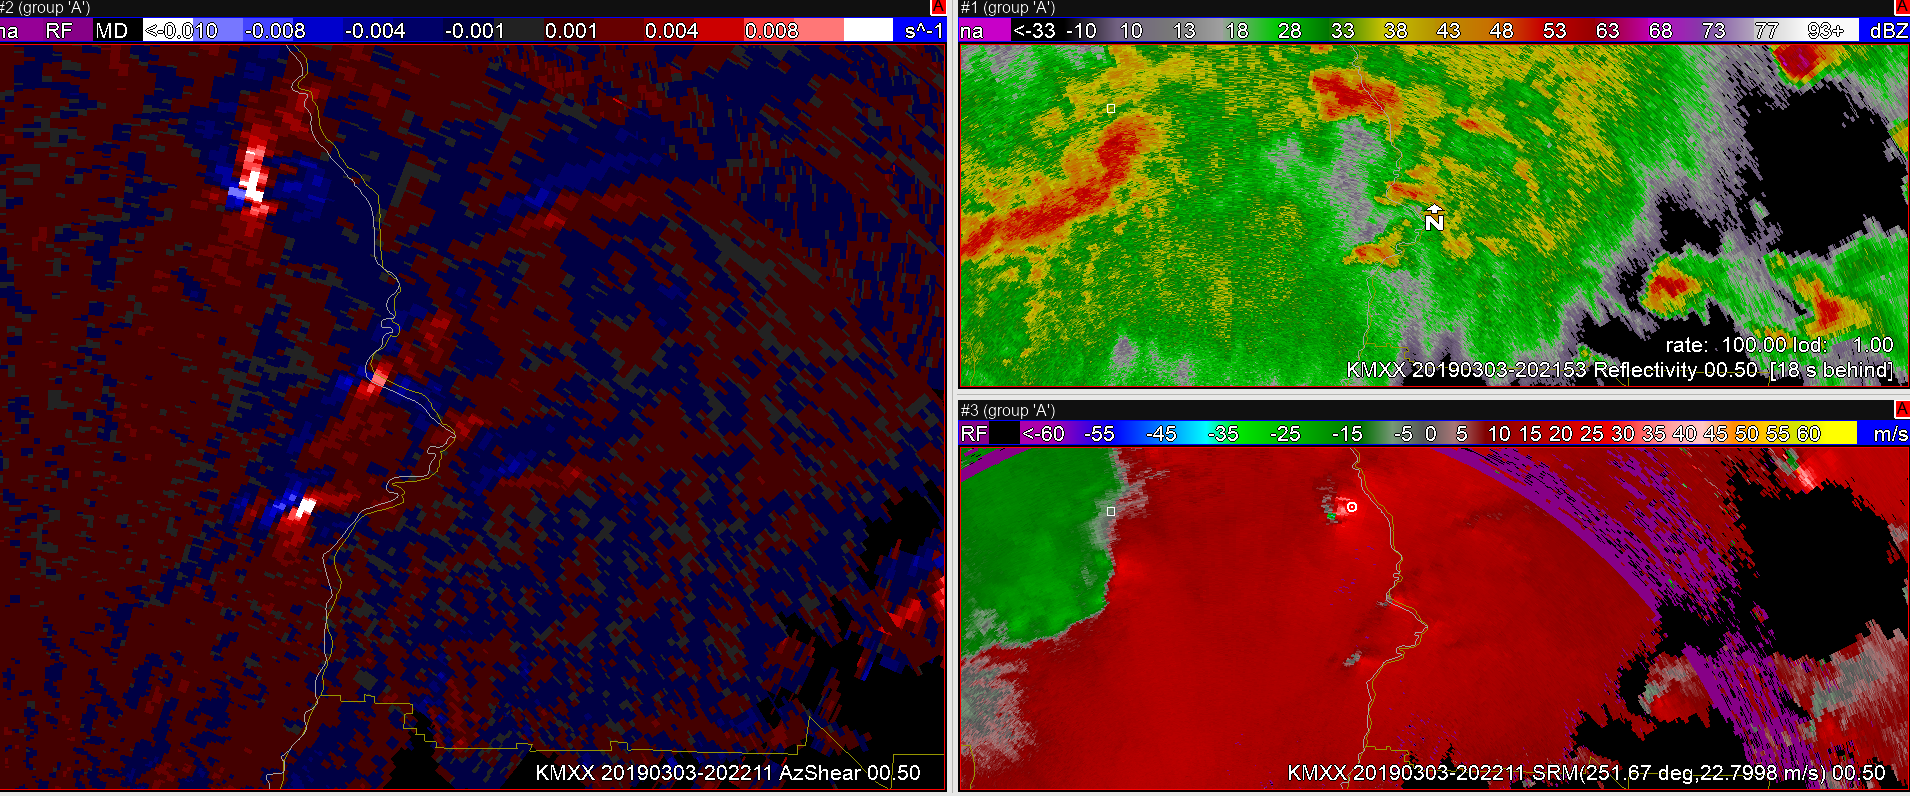
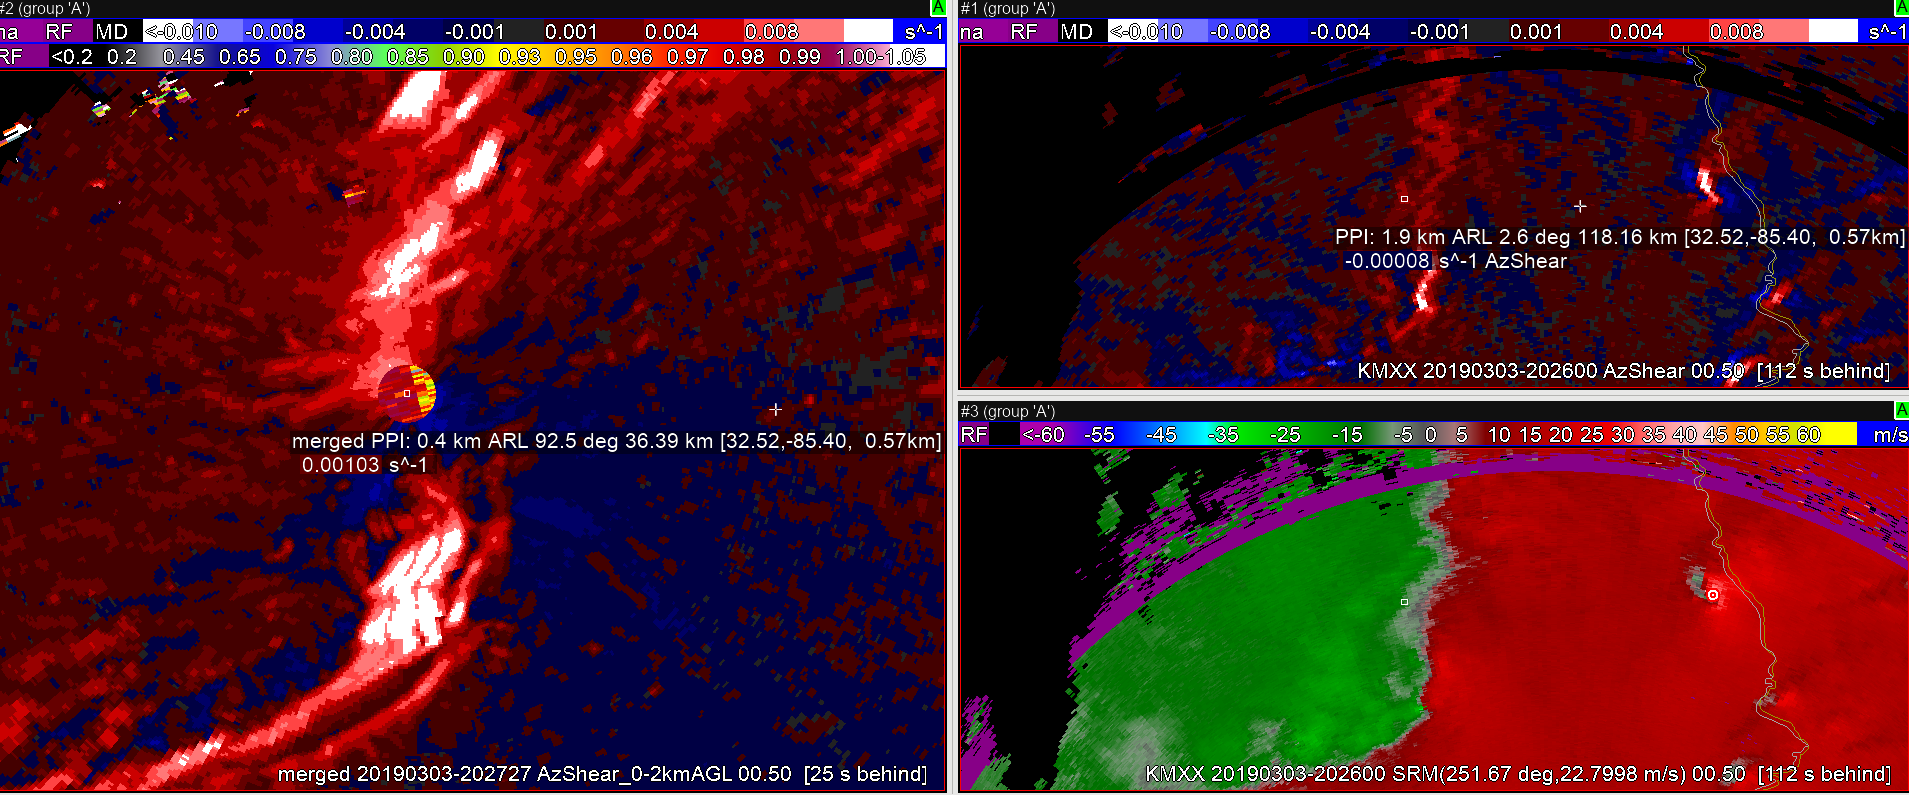
Merged AzShear issues

Obvious issues with merged AzShear not seen in the single radar product: multiple reflections of the velocity gradient along the leading edge of the convective line. The single radar AzShear maintained a single, more coherent circulation.

Today’s Experimental Operations – May 2, 2019

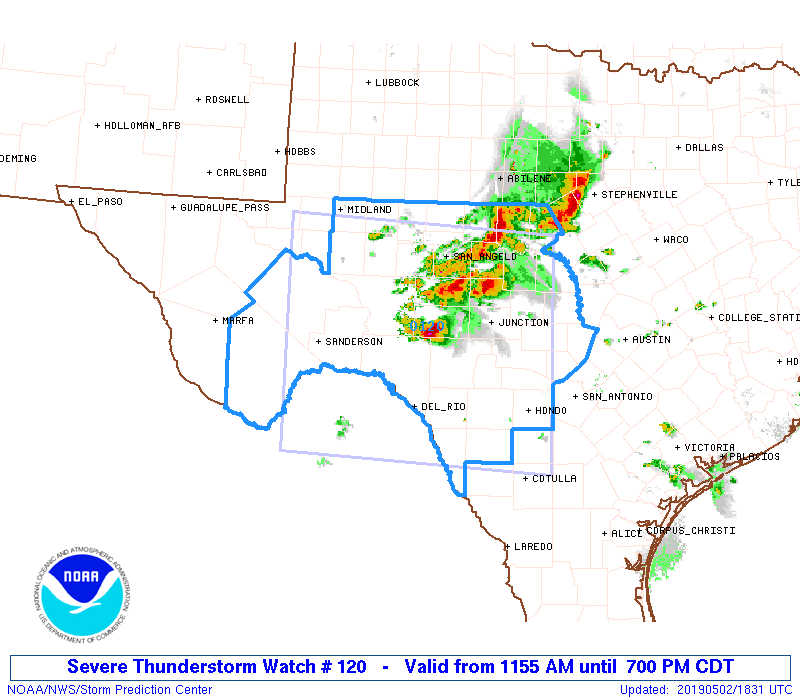
Today’s operations will be focused over the SJT (San Angelo), FWD (Dallas/Fort Worth), and EWX (Austin/San Antonio) county warning areas.  Focus is once again ahead of an outflow boundary left over from overnight storms.  To keep with the theme this week, storms are again on-going at the start of the operations period with a severe thunderstorm watch in place over a portion of the operations area.  Supercells will be possible today but the scenario will be messy with storm interactions and mergers likely.   The main threats today are hail and high winds but a few tornadoes are possible.

Tags: None

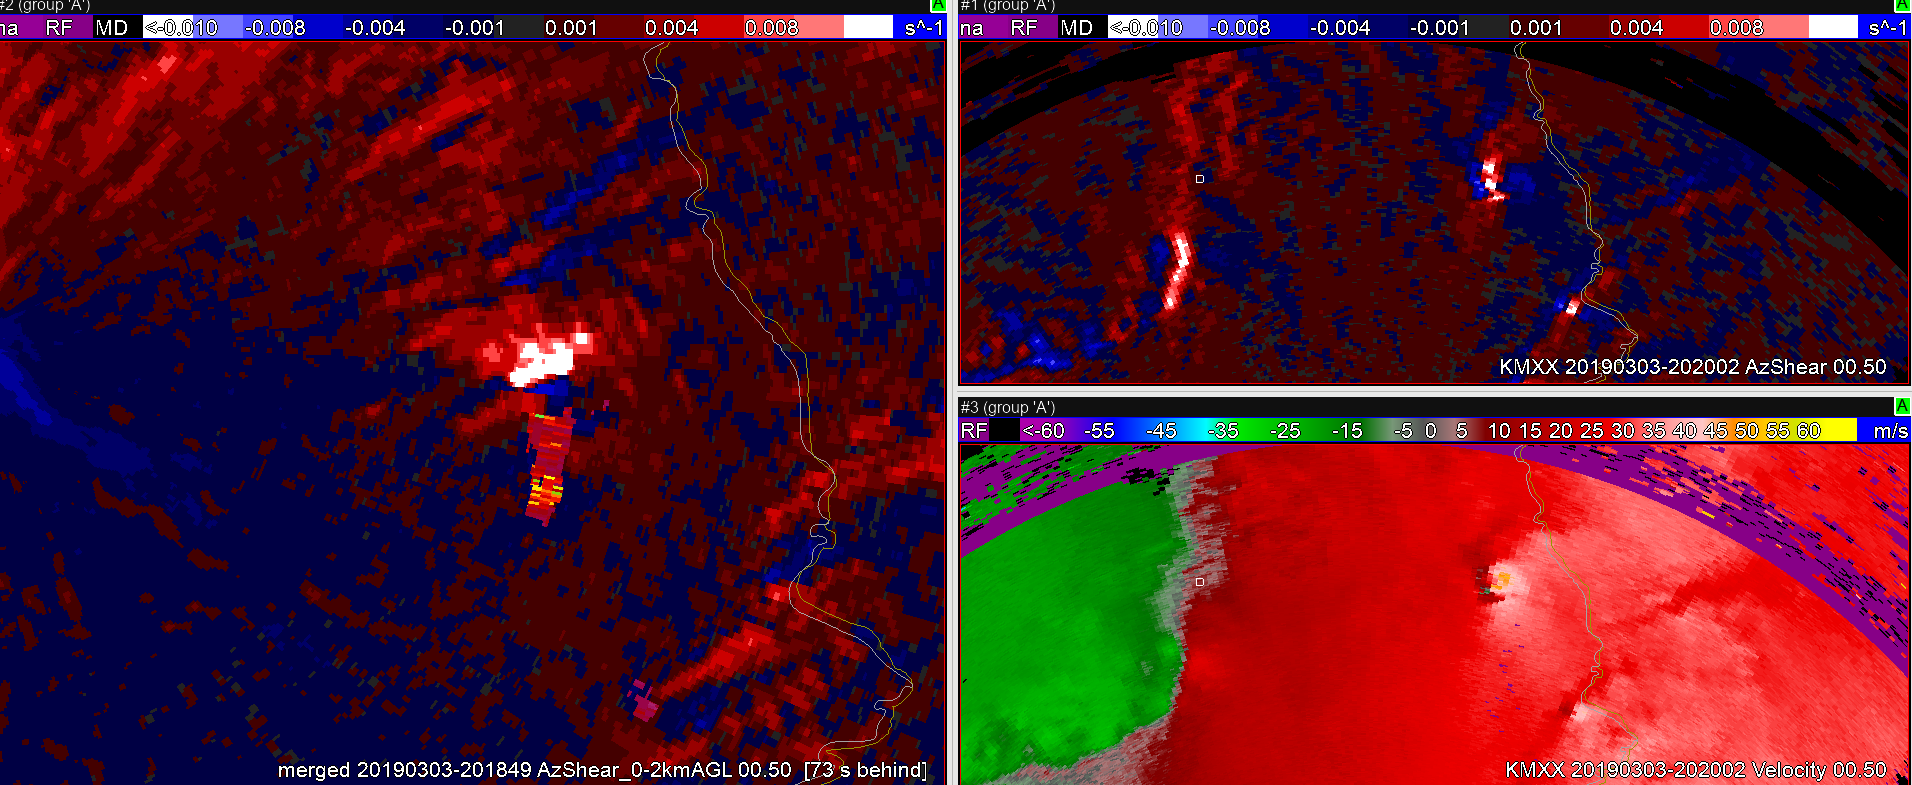
AzShear Smearing in Merged product


The single radar AzShear provided a cleaner look at the meso near the AL/GA border. The merged product had some bad data that made it look less representative and would likely cause confusion or loss of confidence by the forecaster.

Merged AzShear (L), KMXX AzShear (UR), vel (LR)

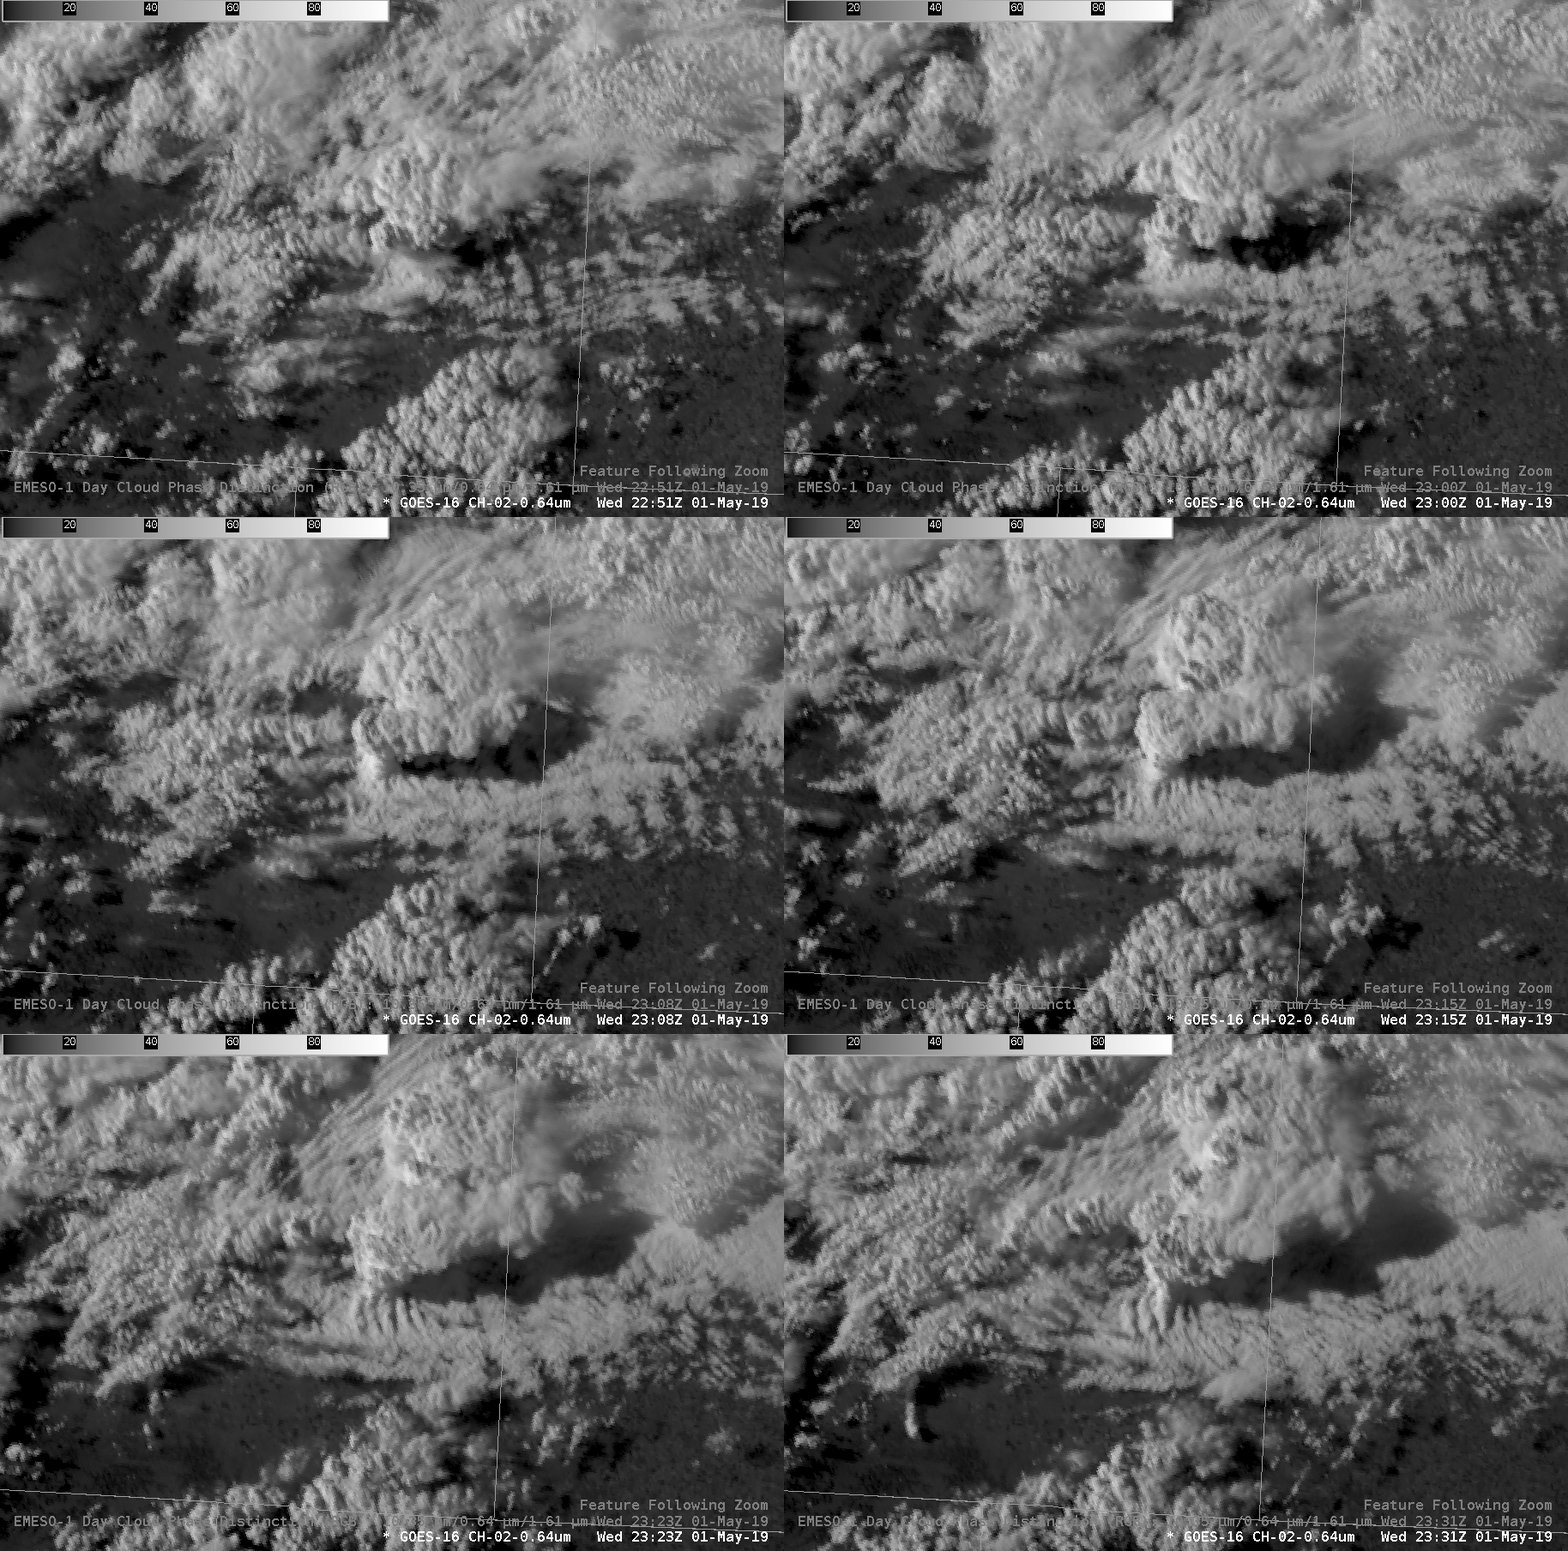
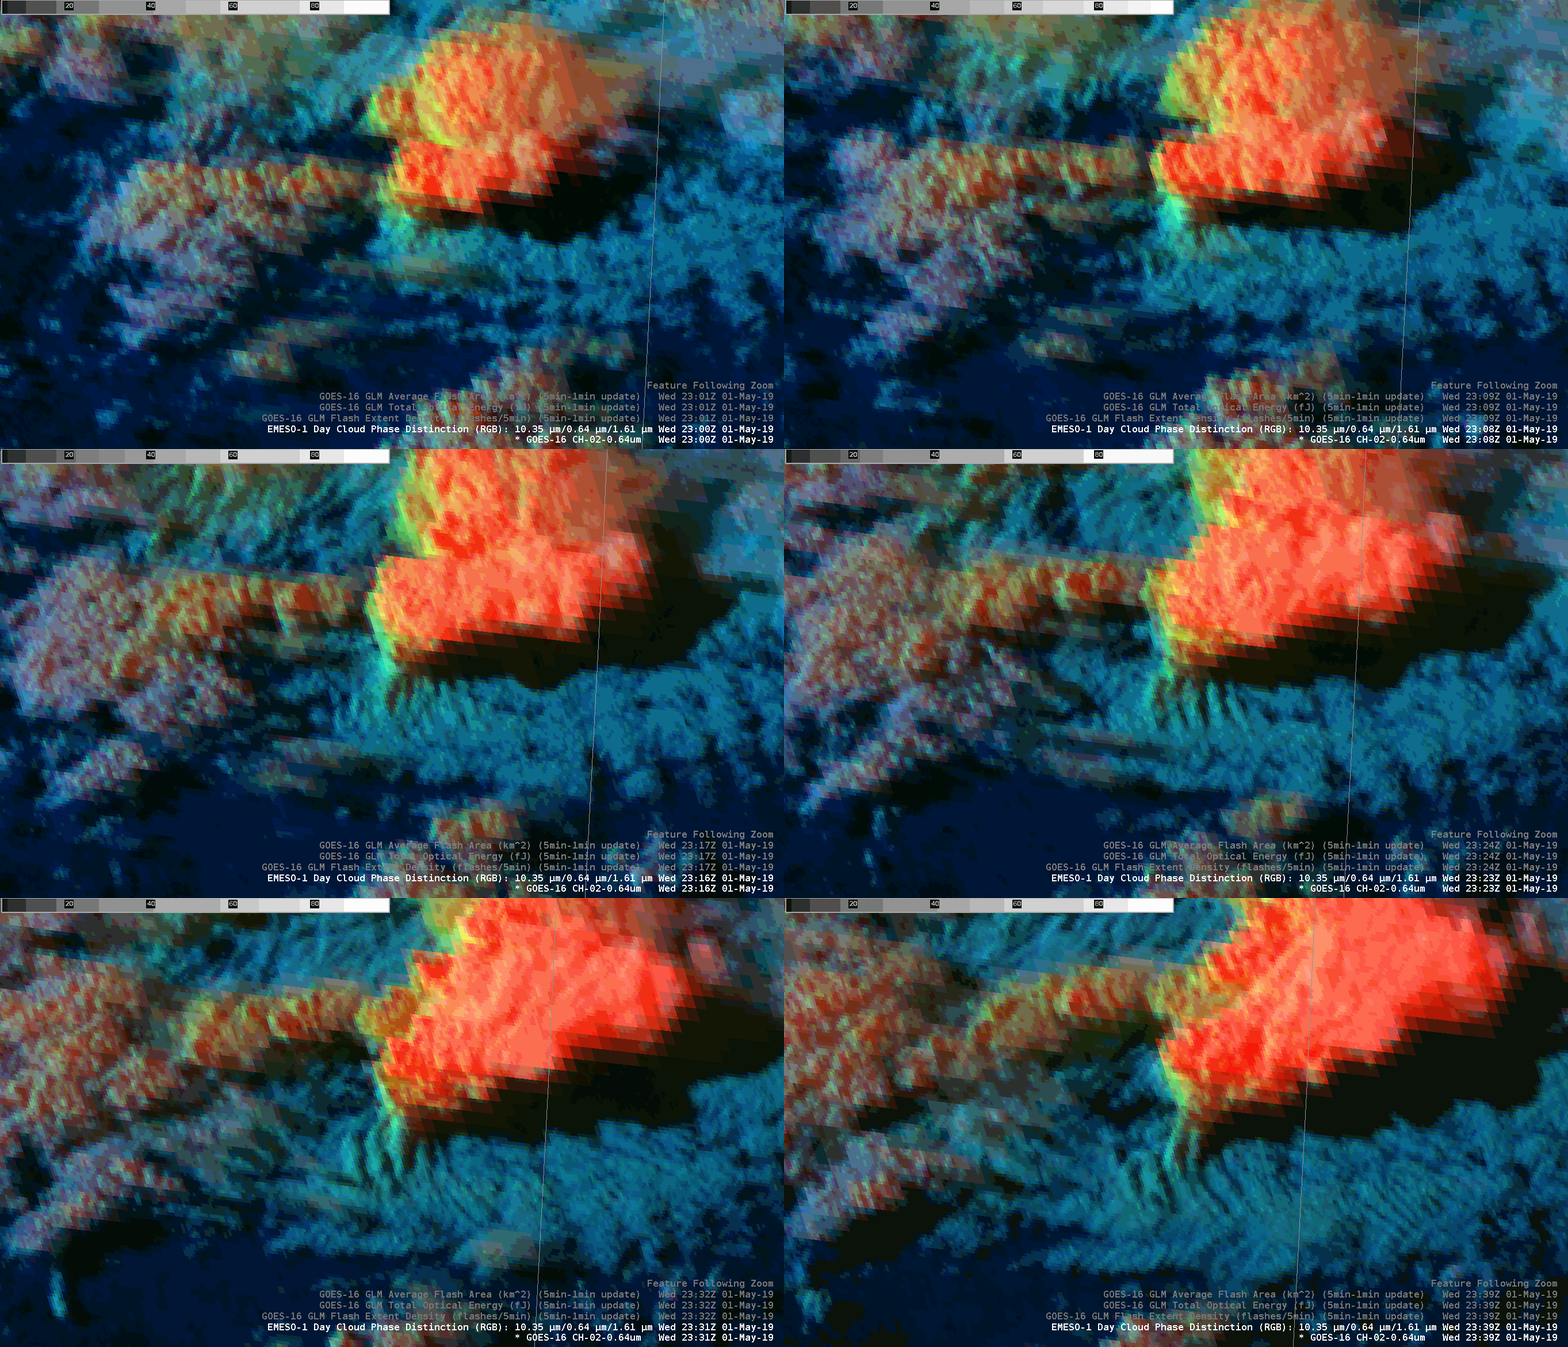
Spectacular 1 min GOES satellite imagery of a Colorado supercell

Using feature following zoom to stationary view track a supercell  in ECO. Many things visible here, including uplift and twisting of stratus deck in the inflow region, anvil plume texture, and updraft texture. The parallax error ends up helping the user get more info about the vertical structure and composition of the storm – contrary to the often requested need for ‘parallax corrected’ imagery.

Day cloud phase 1 min of the same storm. Does not get much better than this!

-Dusty Davis

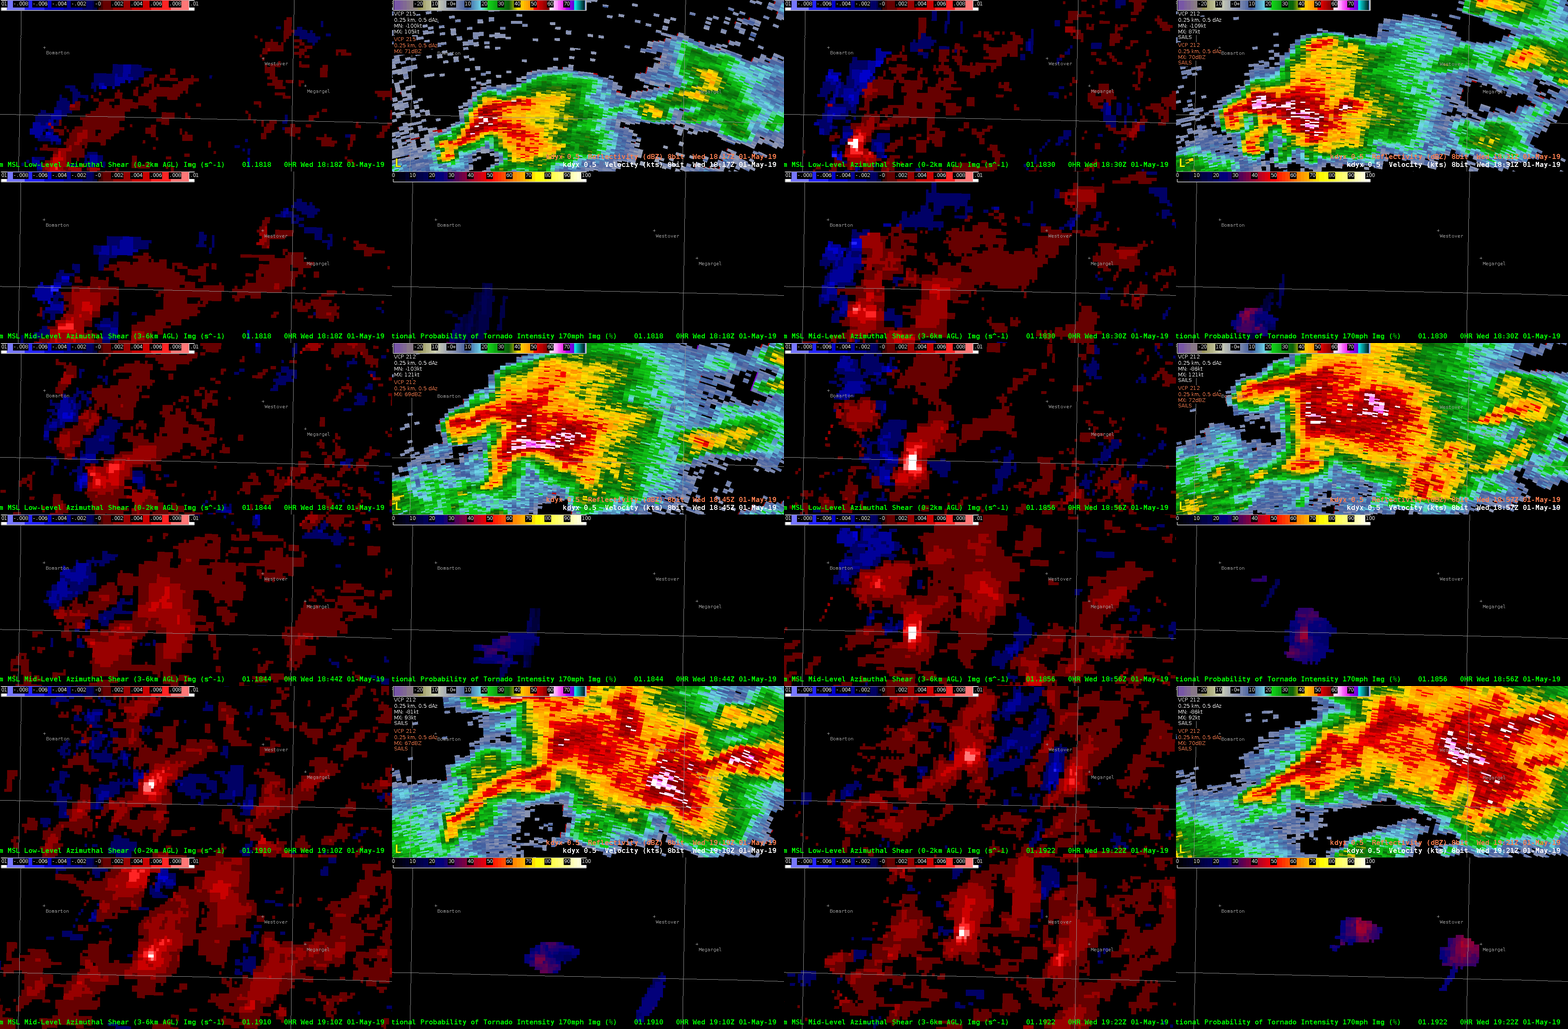
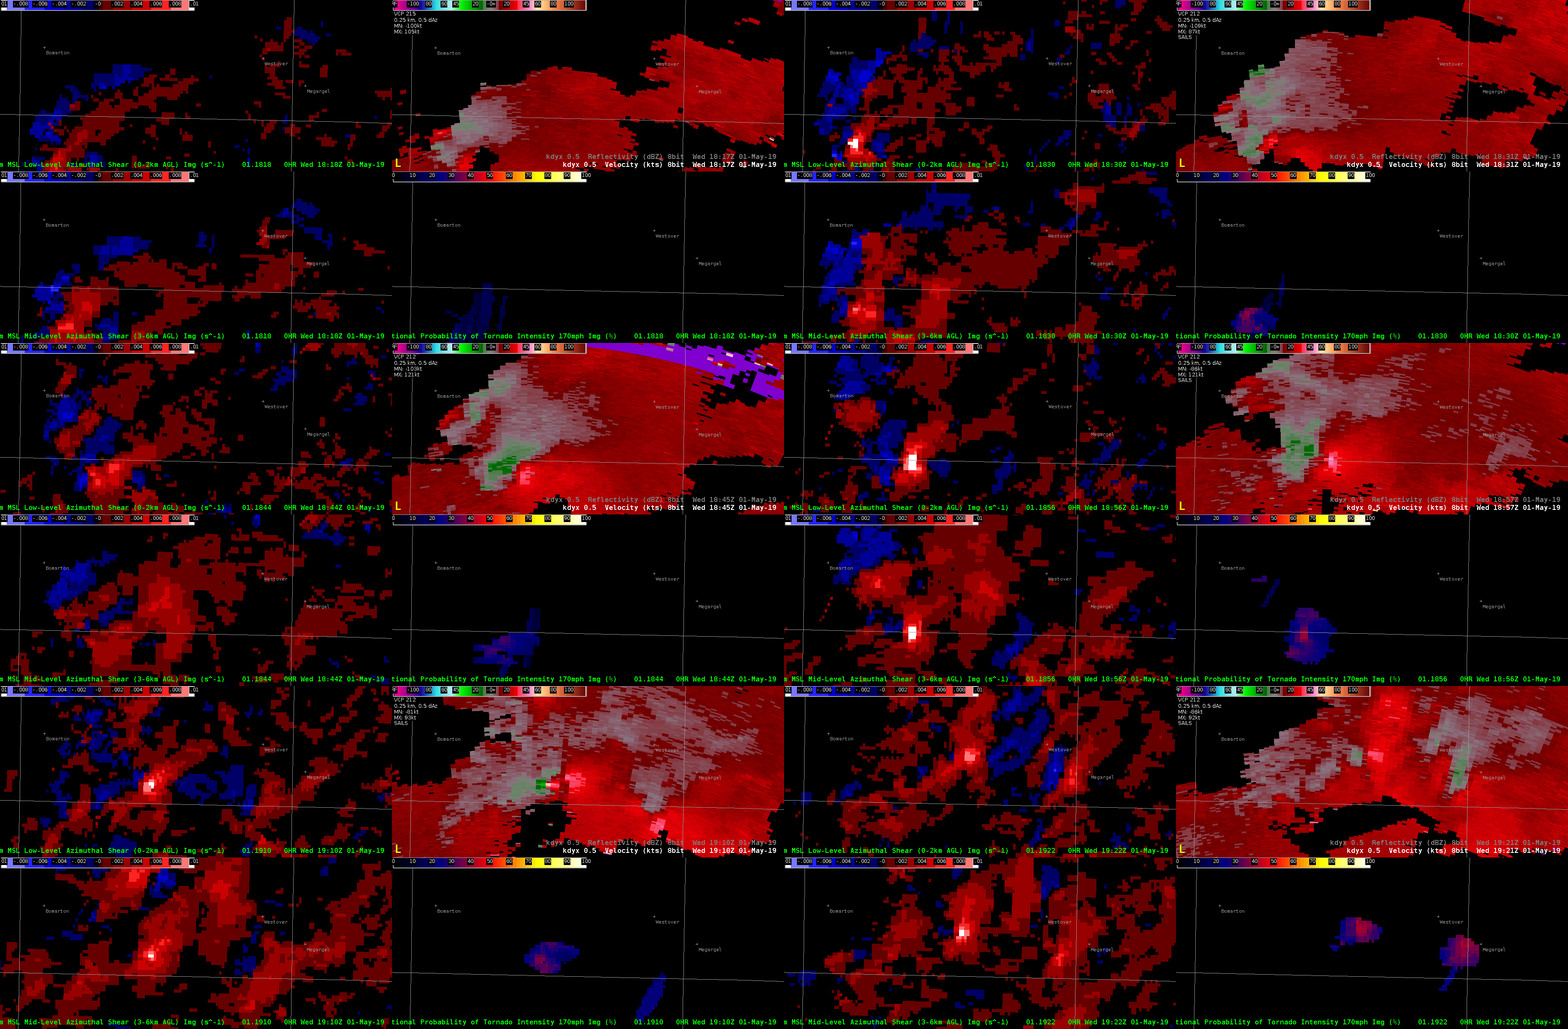
AzShear with a slower moving tornadic supercell and a faster moving outflow dominant cell

This example shows a supercell early in its lifecycle. The cell split and produced a tornado near the county boundary in the loop. In past examples, the AzShear product featured numerous time matching issues from multiple radar site’s data. In this case, cell motion was slower, possibly contributing to the less cluttered and more useful AzShear data.Same loop as above this time with V data. AzShear did anticipate possible tornadogenesis with upticks in values several scans before the tornado. On the bottom left, CPTI is shown for the 175mph threshold. Values for this threshold remained low.
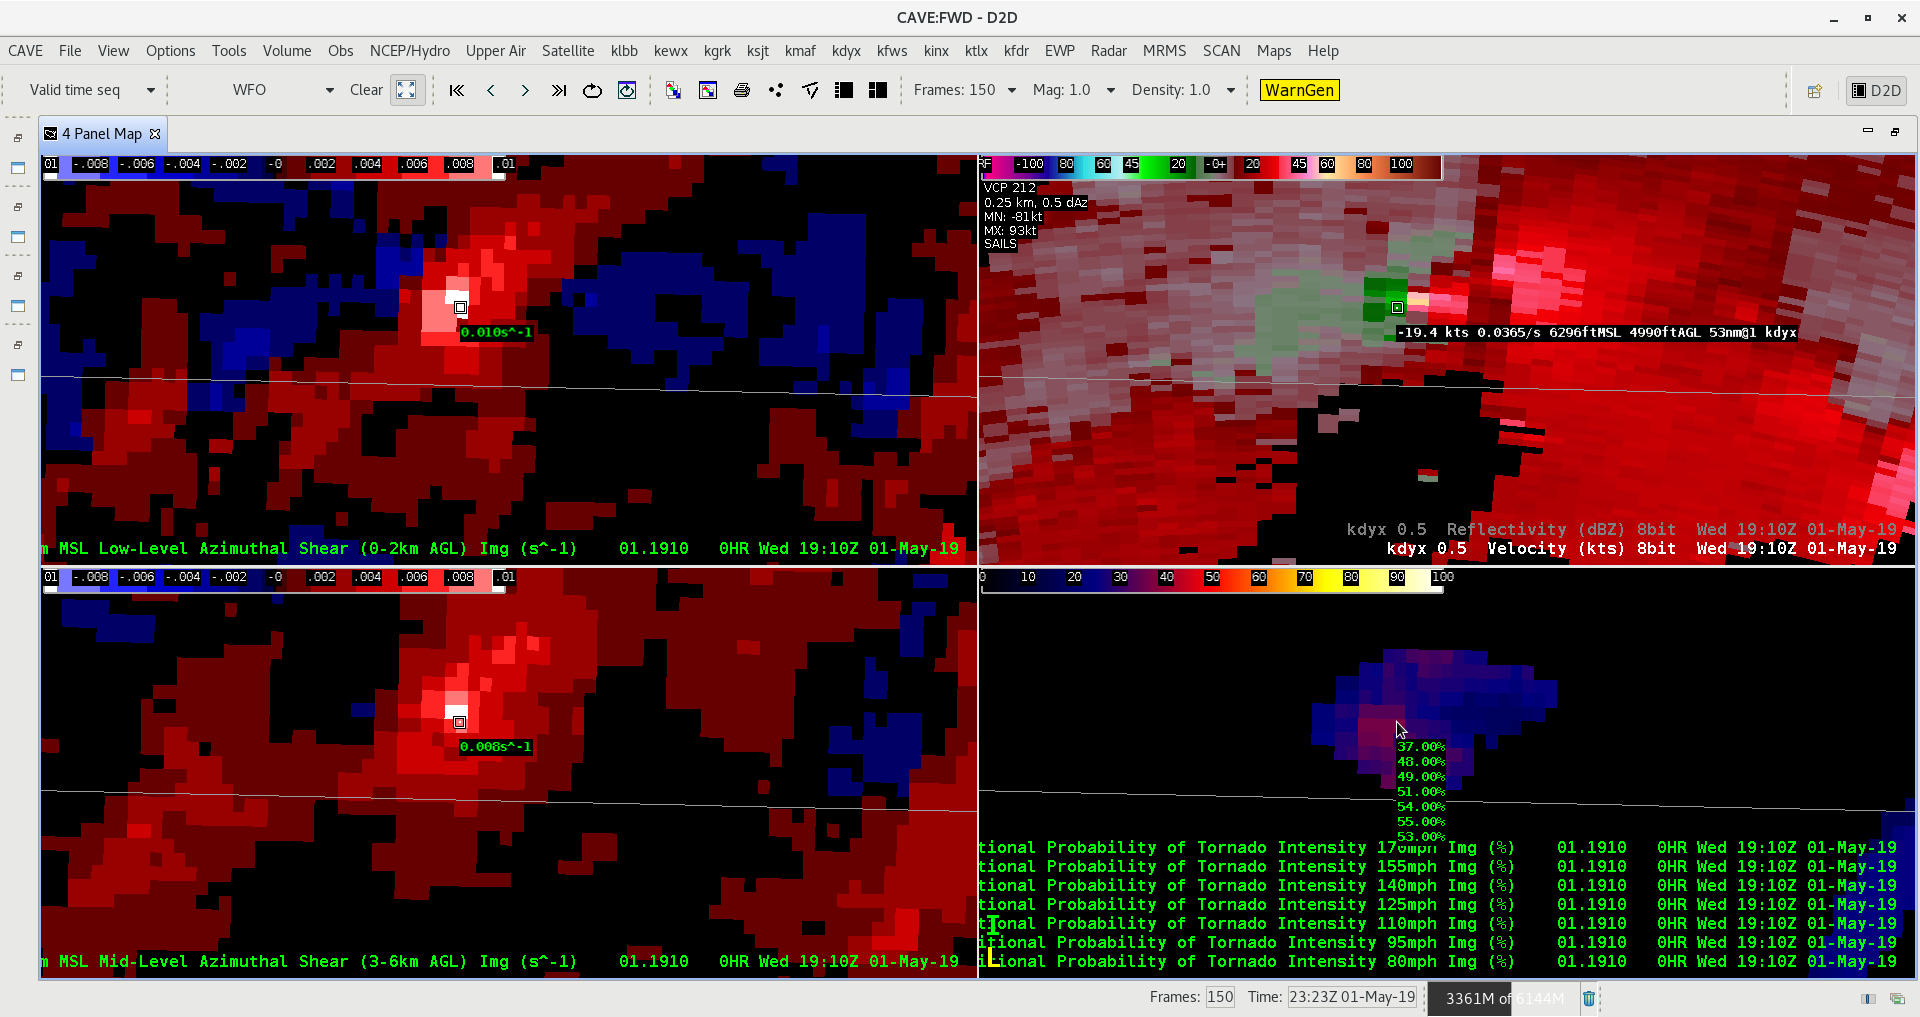
Values readout for the CPTI product on the bottom left at the time of strongest V couplet. Values ranged from 37 for 175 up to 48 for 155, but then did not show much of a change once again between 155mph down to 95 mph. In this range, the probability only rose from 48  to 55 percent between 155 to 95. Then, strangely enough, the prob dropped back down to 53 percent for 80mph.
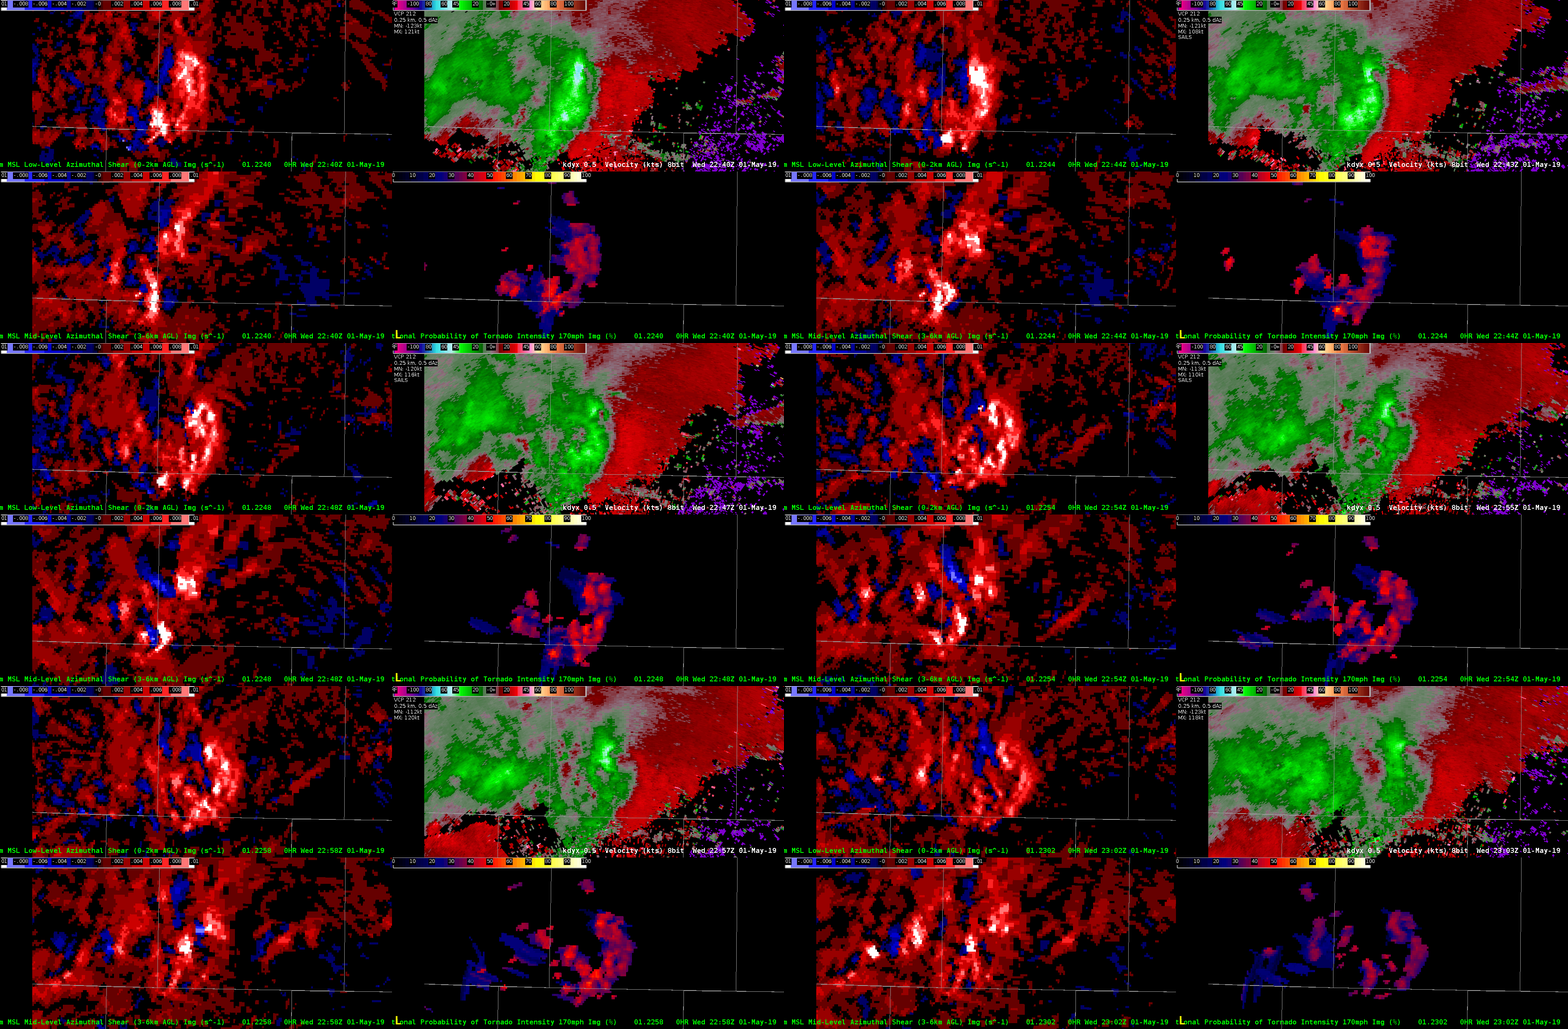
This later example shows another case of multiple sampling issues with AzShear


-Dusty Davis


ProbSevere – Transition from hail to wind threat

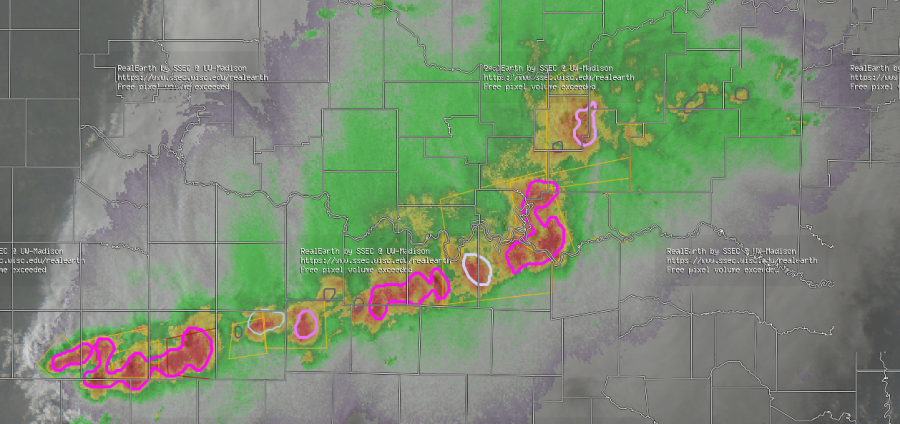
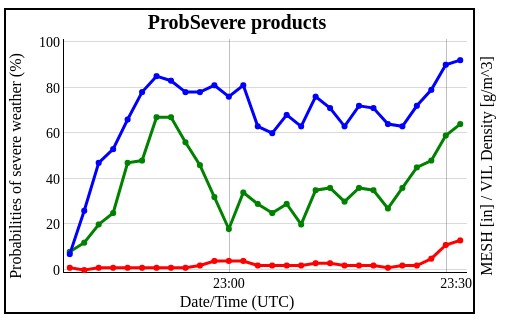
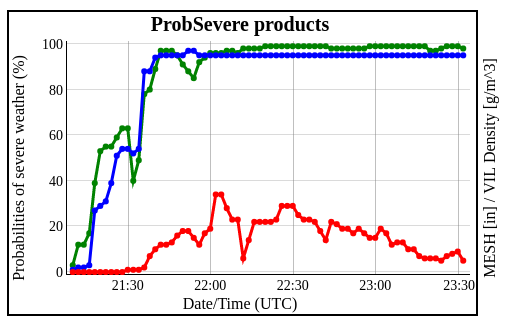
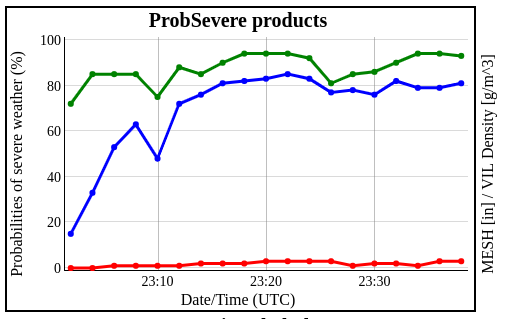
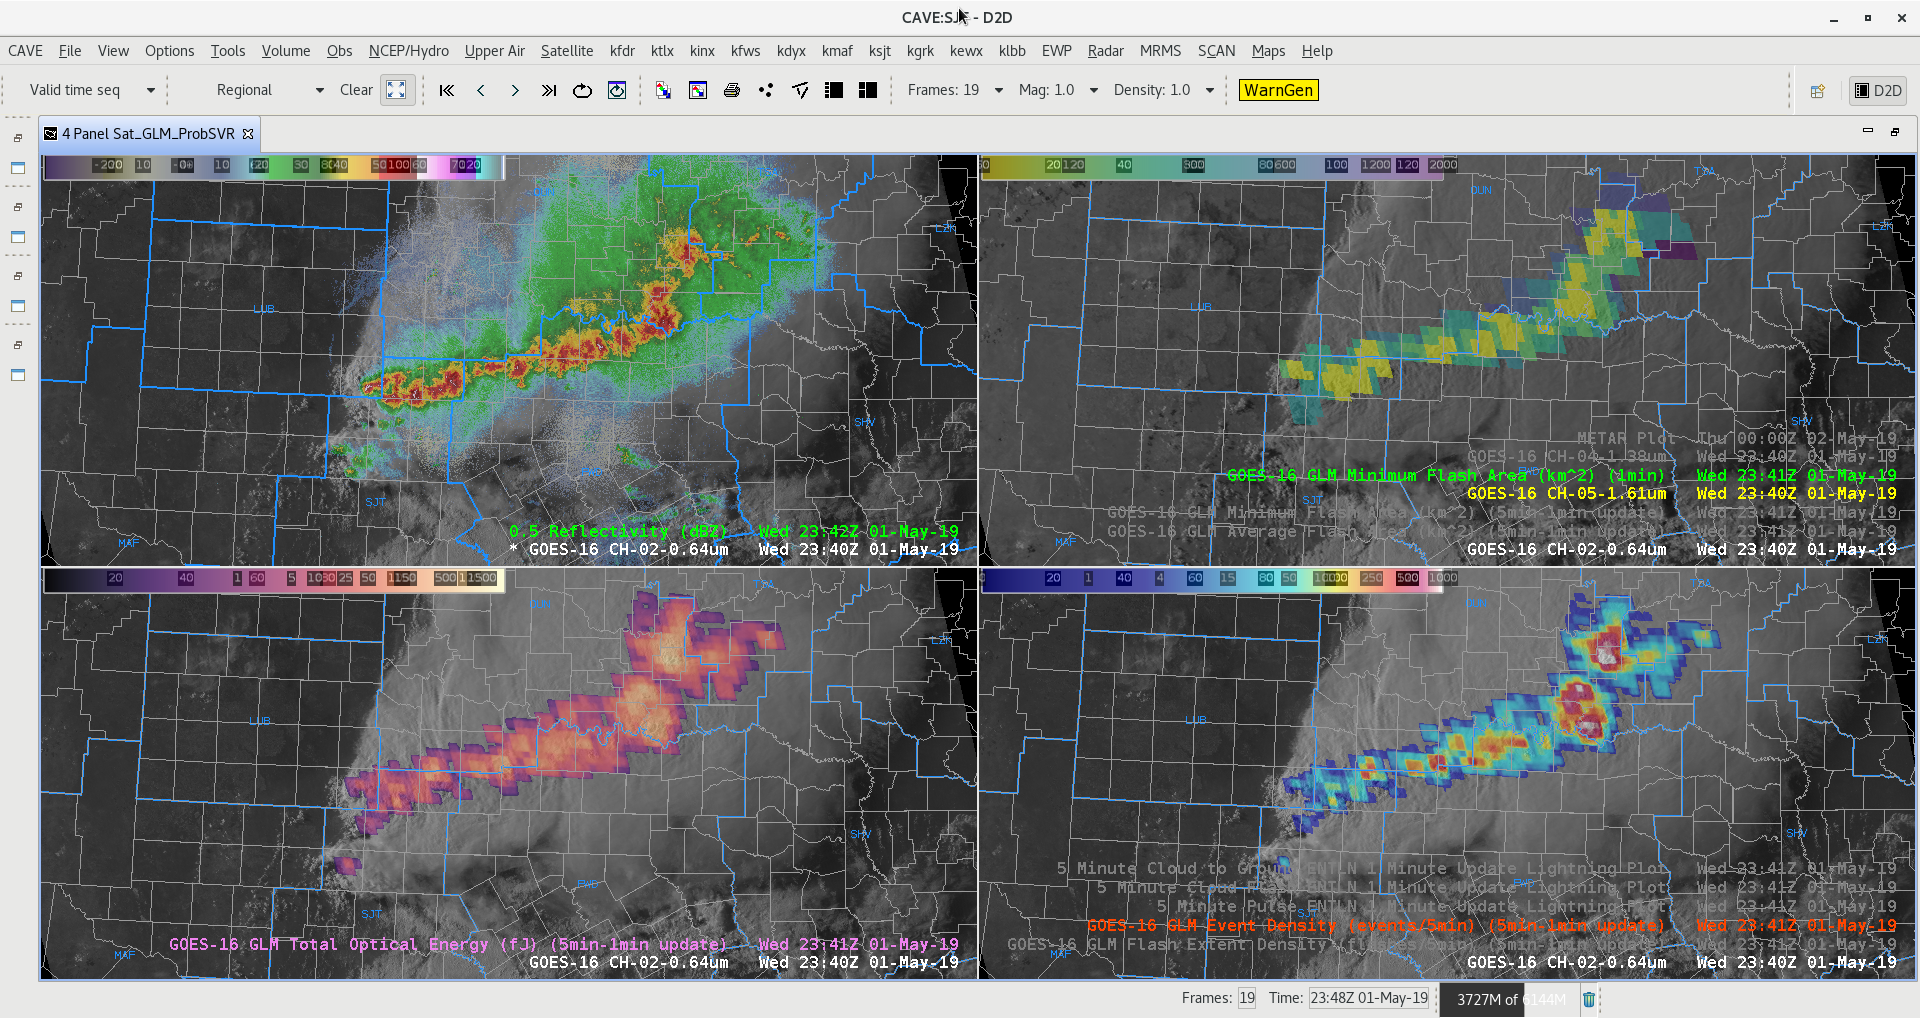
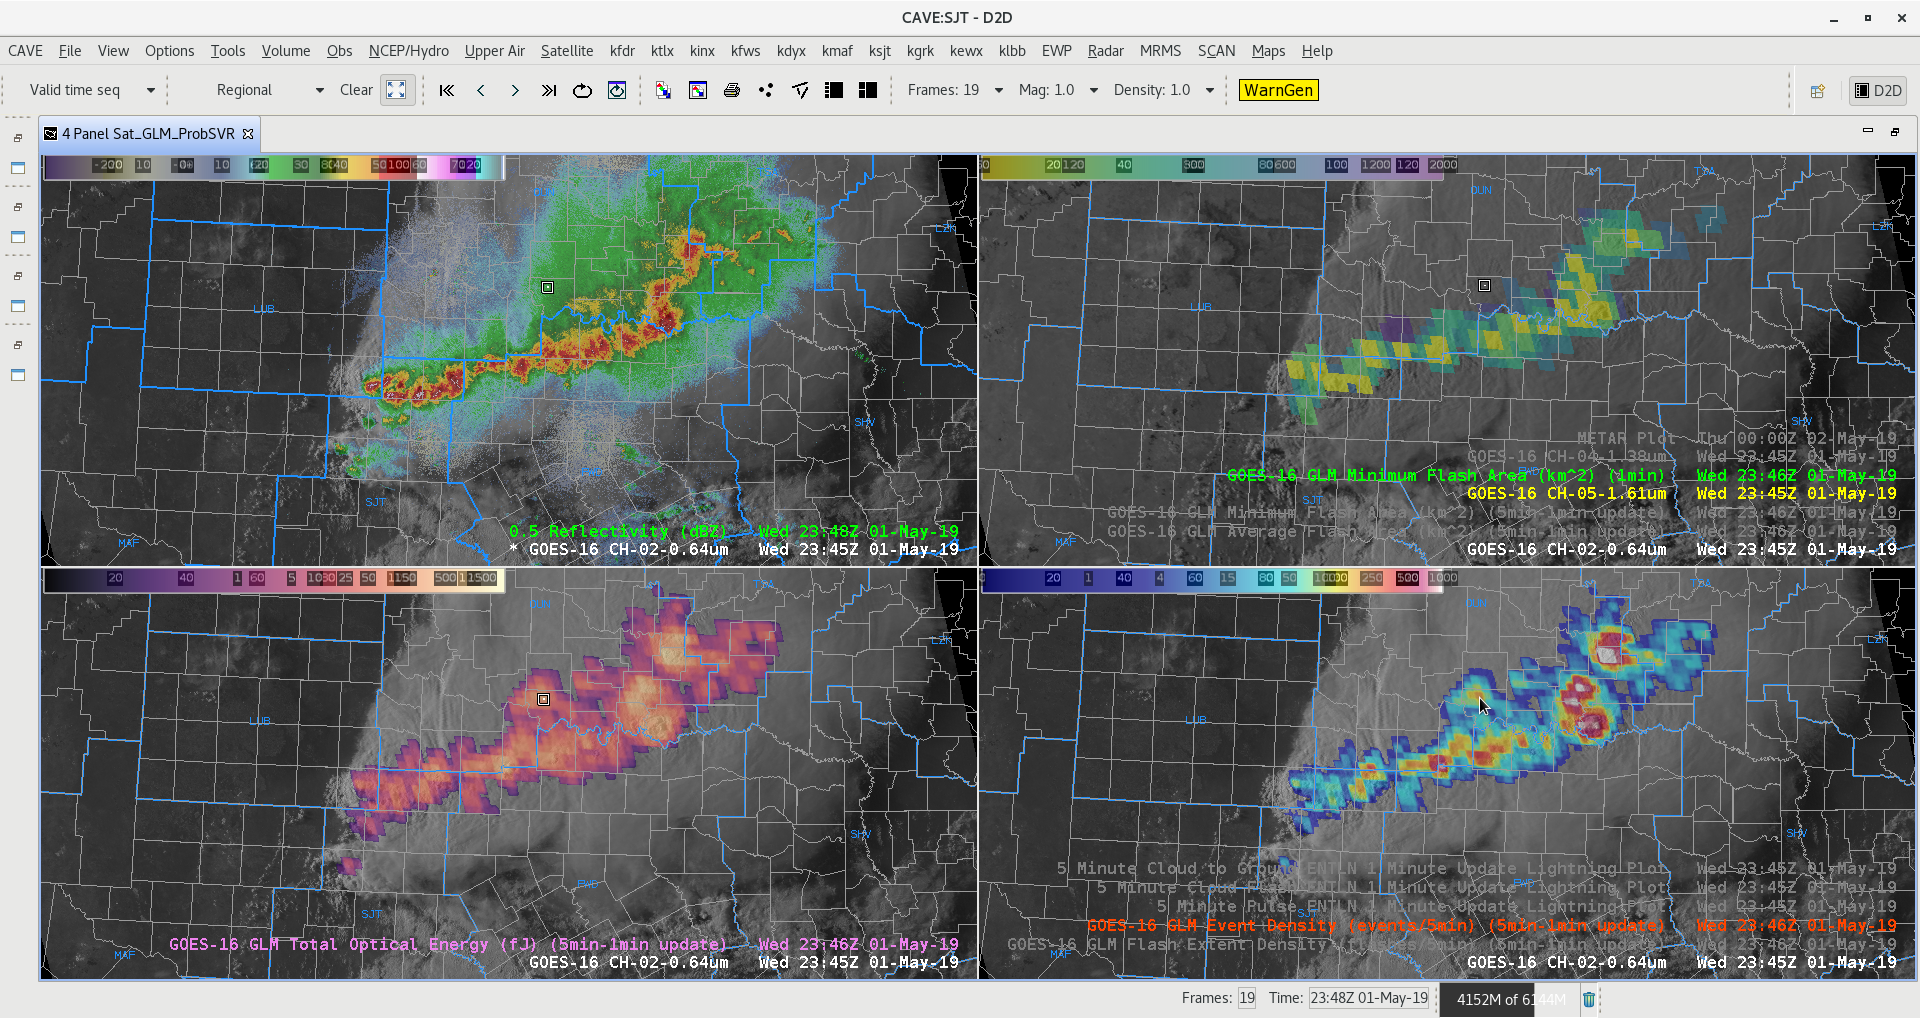
ProbSevere seemed to have a pretty good handle on the dominant severe threat  as initially discrete storms early in the day,  began to congeal and grow upscale into the early evening north of the Red River. This can be shown in same sample graphics below.     The first two trend graphics are from storm objects over the northern, maturing portion of the MCS, generally north of the Red River where mainly wind damage reports were observed (and some small hail).  The second two trend graphics are from somewhat newer storms that were developing southwestward into northern Texas where primarily hail (and wind) were observed.  – Quik Twip

High ProbWind values with severe reports!!

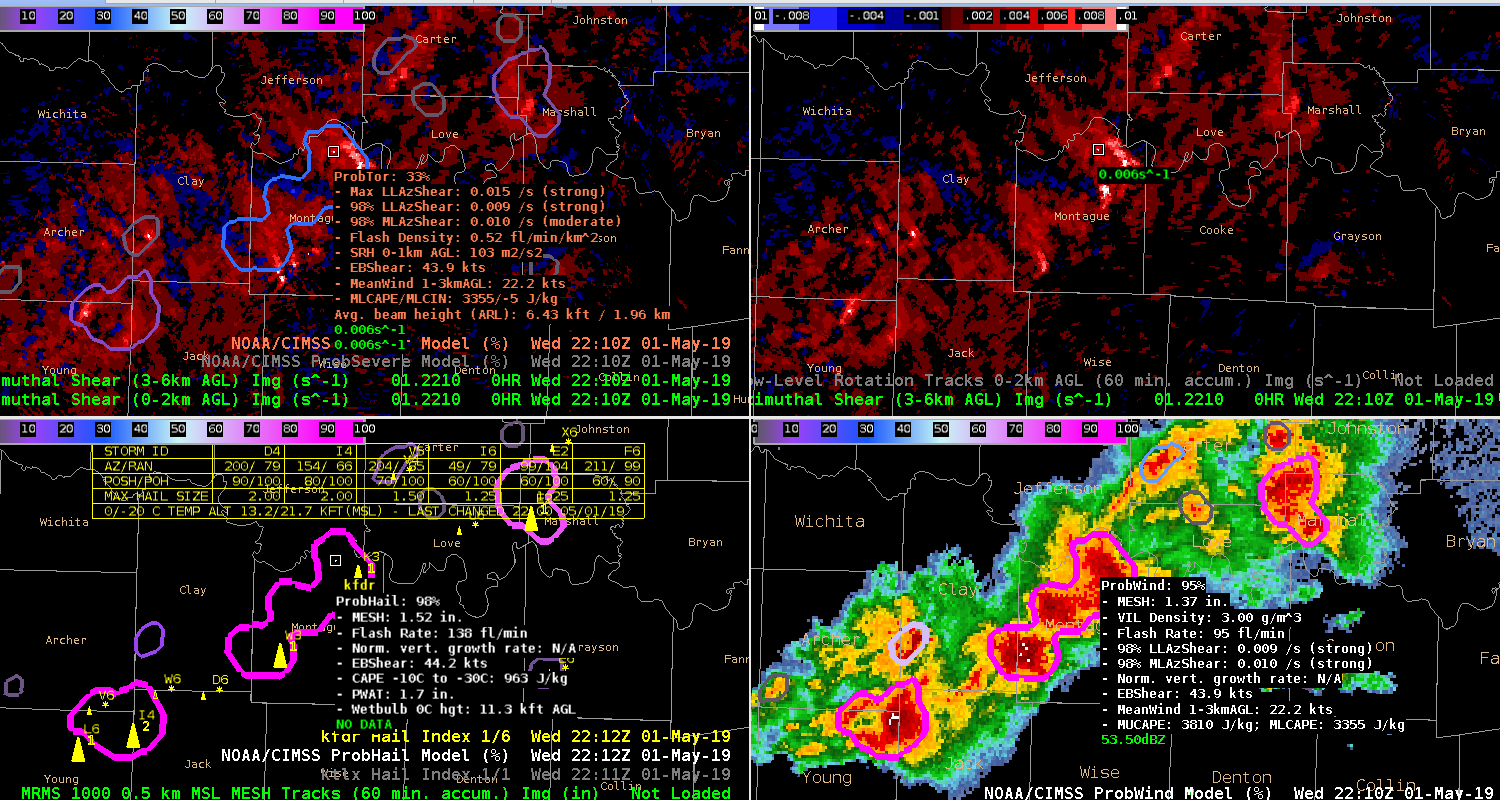
The storm cluster across N TX began to gust out late in the afternoon. Line motion was ~43kt as the storms surged across Montague county just south of the Red River. There was a report of wind damage in Texas (power poles blown down) and in Oklahoma (estimated 60-70 mph winds) associated with the storm cluster.  ProbWind was as high as it has been the past couple of days in the 92-95% range during this time. Of note, the Flash Rate was very high with the identified object, at times nearing 150 fl/min and the AzShear was ‘strong’. This combined with the environmental parameters helped increase the wind probs throughout the life of this cluster as it moved ENE. ProbWind was equally high with other objects to the northeast and southwest of the featured storms yet no wind reports were received from them. Interestingly though, ProbTor was ~30% with the Montague county object at this time helping draw attention to it.

Low Level AzShear (UL), Mid Level AzShear (UR), ProbHail (LL), ProbWind (LR)