AllSkyLaps_sfc900_vs_700-300 Comparison

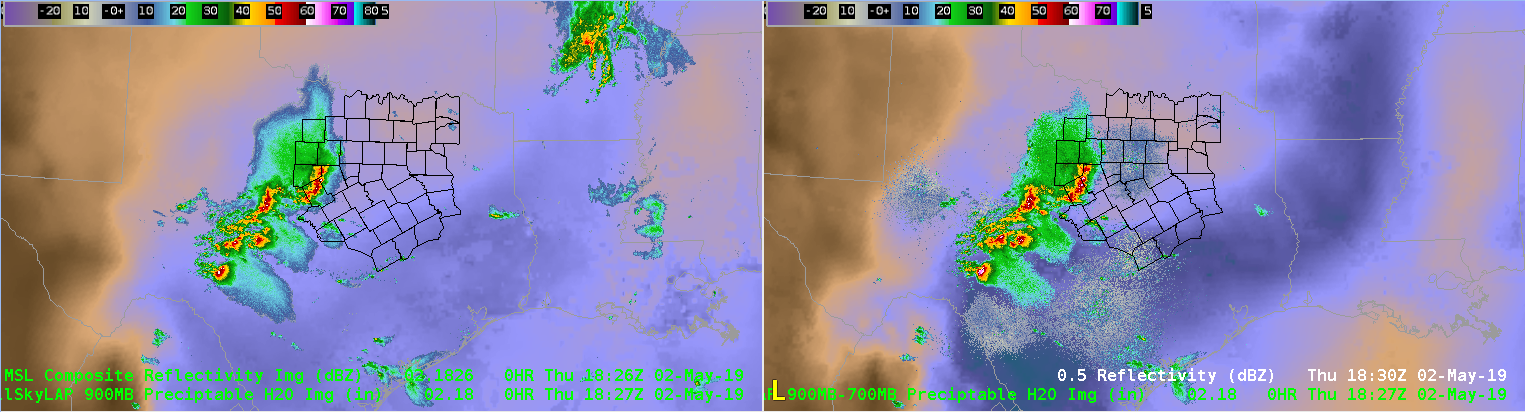
Monitoring environment downstream of convection entering FWD forecast area around 1830 UTC on May 2.  Top image is the sfc-900 mb ALLSkyLaps PW illustrating higher moisture over southern portion half of the FWD CWA.  Bottom image is the 700-300 ALLSky Laps PW illustrating much drier air above suggesting convective instability.   SPC Mesoanalysis  RAP downdraft CAPE (not shown) also suggests axis of highest DD Cape in this region suggesting environment supportive for damaging winds as line segments moves across the FWD area later this afternoon. – Quik Twip

GLM, Satellite, and Convection Initiation

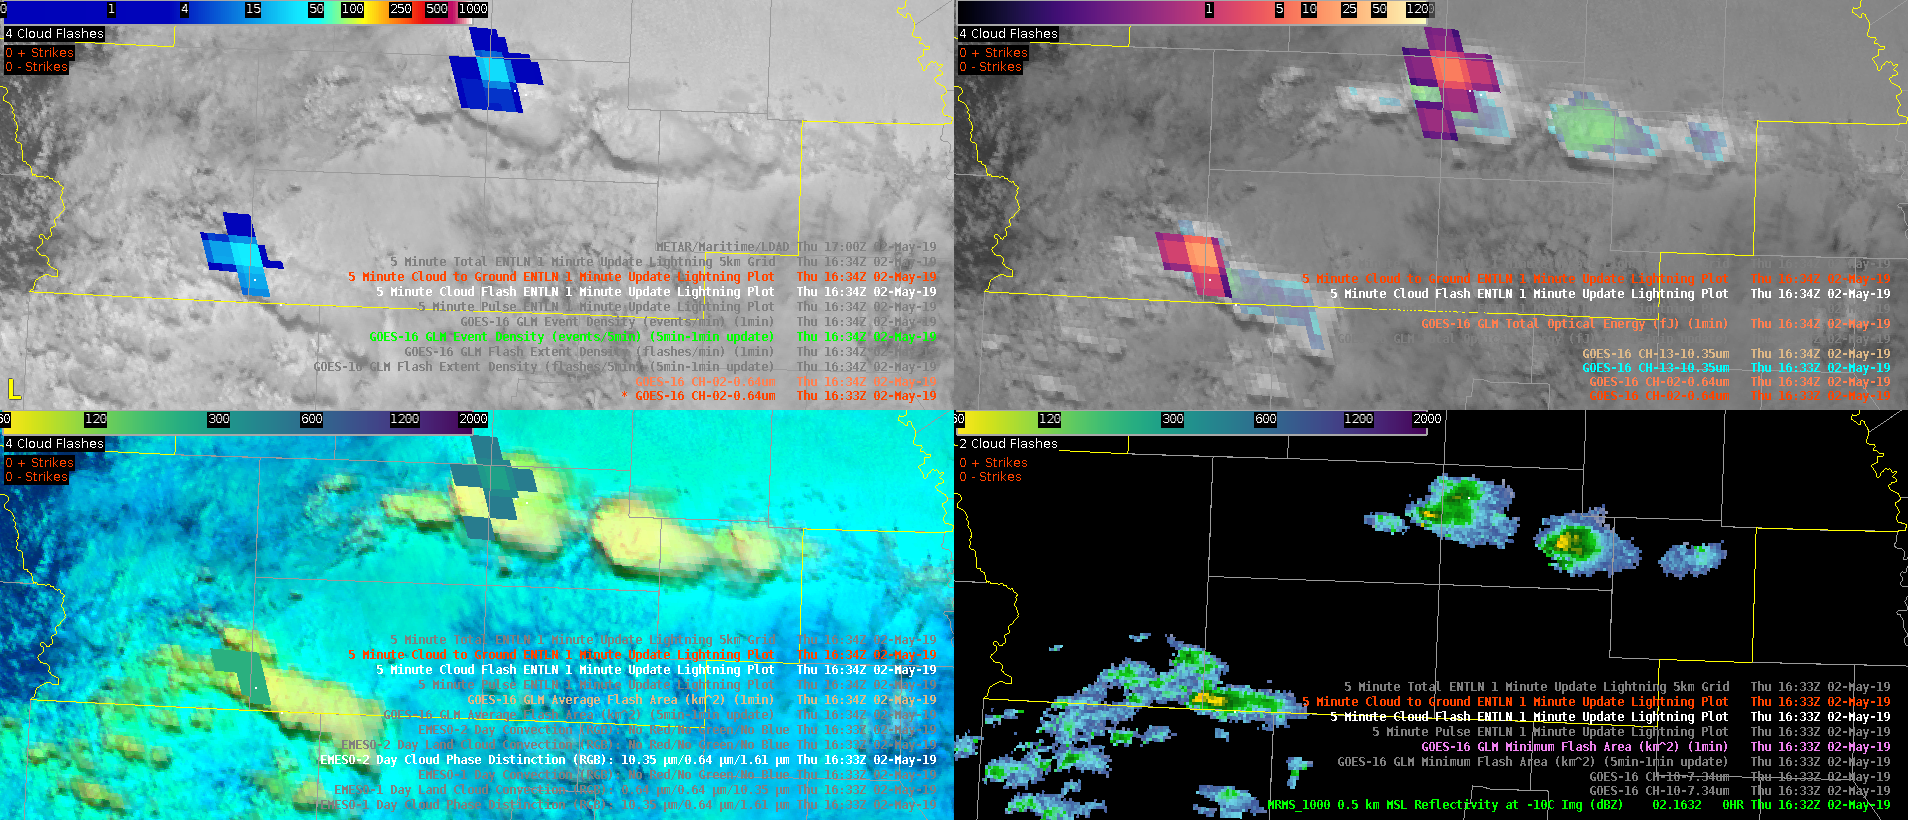
For the first time this week, finally got a chance to examine CI using GLM data. I built a 4 panel that worked well for me (ENTLN CG and cloud flashes on each panel):

top L: 1 minute visible with flash extent density (FED) and event density (ED)

top R: 1 minute Vis/IR sandwich with 1 minute total optical energy (TOE)

bottom L: 1 minute Day Cloud Phase Distinction/Day Convection RGBs with average flash area (AFA)

bottom R: MRMS -10C reflectivity with minimum flash area (MFA)
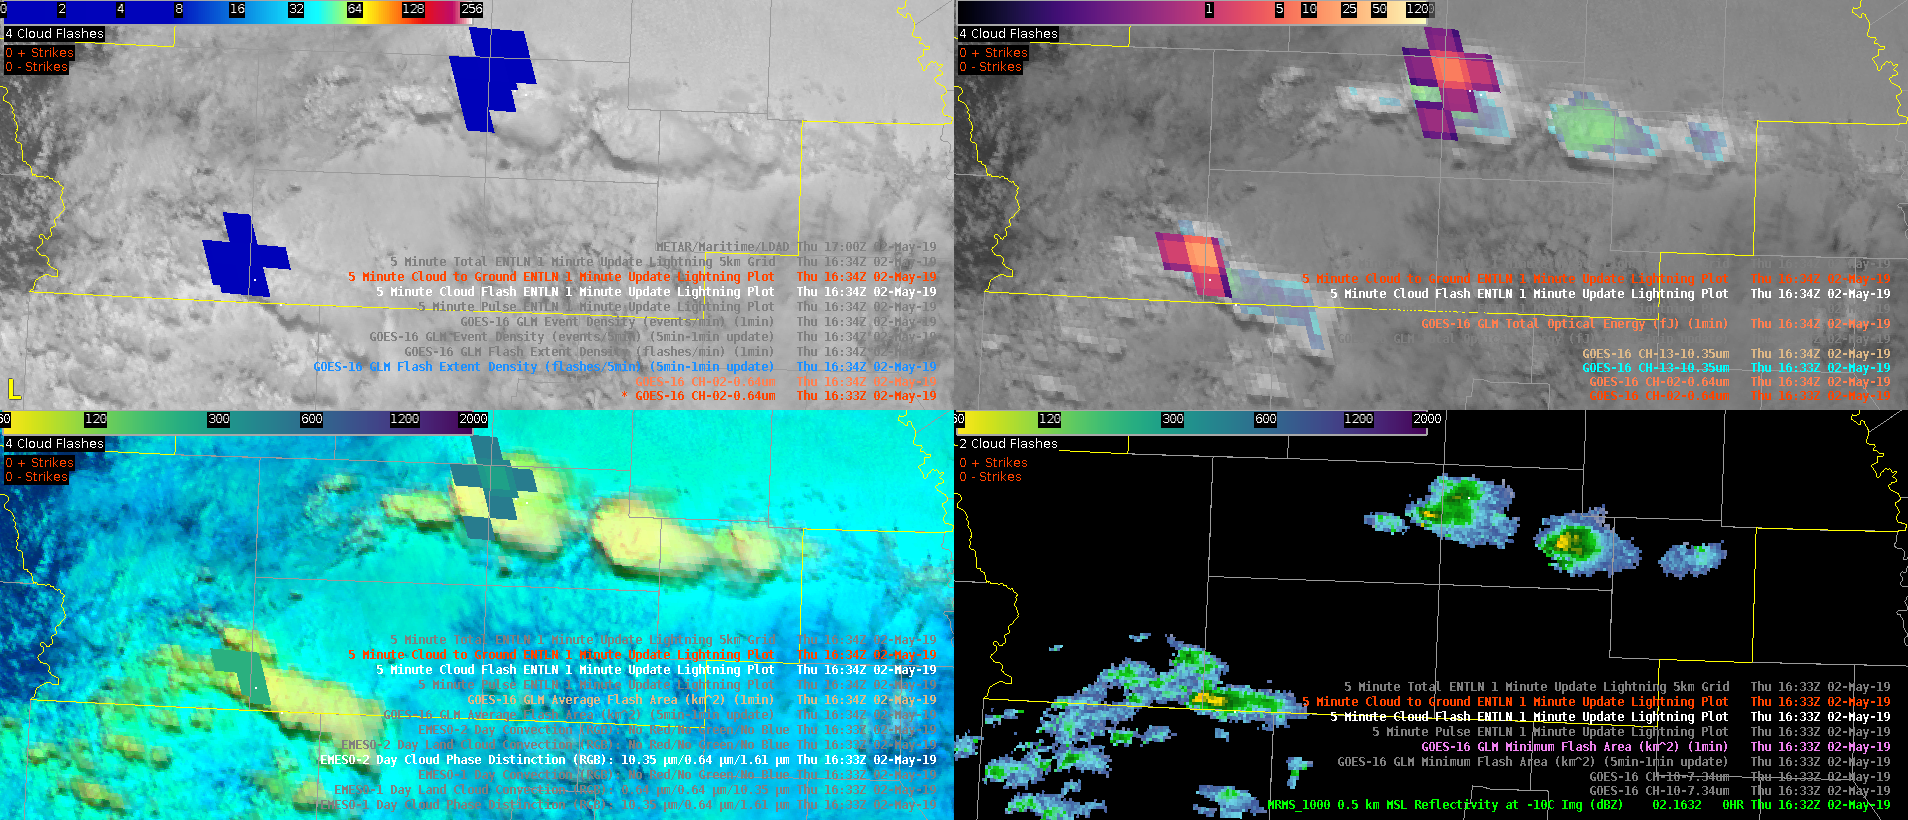
Agitated cu developed just prior to this image at 1634z. These two images highlight the differences between FED (upper L of the top image) and ED (upper L of the bottom image). You’ll notice that the flash extent density is much more muted than the event density. You can really hone in on the strongest initial convective cores with the ED and TOE compared to the FED.
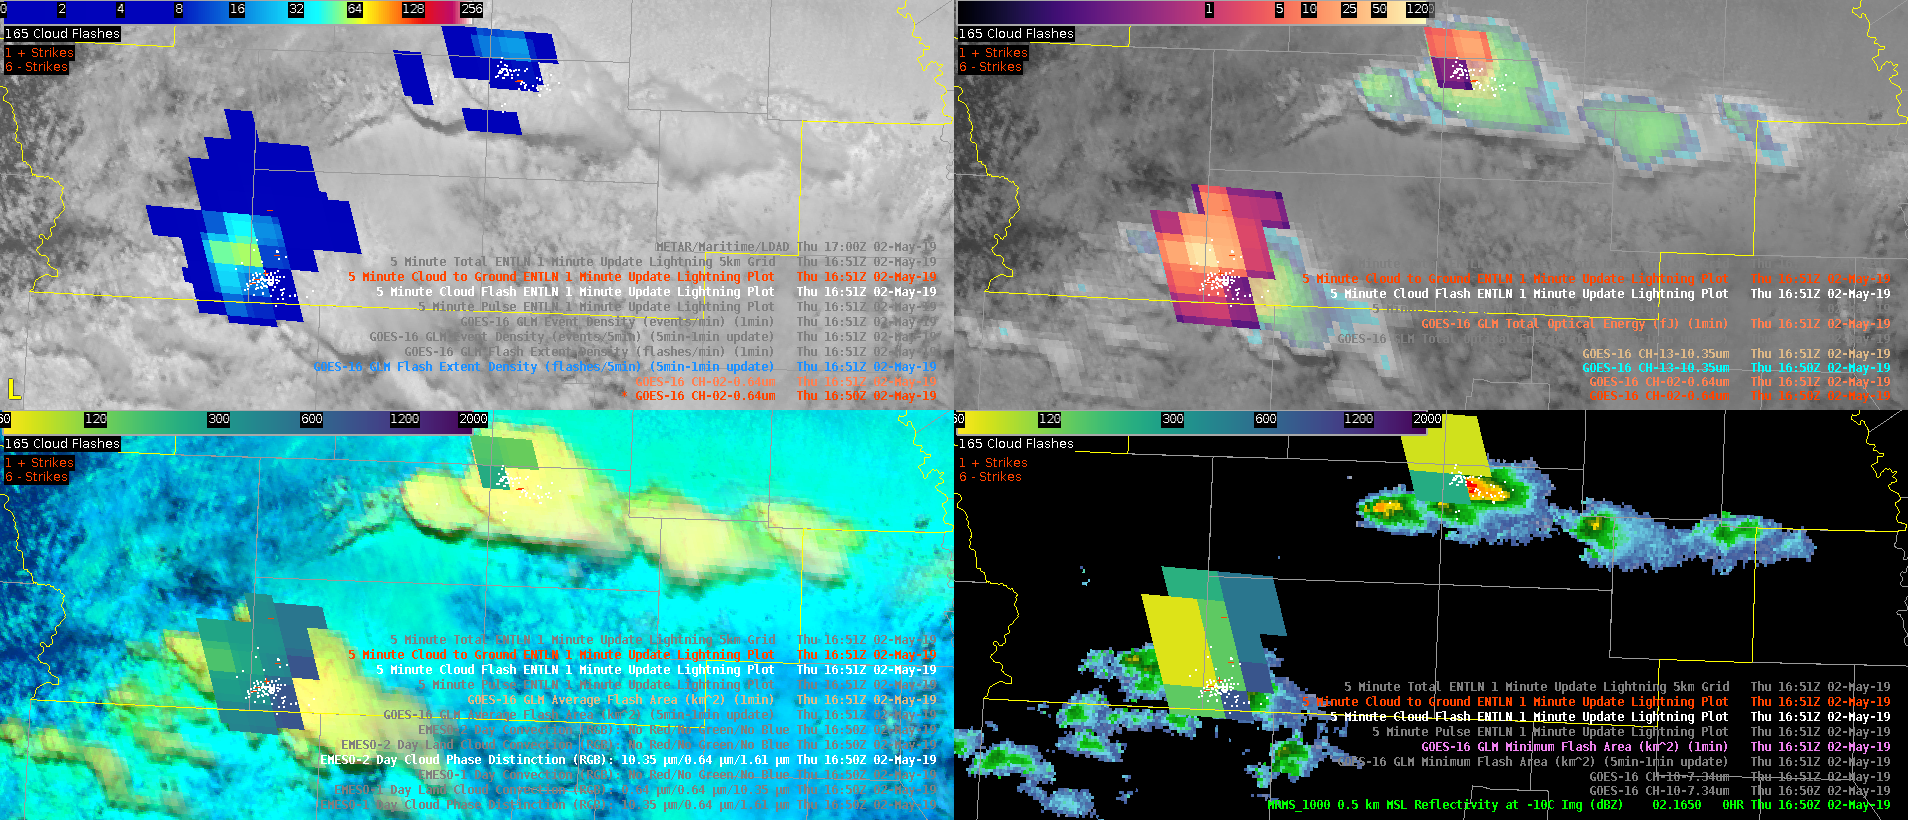
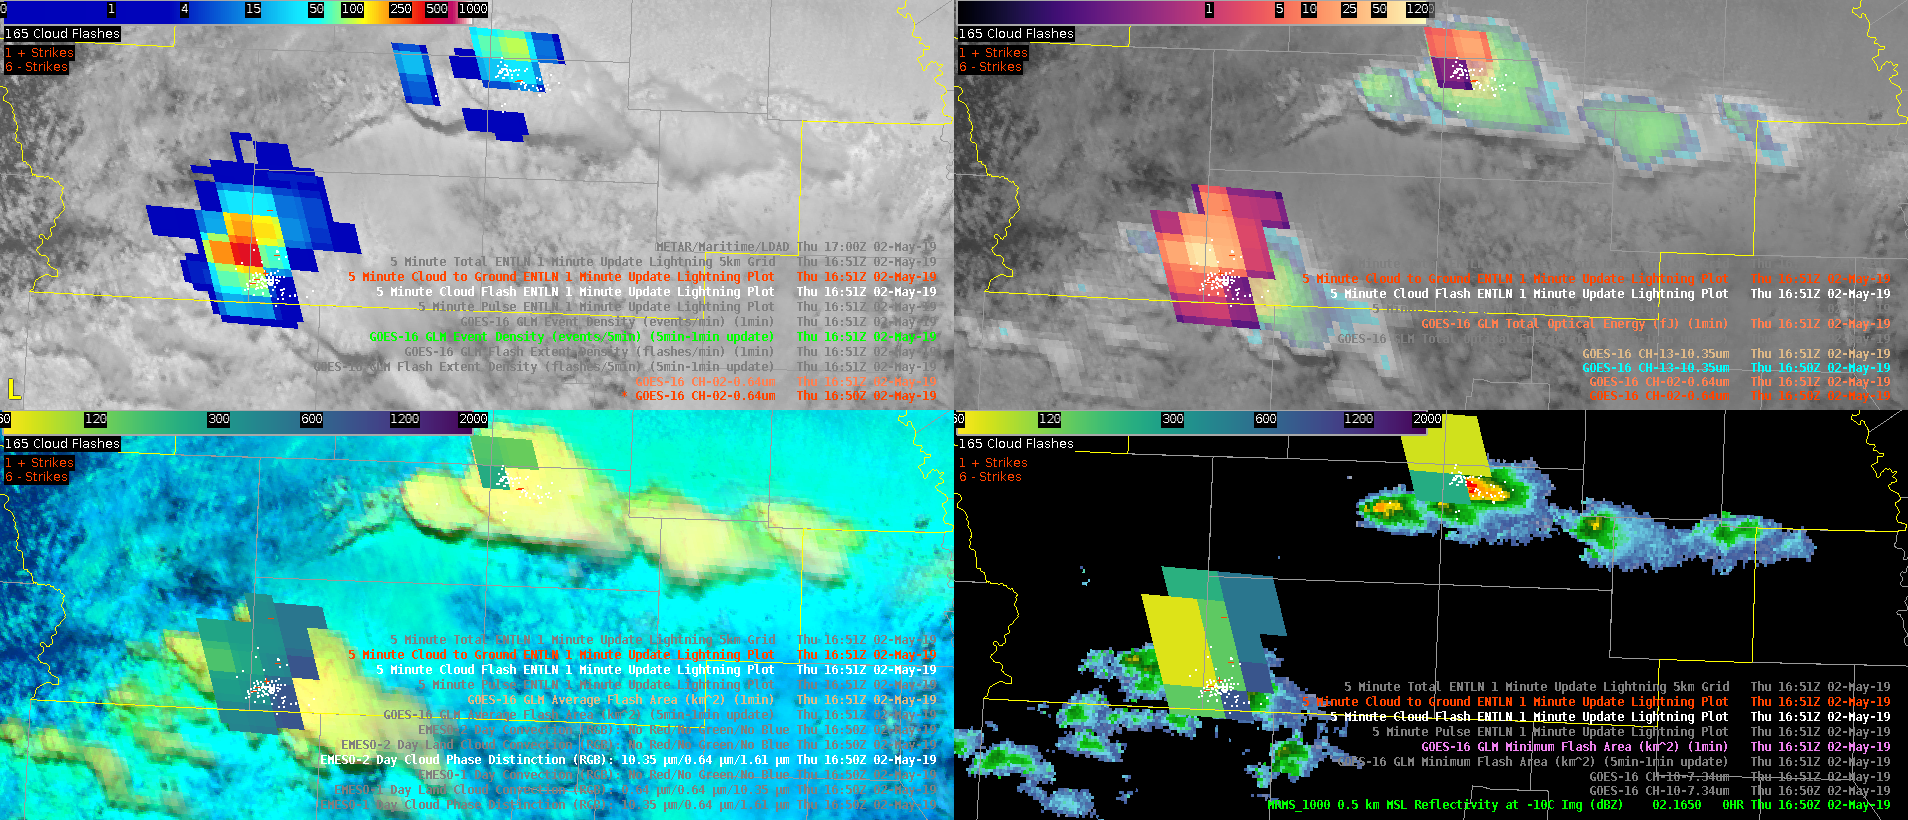
Next two images are at 1651z with FED highlighted in the top image and ED in the bottom. Again, your eye is immediately drawn to the event density vs. the flash extent density. Also, your total optical energy corroborates with high values on the southern cell (at least with respect to electrical activity…radar showed both cores with similar 50 dBZ heights).
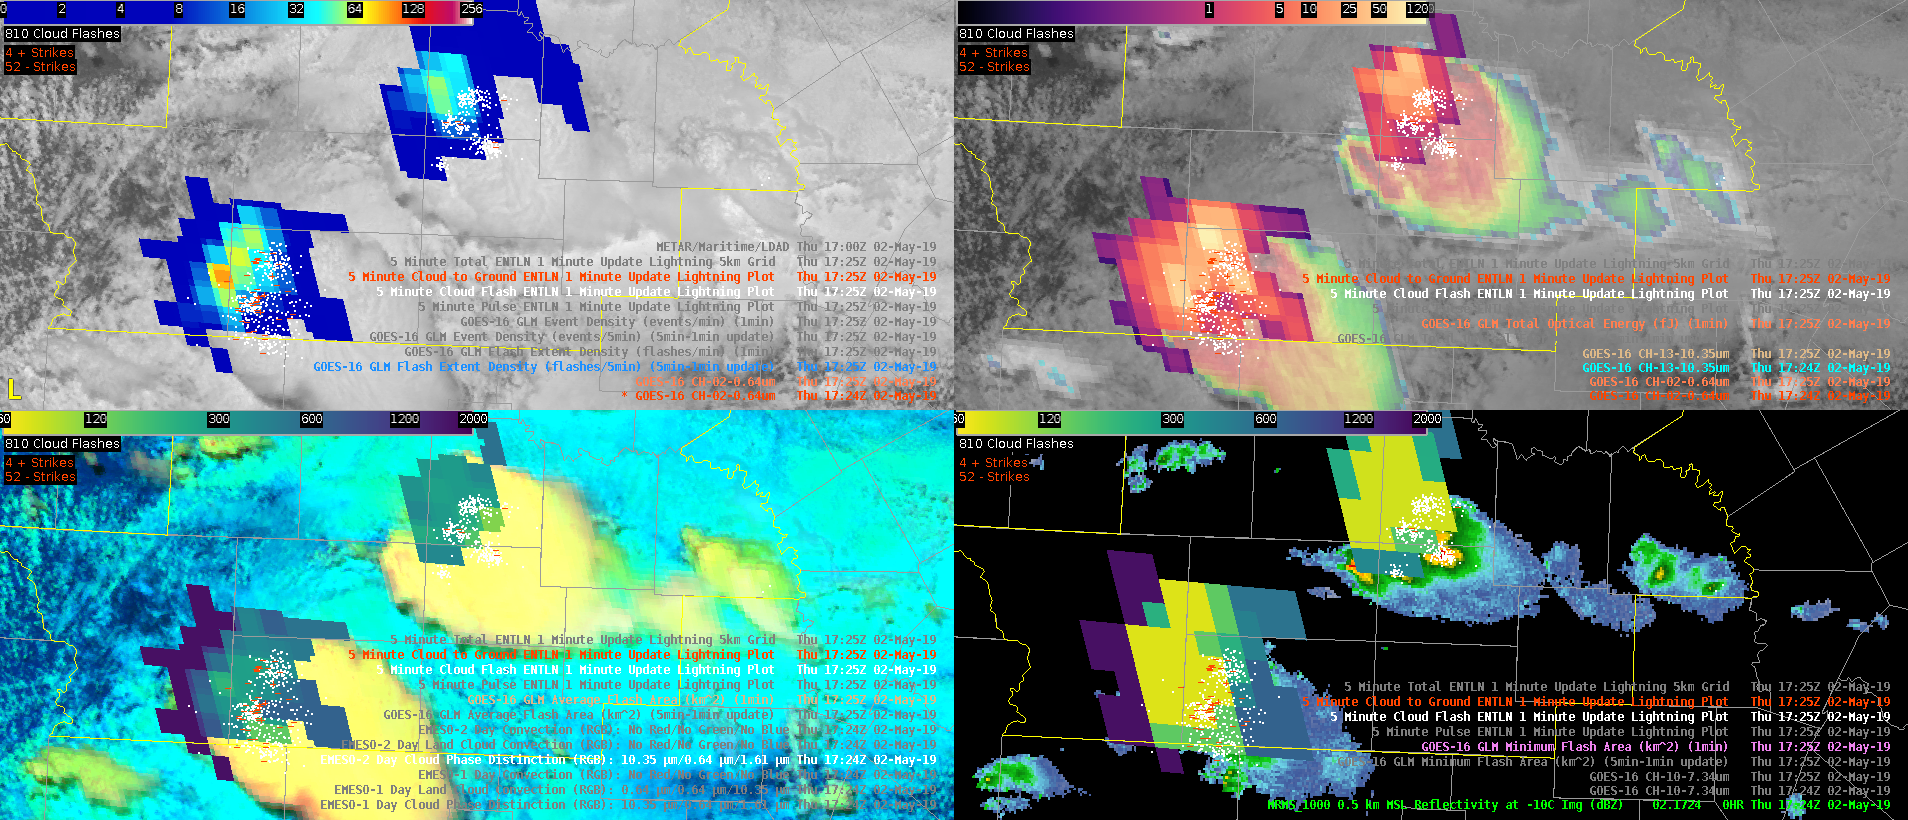
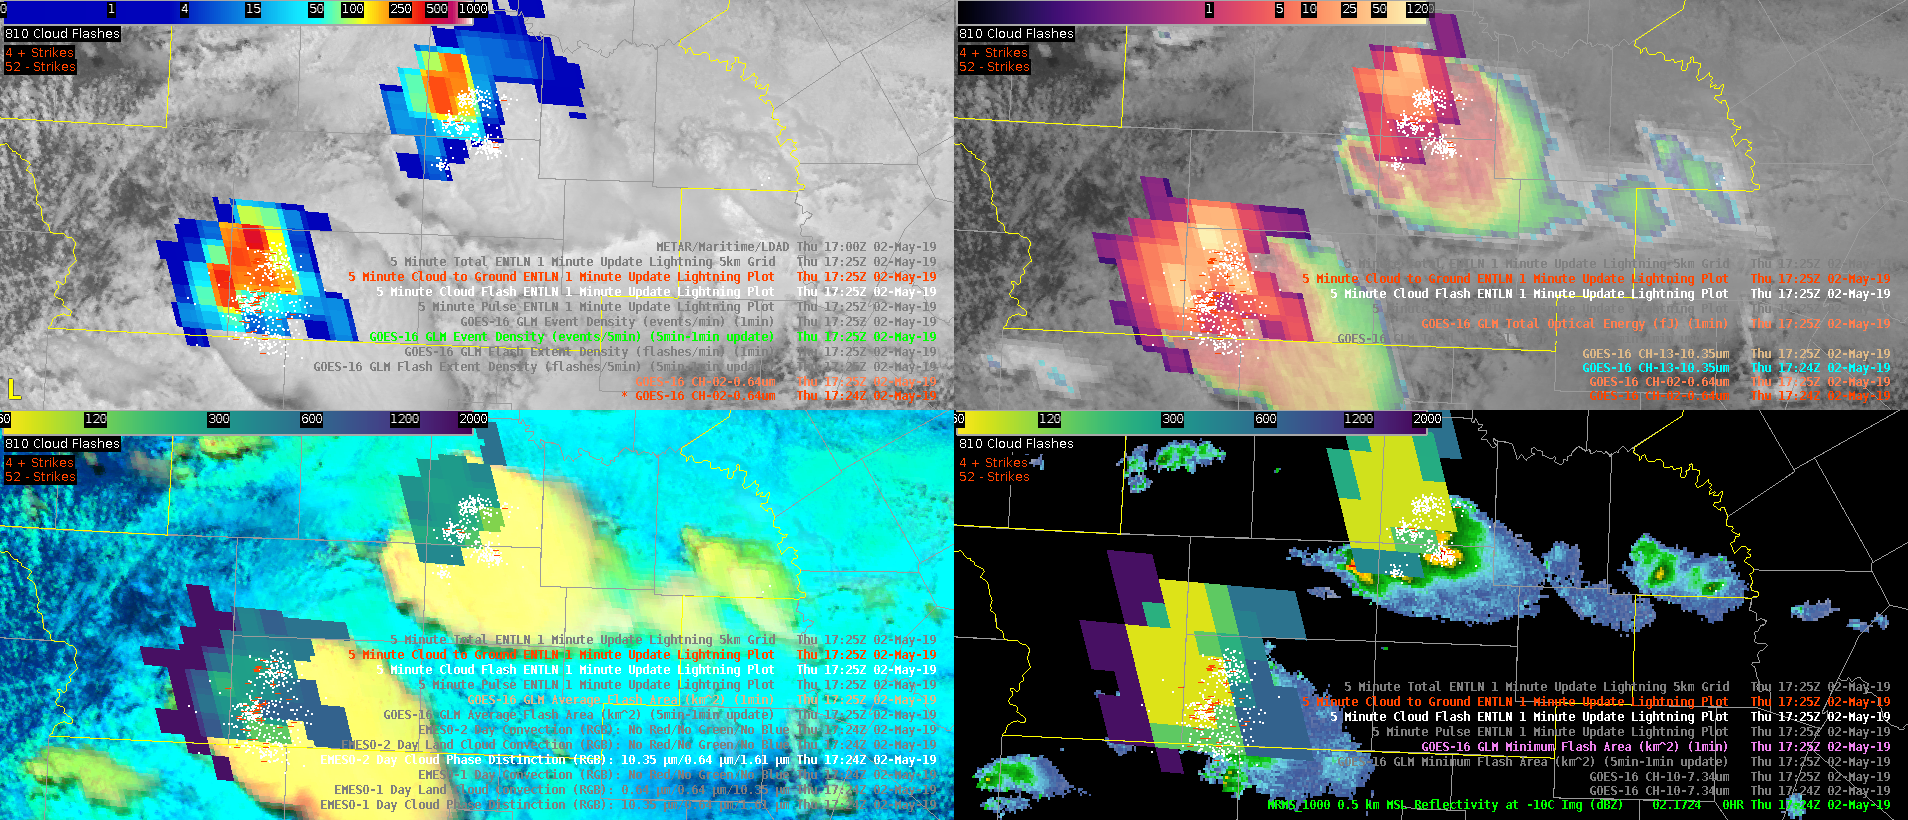
By 1725z, both event density and total optical energy are beginning to overwhelm and lose granularity. At this point, flash extent density highlights the more active cores. ED and TOE are both still useful, but the distinct advantages they showed earlier in convective evolution have degraded as convection has matured.
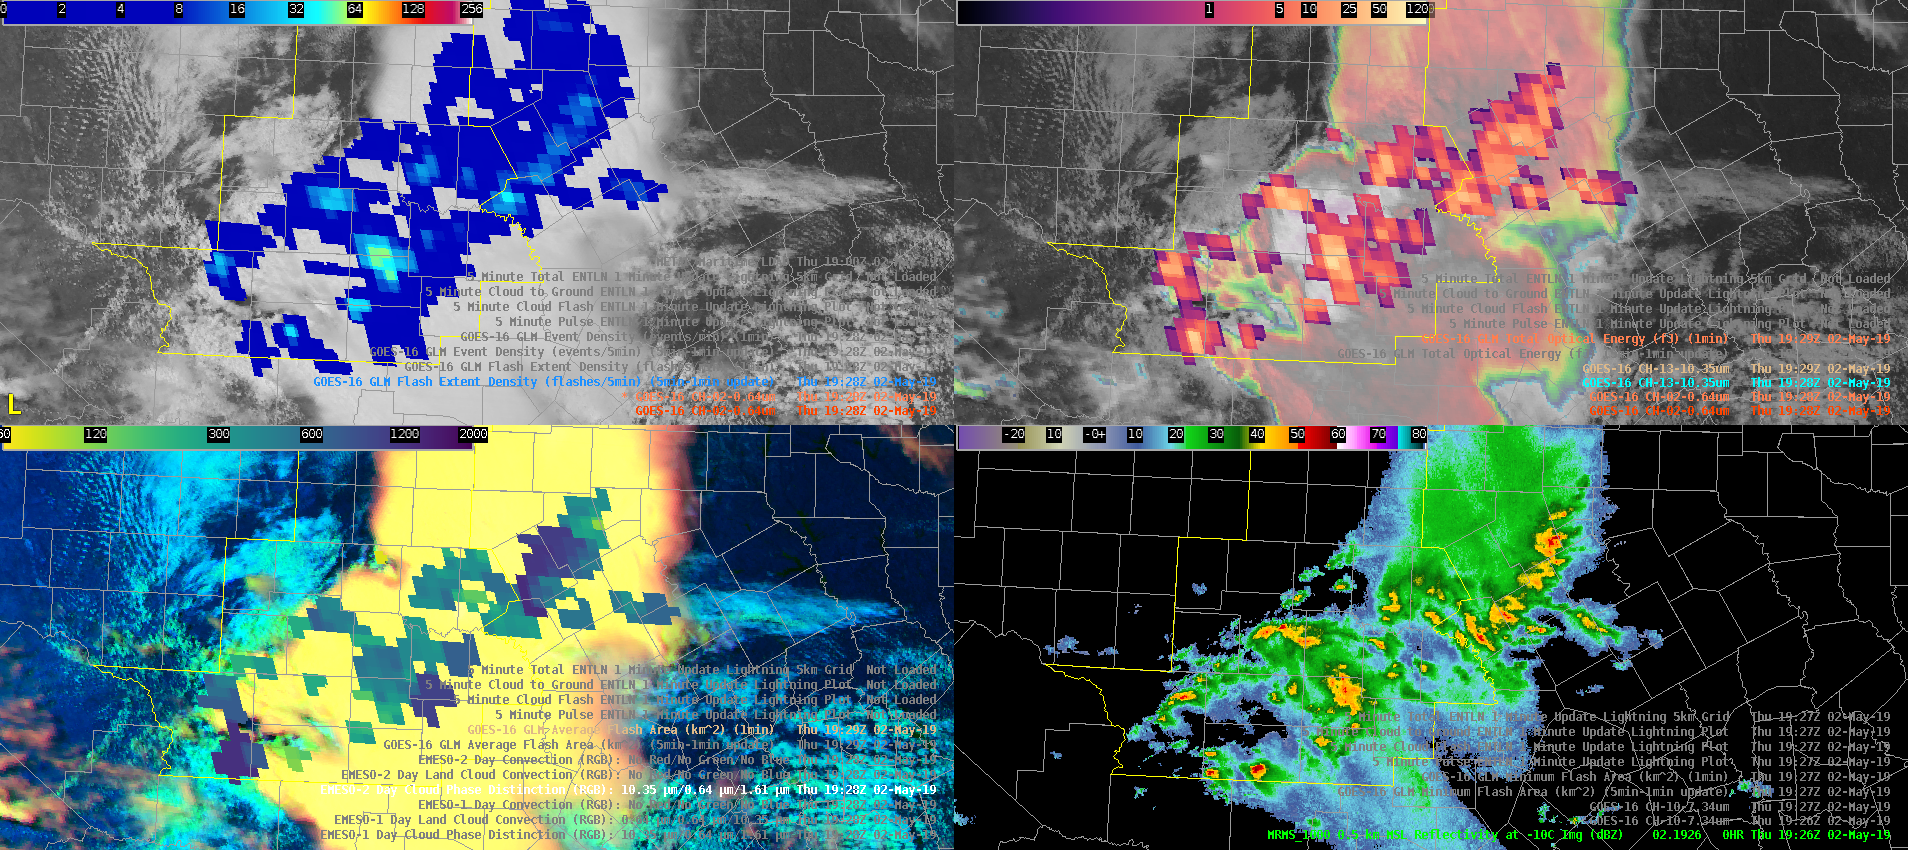
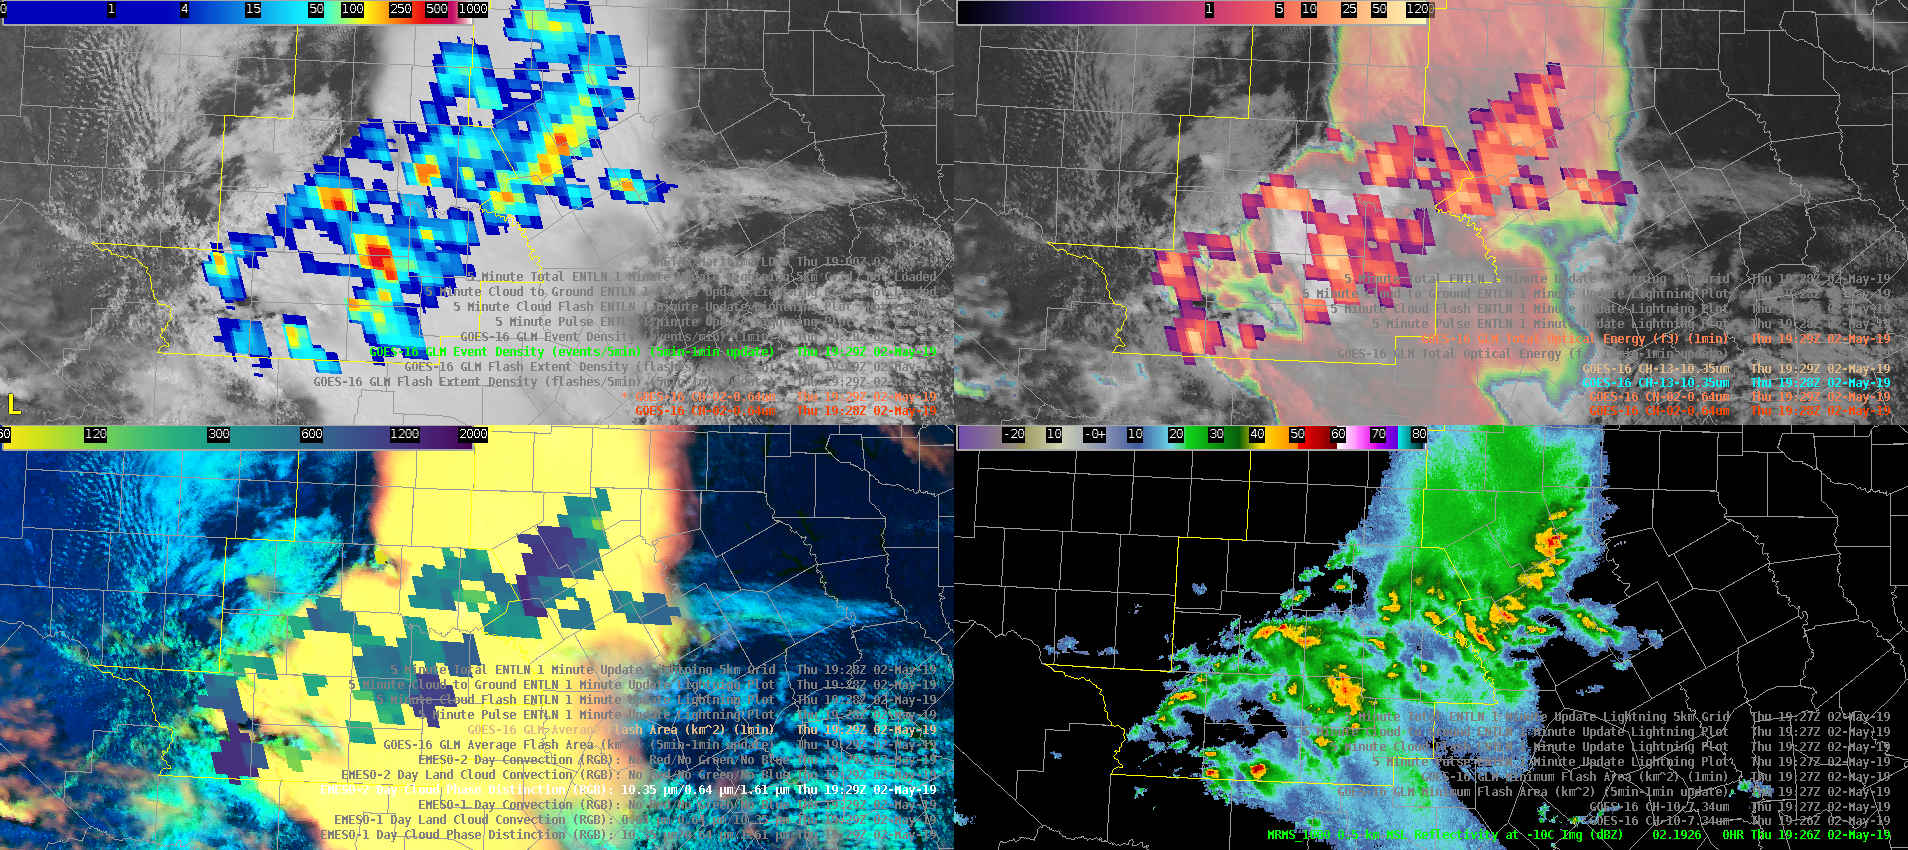
by 1929z, it’s fairly obvious that the advantage TOE had in highlighting distinct cores early is no longer. While you can see smaller areas of enhanced optical energy, it is far noisier. We’ve noticed this throughout the week that TOE’s usefulness seems to wane as convection matures and storms are extremely electrically active. Flash extent density seems to be a better choice at this point compared to event density, as was the case at 1725z.

A few of the biggest takeaways…Total optical energy (1 minute) serves a very useful purpose for CI as it can highlight areas of new updraft growth, but loses impact as storms become mature and lightning becomes well established across the area. Event density would seem to be a better choice for CI compared to flash extent density as well.

The four panel that I built I’ve found very useful for CI or subsequent new updraft development by combining the best of visible imagery, RGBs (are utilized to diagnose glaciation within clouds), and the MRMS -10C reflectivity. Time for more coffee.


–Stanley Cupp

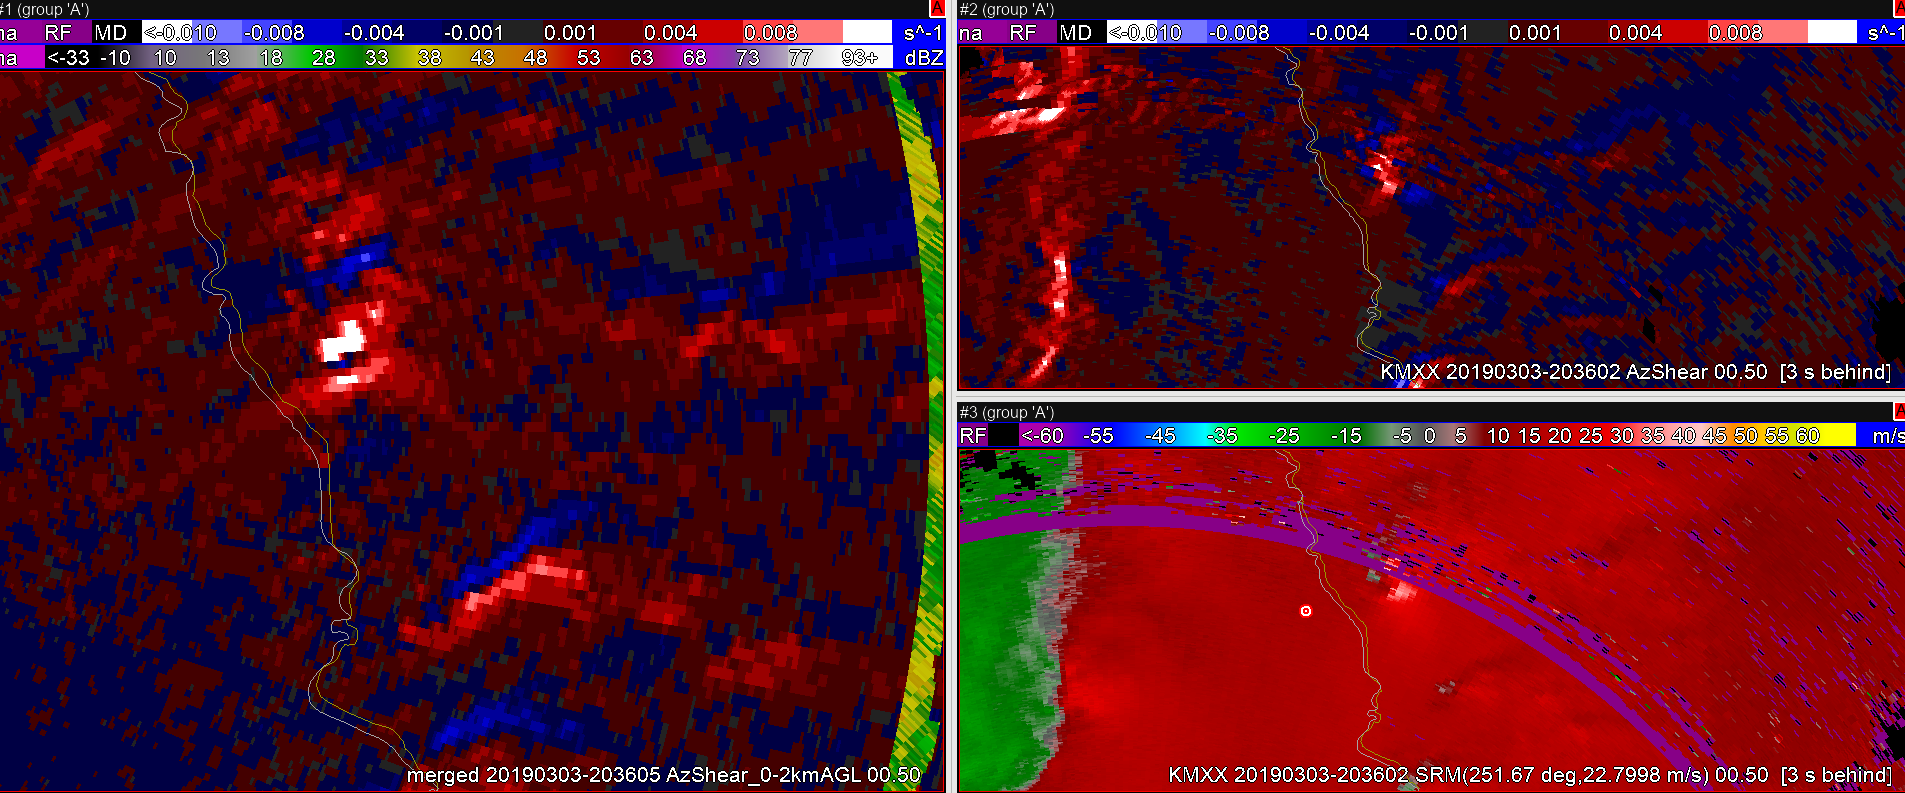
Layered AzShear troubles with Sails

Although SAILS scans are great for base data interrogation, it does cause issues with derived products such as the layered AzShear from a single radar. Here both the 0-2 and 3-6km products have previous scan data still present. This caused the AzShear feature to “split apart” while the circulation itself remained in tact. This seemed to be more of an issue with the 0-2km product but also impacted the 3-6km one.

For some forecasters this may not be a big deal at all but for others having to process in their mind what is going on with the product seemingly split a circulation for no reason can really throw them off or cause unneeded mental anguish (as minor as it may be). In a highly stressful situation such interruptions can mount up over time increasing fatigue or cause forecasters to no longer consider looking at a particular product. I have seen some even turn off SAILS by default so they don’t have to deal with the idiosyncrasies it may cause. This could reduce lead time or cause someone to miss an important feature for “convenience” sake and not for some other valid reason.

— SCoulomb

All Sky Moisture Advection

All Sky Layer PW Surface-900mb                                               All Sky 900-700mb layered PW

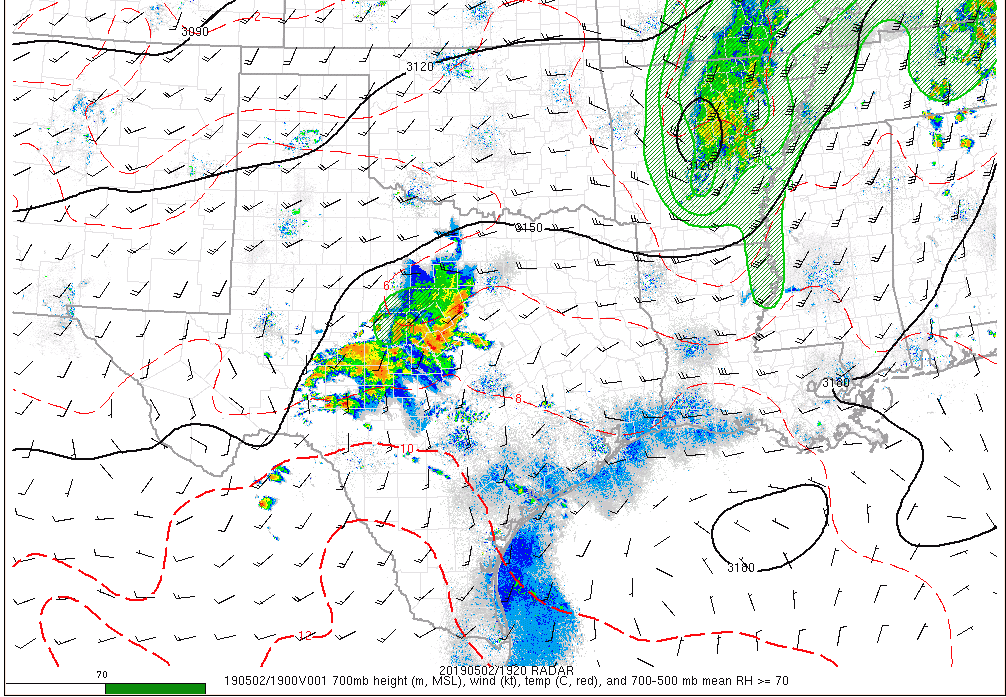
700mb analysis from SPC Mesoanalysis, shows good warm air advection across Dallas/Forth Worth CWA.  The All Sky 900-700mb layered PW product shows good west to east moisture gradient across the central part of the CWA associated with the 700mb warm air advection signal.  -Jake Johnson

GLM comparison for Line of thunderstorms

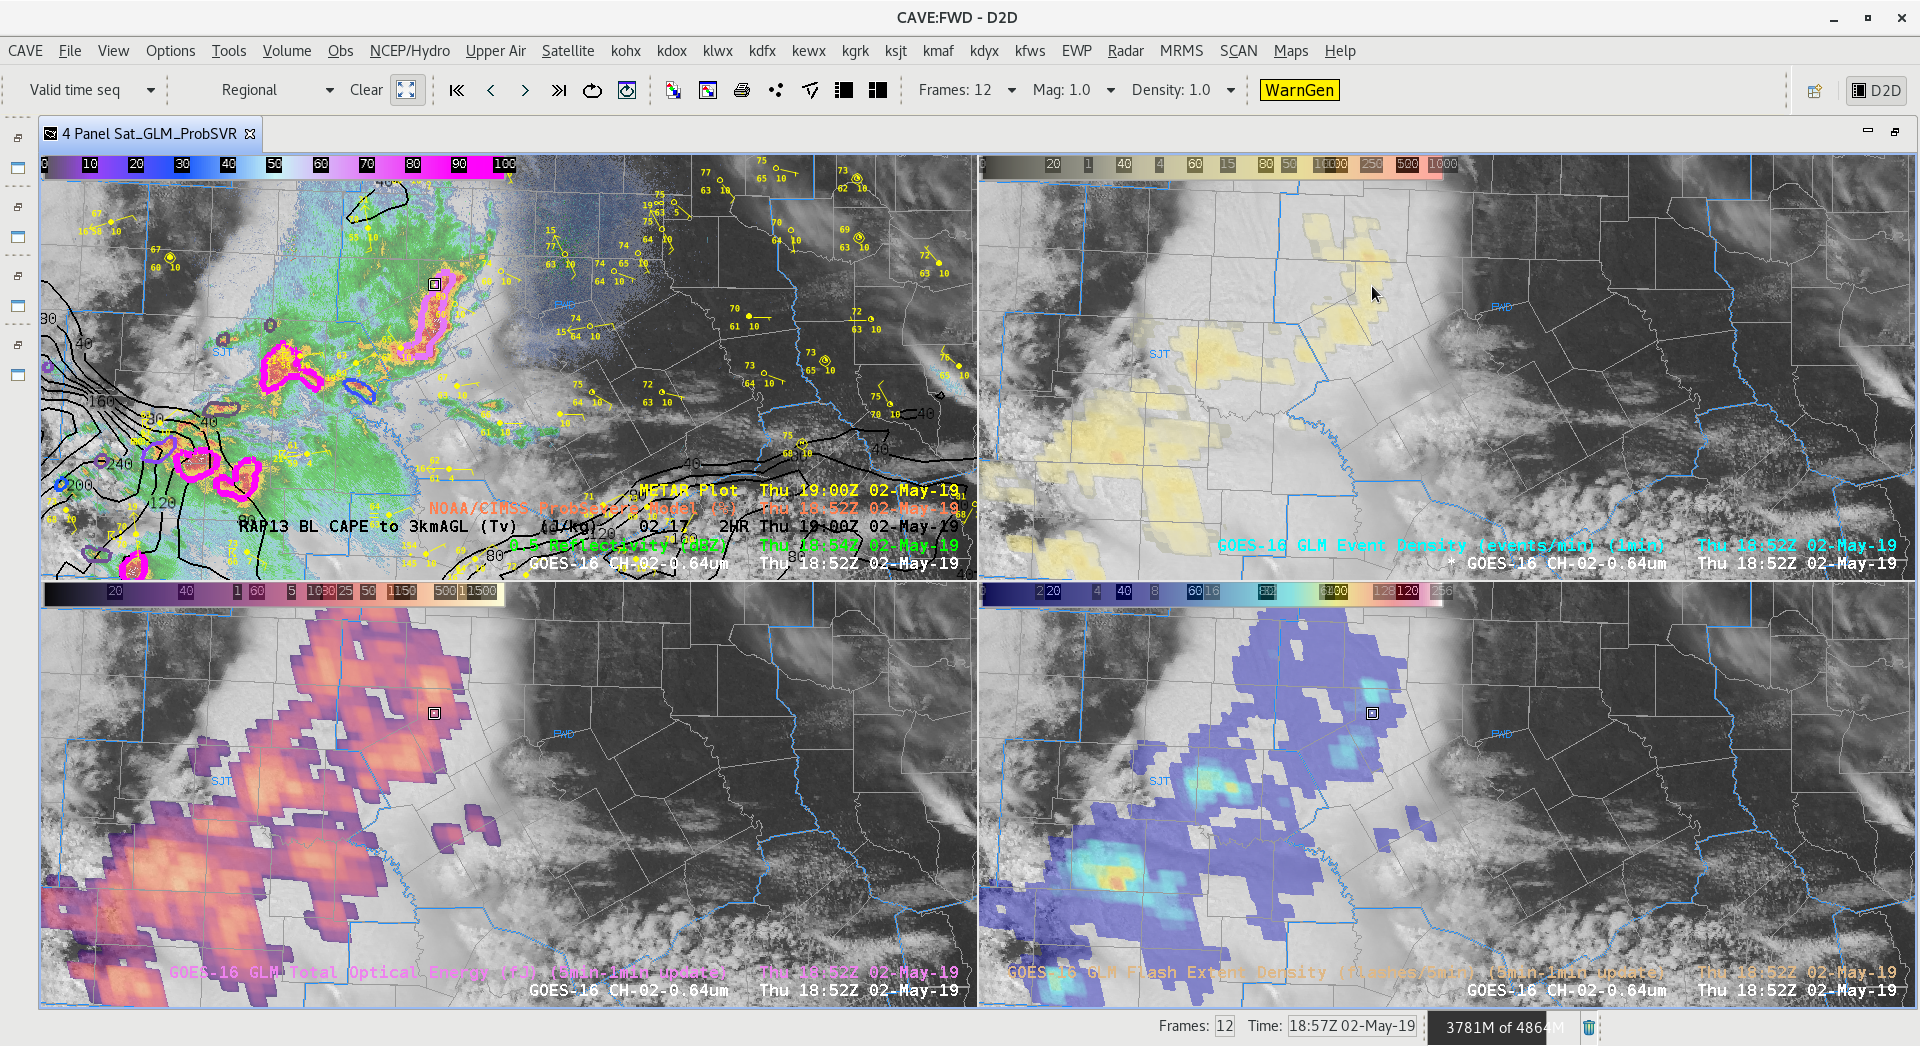
A linear storm was moving east across western FWS CWA producing 1″ size hail.  Look at the cursor location, GLM Flash Extent Density and Event Density products were highlighting the most intense part of the storm better the GLM TOE product.  The GLM Total Optical Energy is preferred for initial storm development.  When thunderstorms become mature its best to use the GLM Flash Extent Density or GLM Event Density product to compare storms in the mature phase.  -Jake Johnson

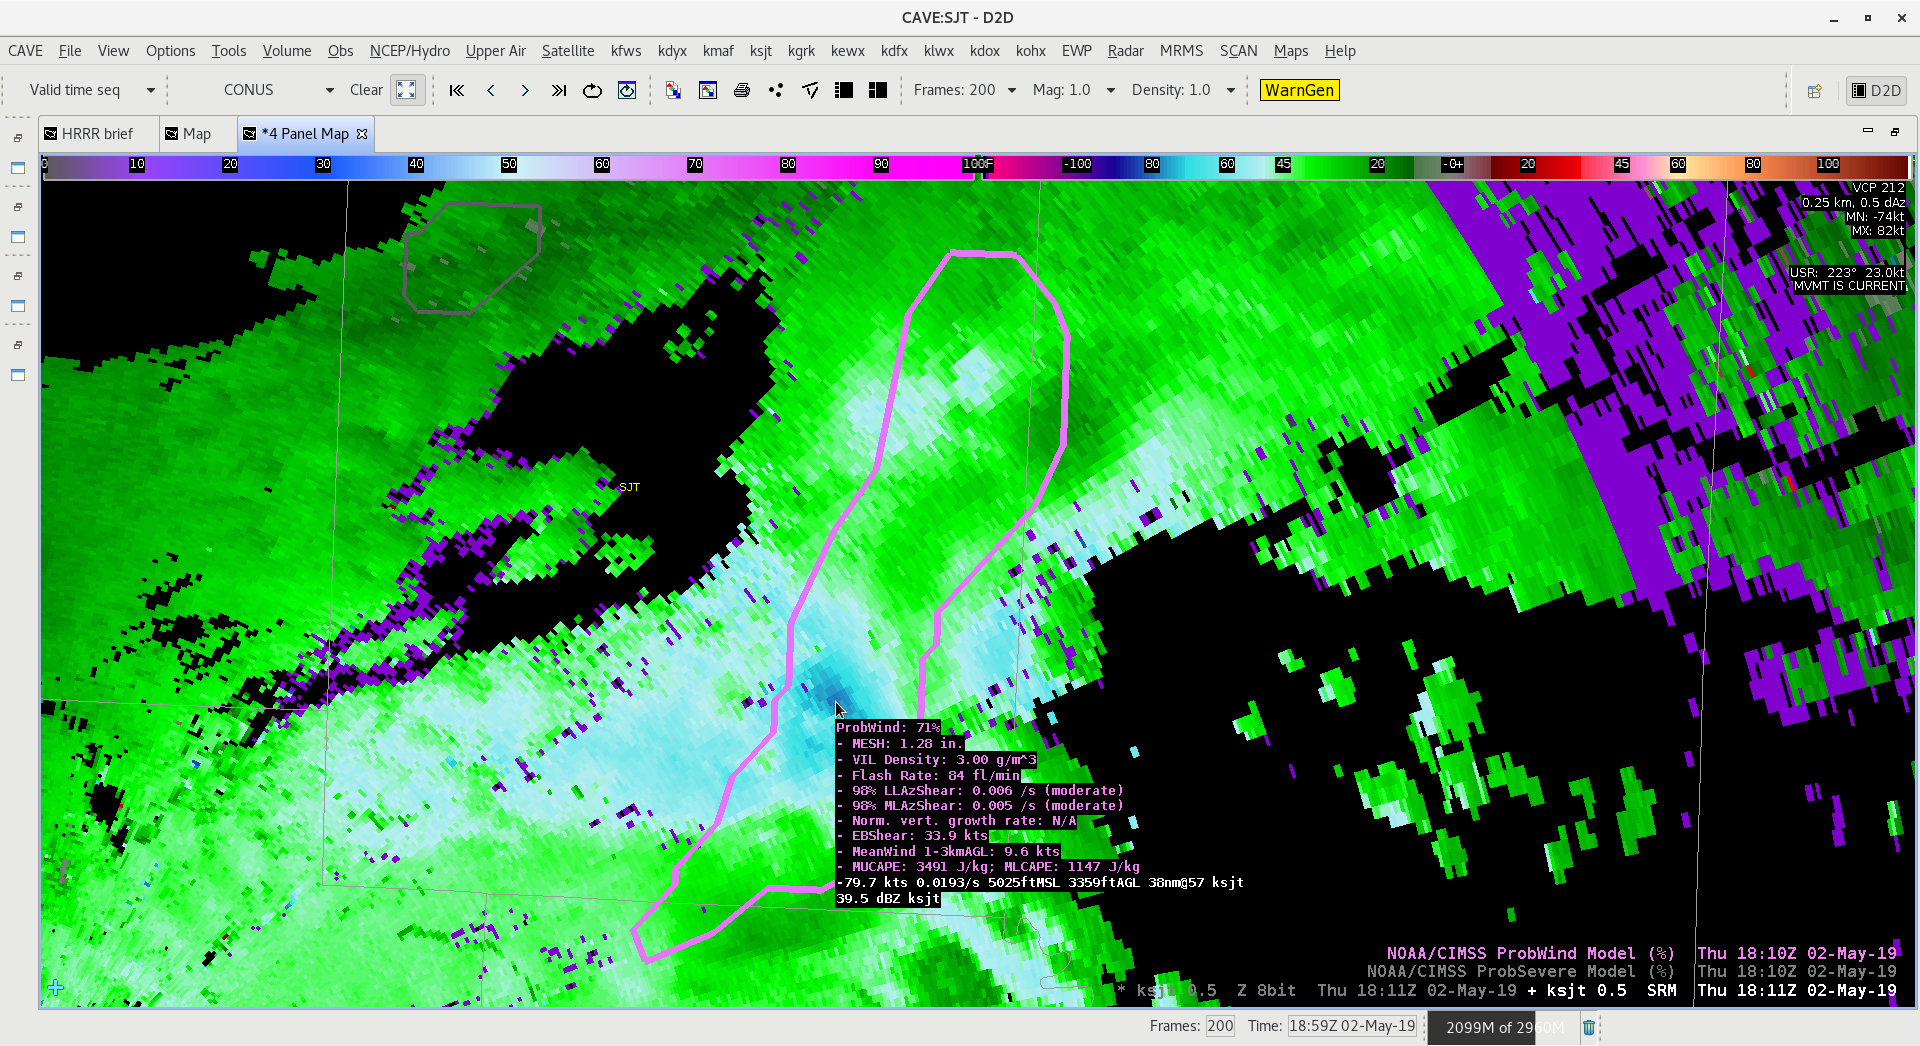
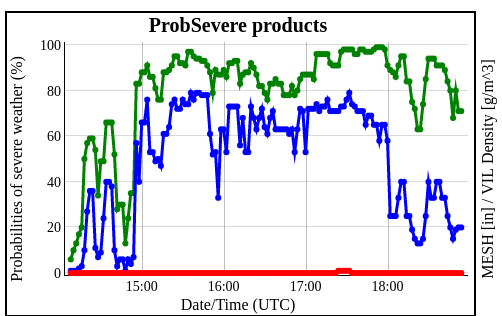
Prob wind – two cases with unexpected results.

Here are two cases where ProbWind produced surprising results. In the case above, a very strong wind signature descended from a linear storm segment. BV data near 80 knots in the lower 3 scans, however ProbWind was only at 71%. I would have likely issued a warning here without ProbWind, however the ProbWind data made me question mid-level winds within the thunderstorm complex.
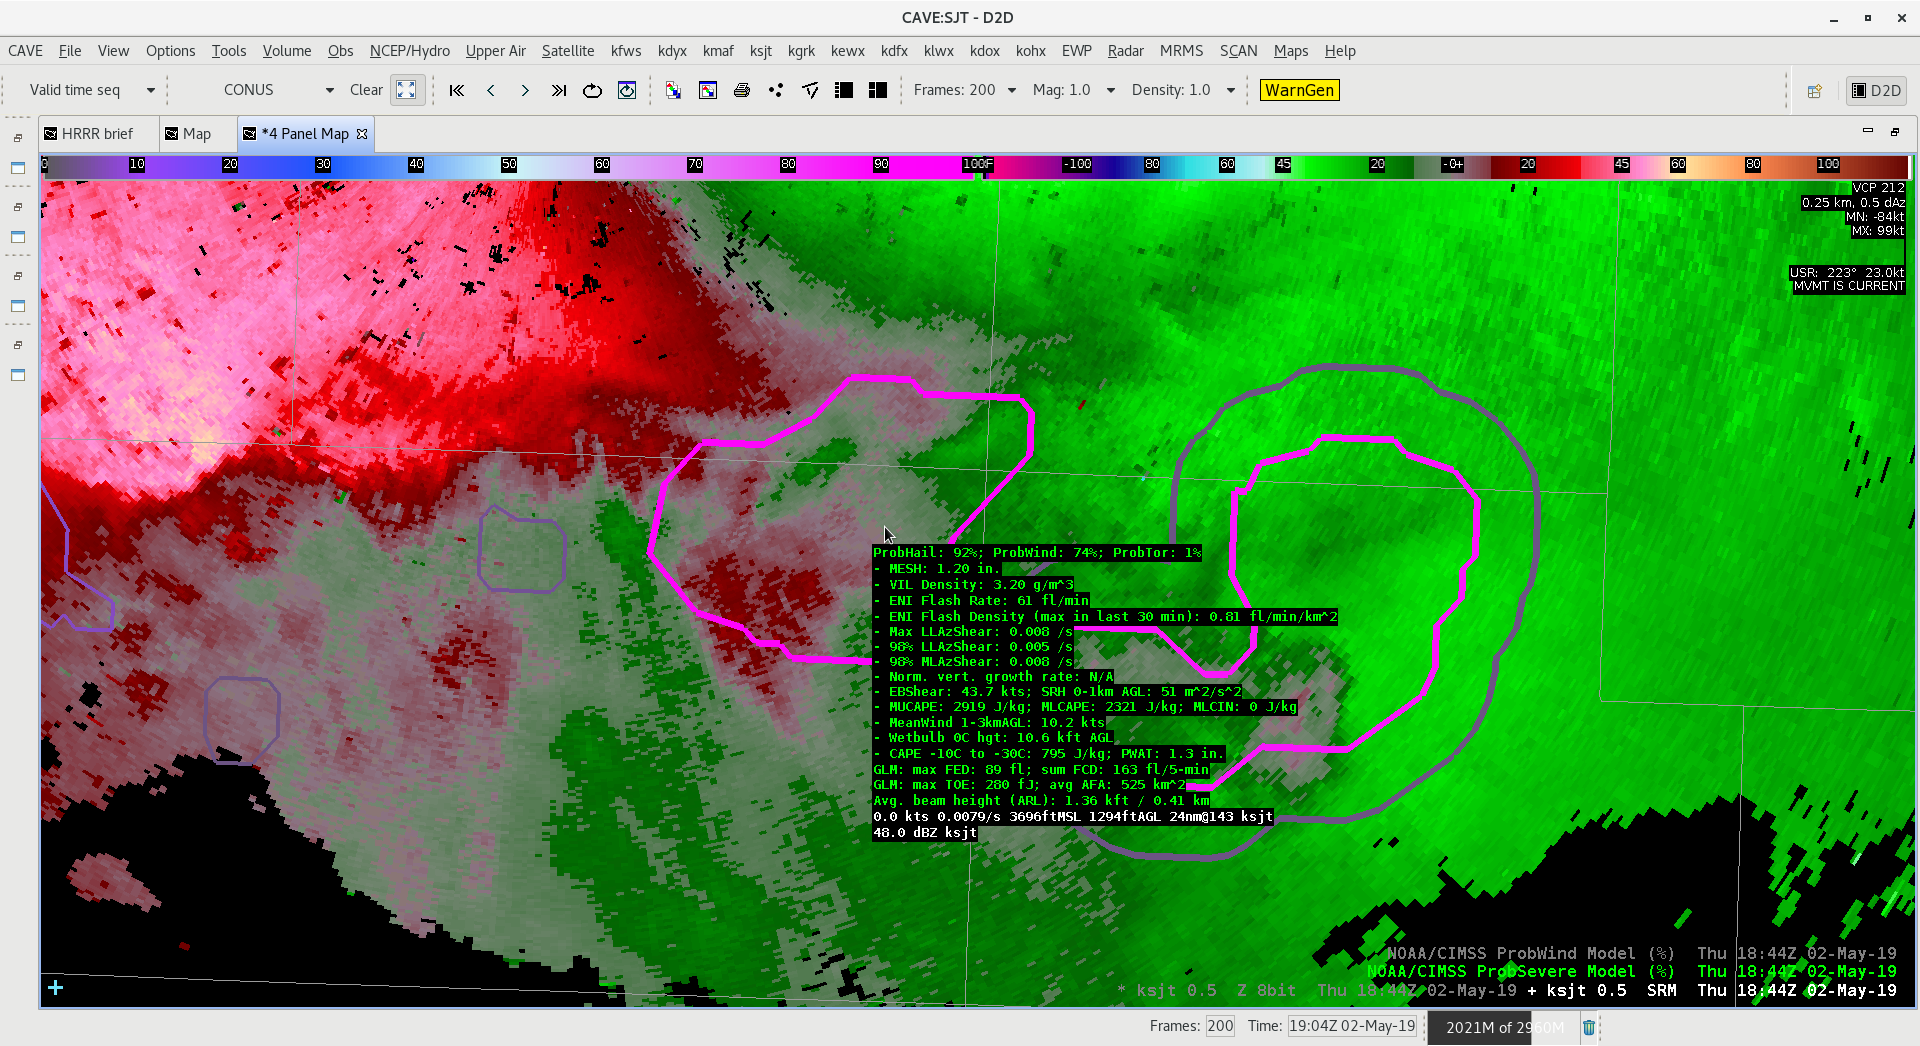
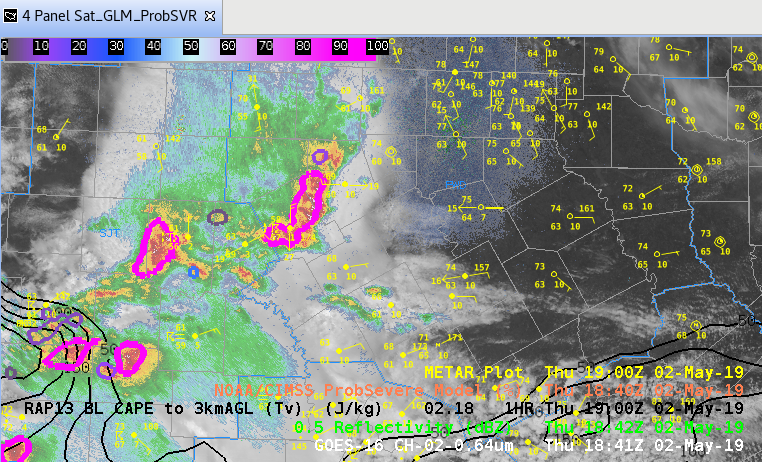
In this case, a storm well behind the main outflow is identified. Prob wind is slightly higher here, at 74%, however the storm had no signs of imminent high wind in any of the lower tilt data. This case may have been a result of stronger mid level winds aloft affecting the prob output.


-Dusty Davis

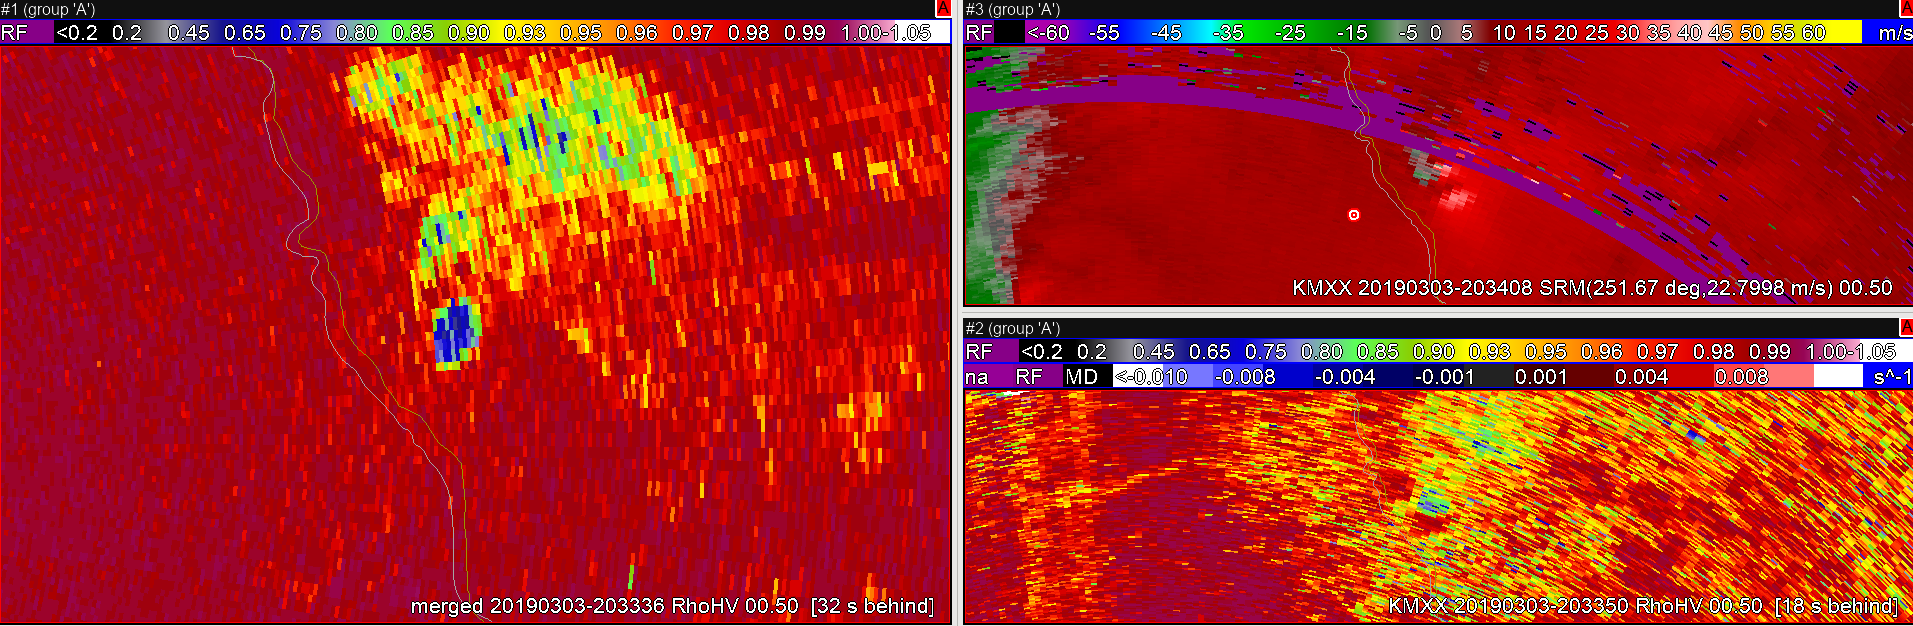
The merged CC product provided good continuity with the TDS when the single radar CC temporarily lost the signal. This can be important for messaging or confidence in TDS appearance for product updates.

— SCoulomb

Azimuthal Shear Application to Velocity Couplet?

An application of AZ-Shear that may show some promise is that it seems to hint at storms/areas which may develop into a velocity couplet. In this example you can see that high Azimuthal Shear values are beginning to be detected by the program, while very little response stand out in the velocity field.

Using Az-Shear to hint at the development of a couplet. (Watch the small red marker near the Alabama-Georgia border.)

Notice how a few minutes later a velocity couplet is beginning to form, when only a few minutes prior AZ Shear was the only indicator. If this becomes is a trend that develops, it might be able to increase warning times on tornadoes.

A few minutes later a velocity couplet is beginning to take shape

South Beach

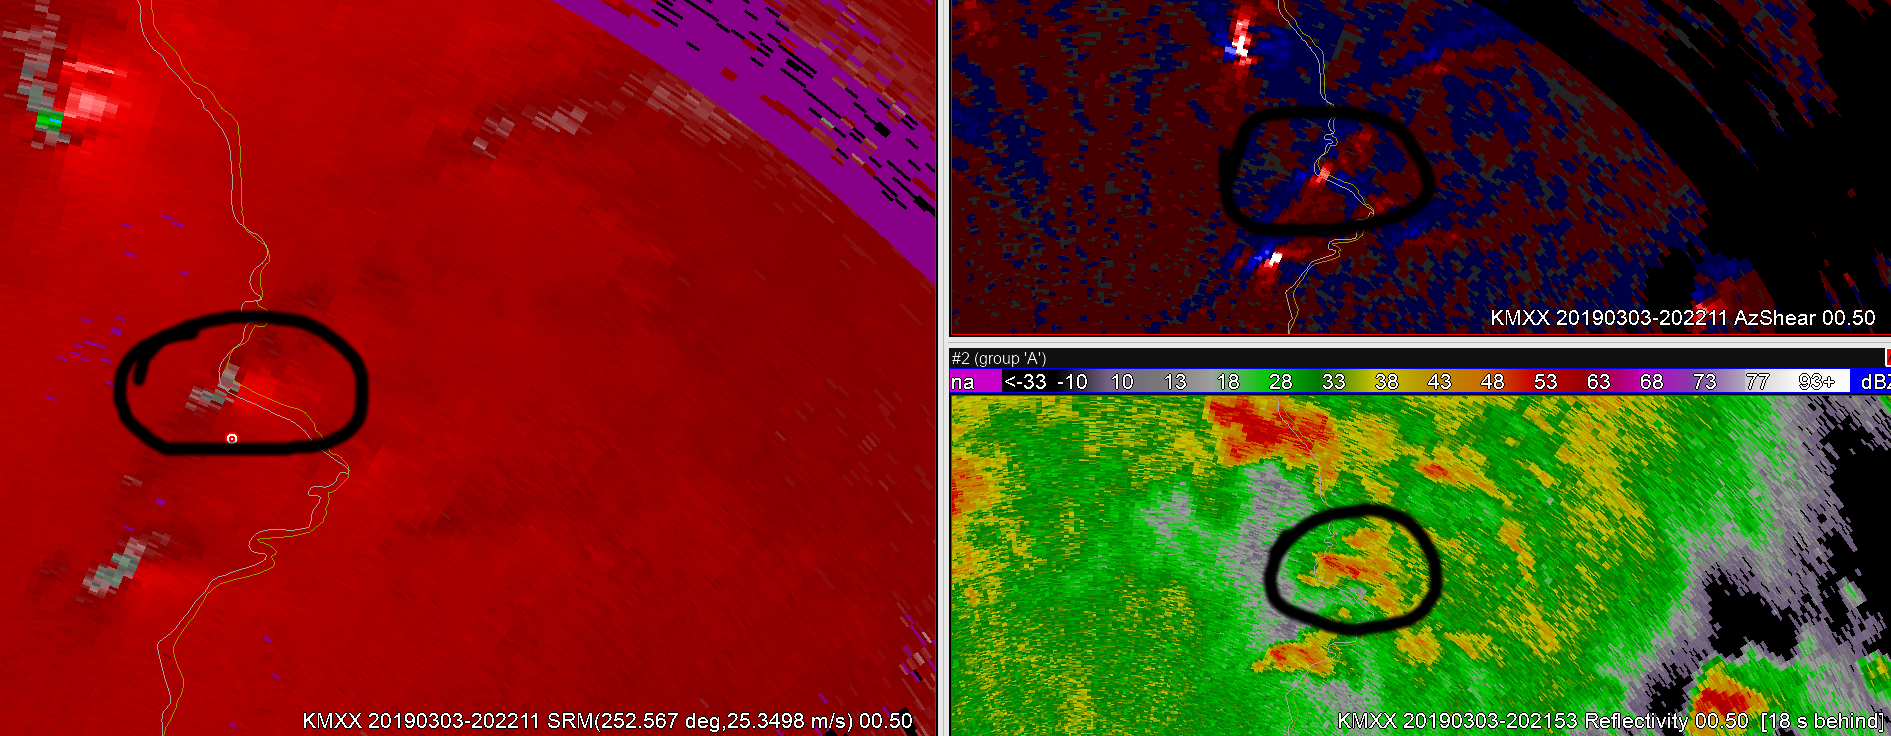
Merged AzShear for the win!


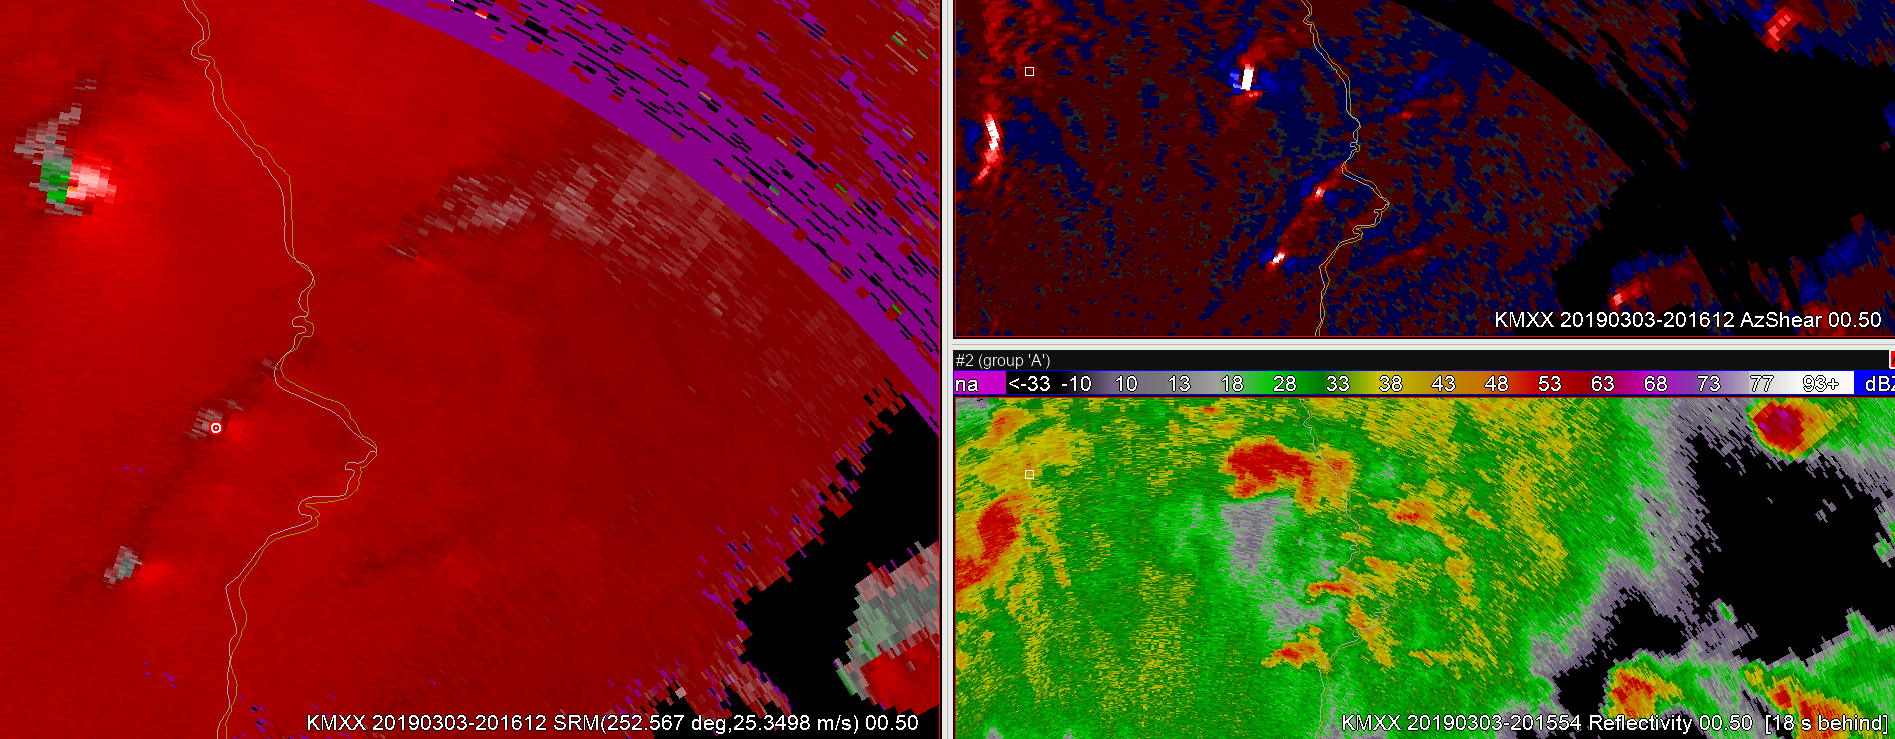
As the circulation moved into the Range Folded area on KMXX, the merged product was available to continue to track the strength/position of it. Even though the merged product showed multiple circulations on previous scans it was still possible to track the shear values through the time the storm of interest was in the Range Folded area which would help with messaging or product updates.

— SCoulomb