NEW NUCAPS

NUCAPS offer a way to get a vertical profile of the atmosphere across the US. However, in areas where soundings were not “retrievable” it can leave many of the products with large holes in them.
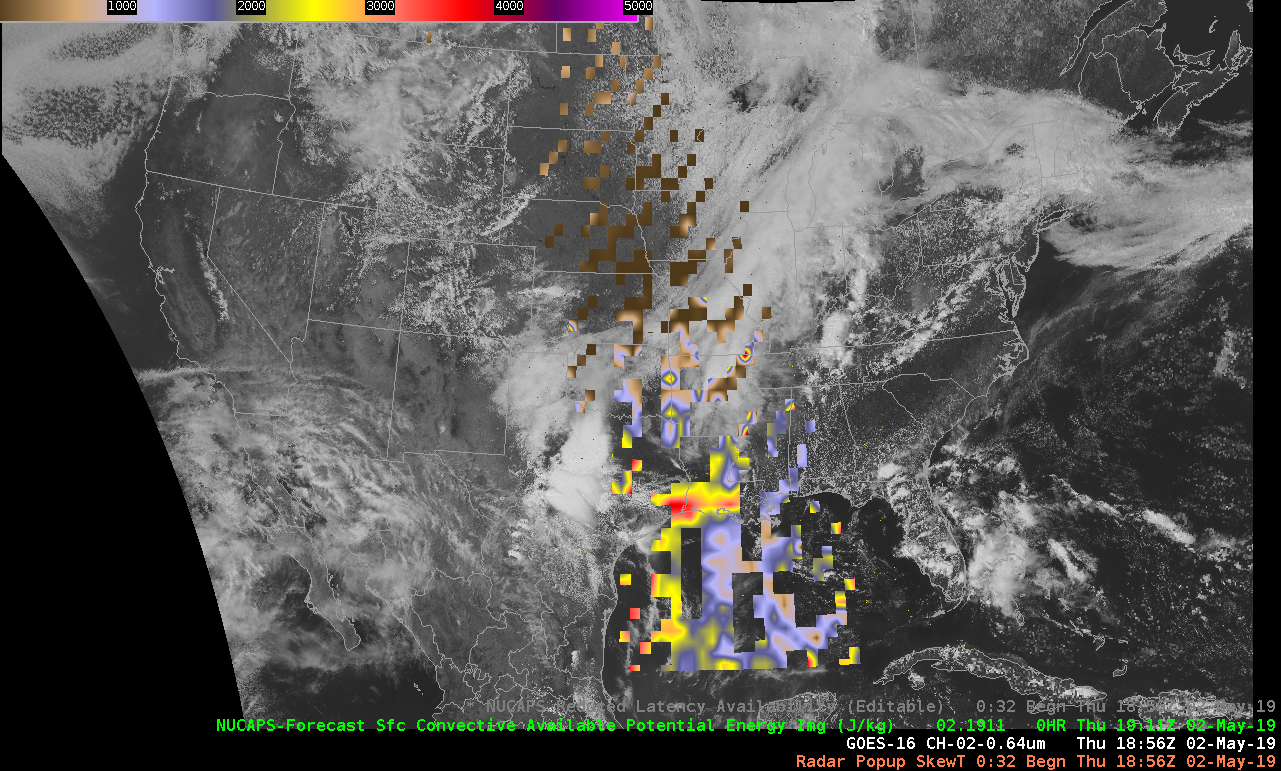
Default Output From NUCAPS on w/ vis satellite

A great application would be some type of algorithm that fills in the “data holes” Two ways to approch this would be:

  1.  Linear interpolation between the grids
  2. Use a model such as the RAP to fill in the gaps
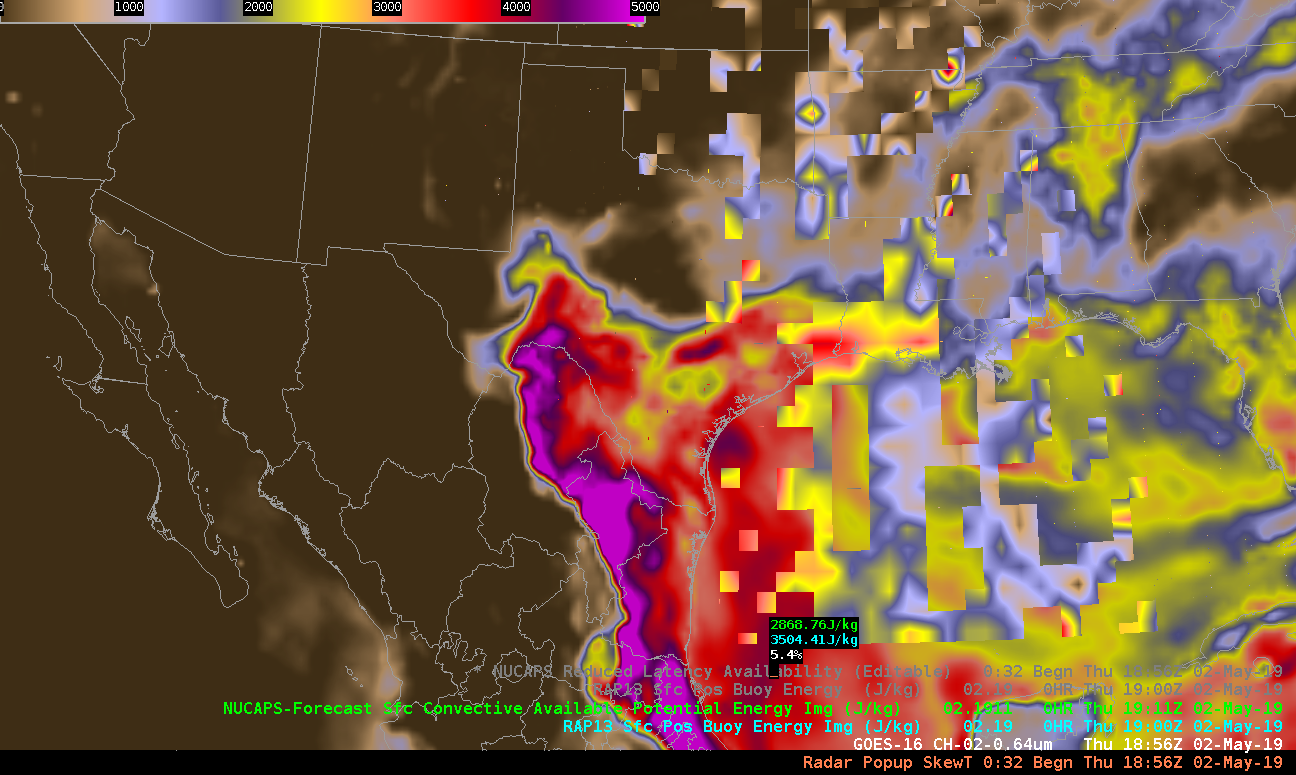
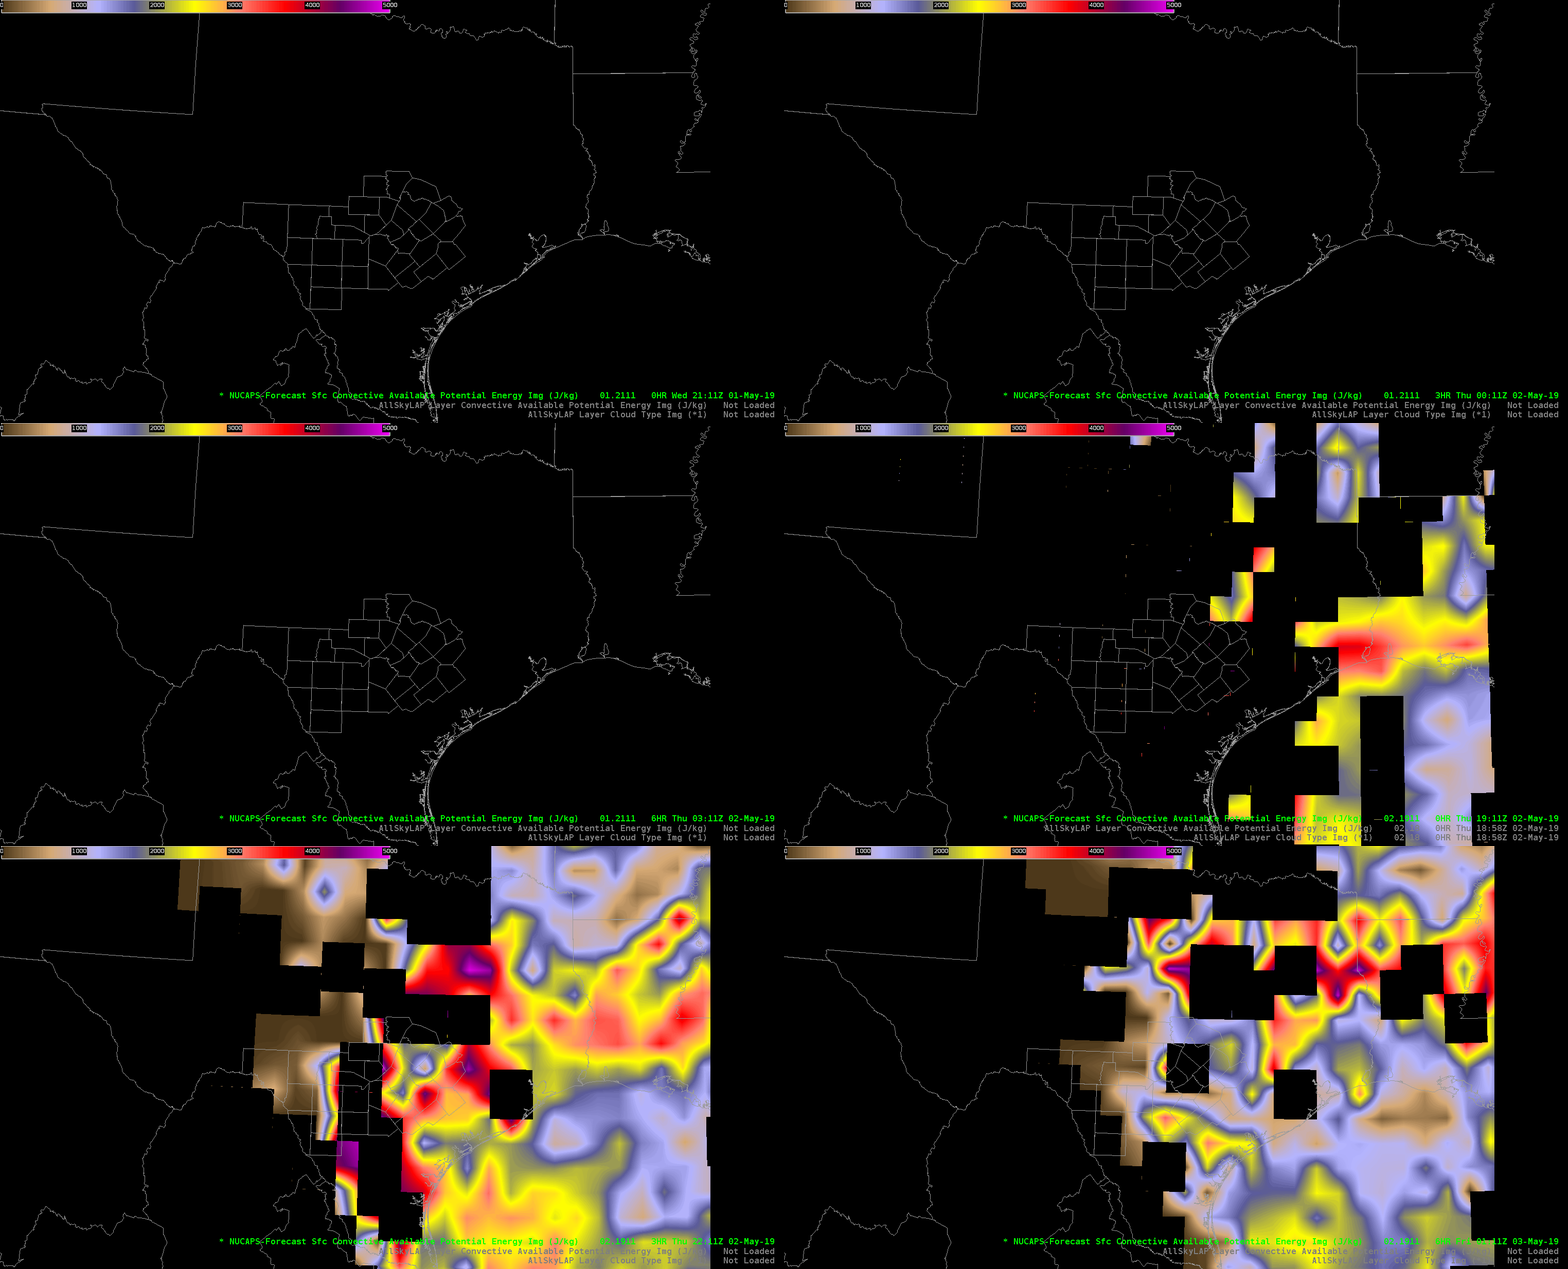
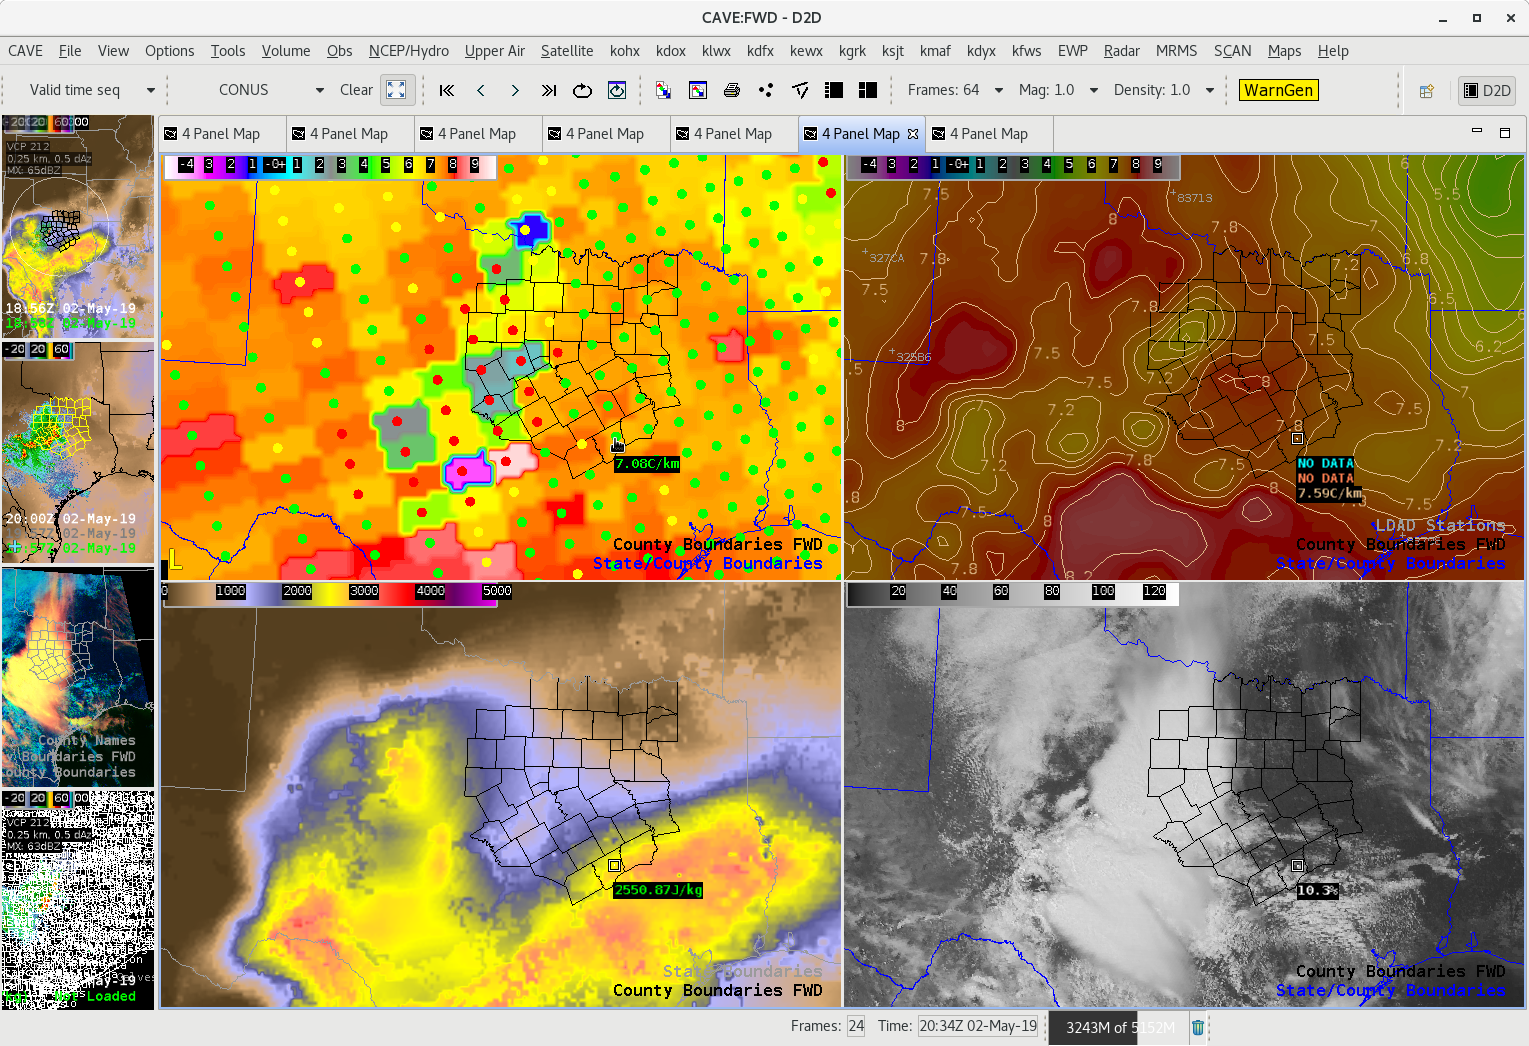
A quick attempt at a combined product with the NUCAPs Forecast and the RAP.

A smoothing of some sort would still benefit the product above, but this would be of great benefit to forecaster’s trying to determine the afternoon environment. (Note: I think it would be beneficial to include a mask that said whether the data was from NUCAPs or a model in each location if a product like this was developed. All in all, this is a useful product, but it needs some further refining.

South Beach
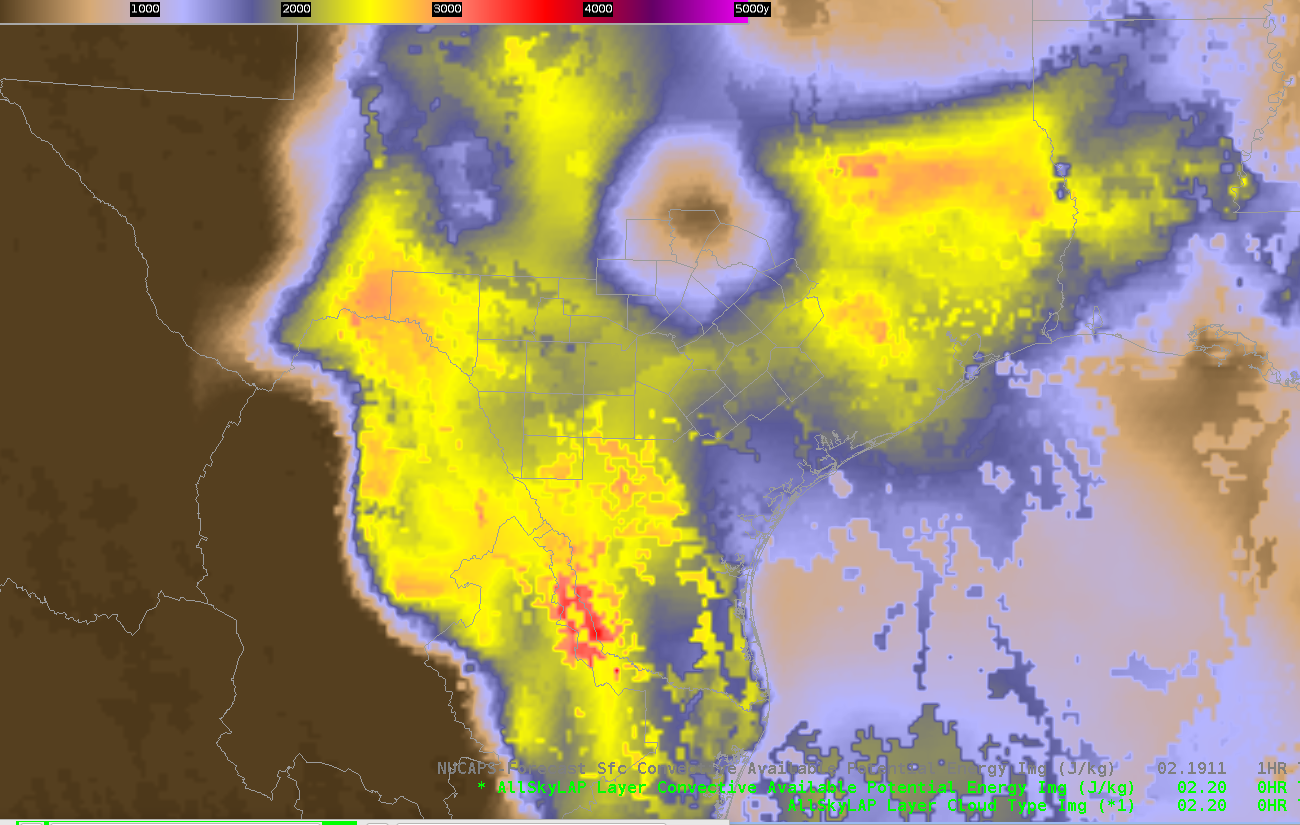
Del Dot CAPE in NUCAPS Forecast

NUCAPS forecast product unrealistically advects the CAPE east through the evening. In reality the CAPE axis extends along and east of the Rio Grande and will likely stay in place but slowly modify toward sunset. Also it might improve the product to interpolate or fill in the gaps with a model (actually Jake’s comment) not mine.

— SCoulomb

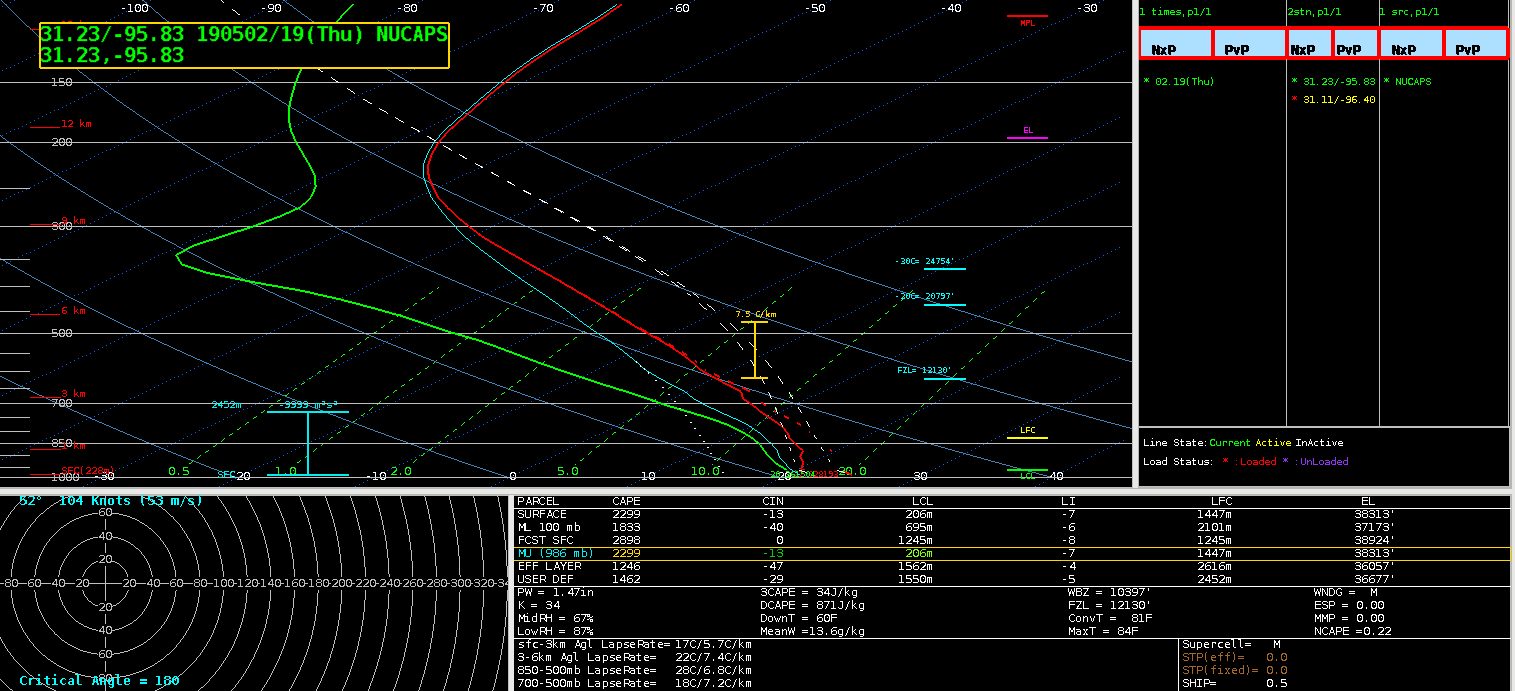
NUCAPS Modified Sounding Compared to Surface Obs

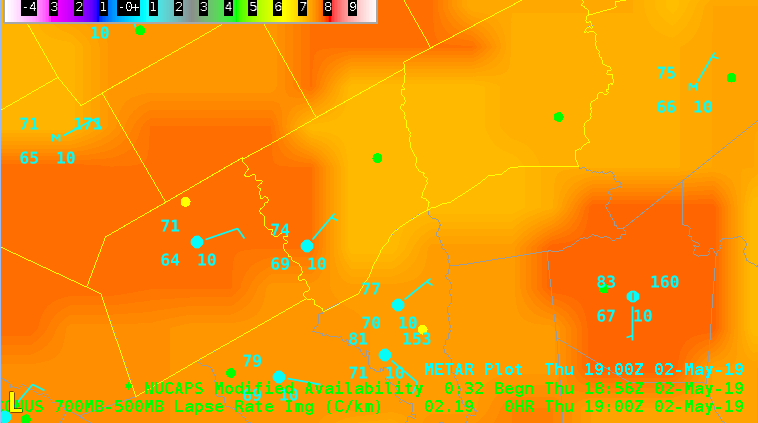
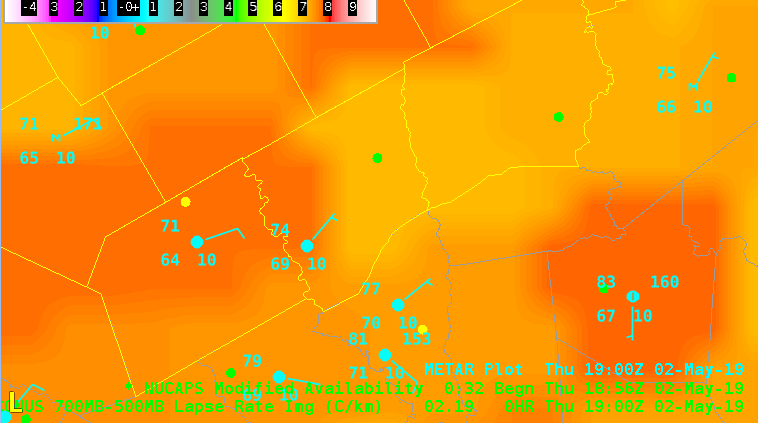
NUCAPS gridded 700-500mb Lapse Rate and Modified sounding points.  Lapse rates are favorable for storm intensification across the southern part of FWS CWA.

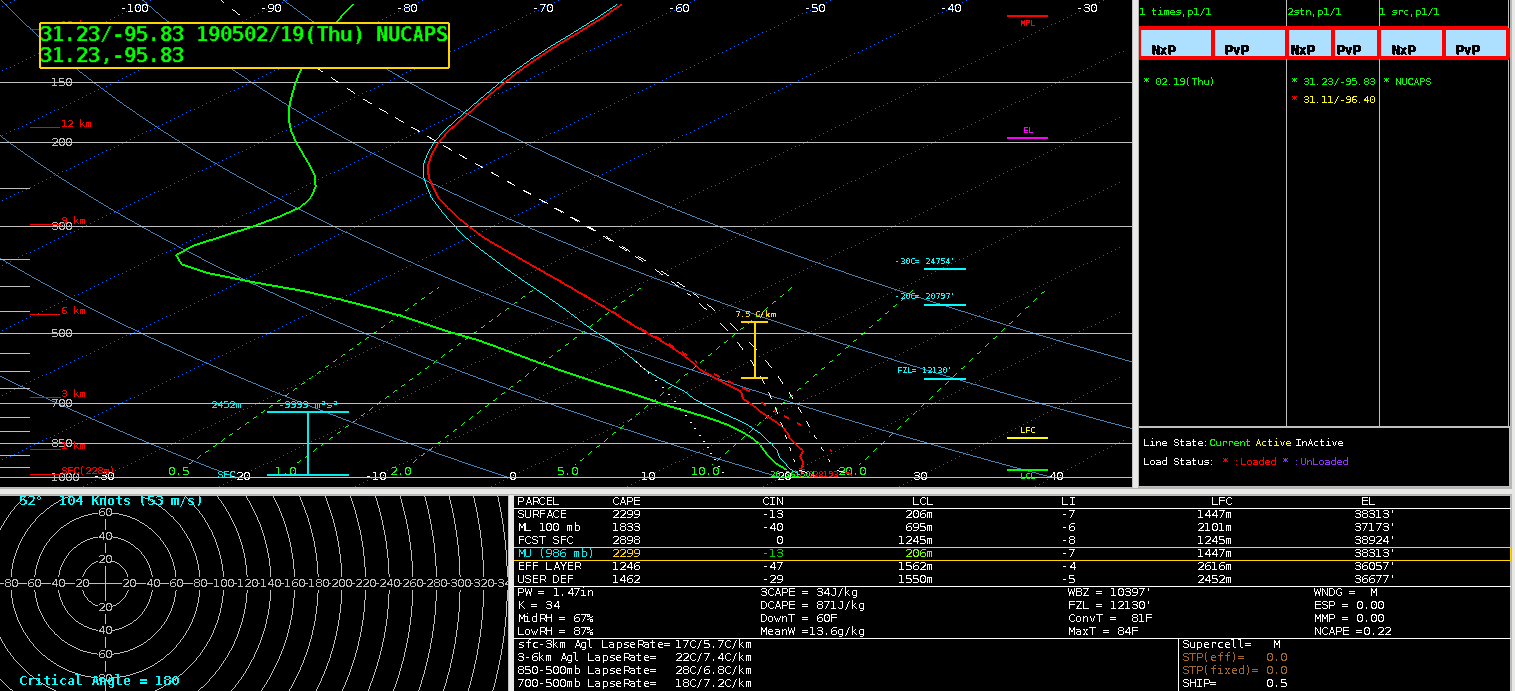
NUCAPS Modified sounding had 72/69 (temp/dewpoint), compared to closest surface METAR KLHB 74/69 (temp/dewpoint).  This sounding data showed un-capped and unstable environment supportive of surface based convection in southern FWS CWA. -Jake Johnson

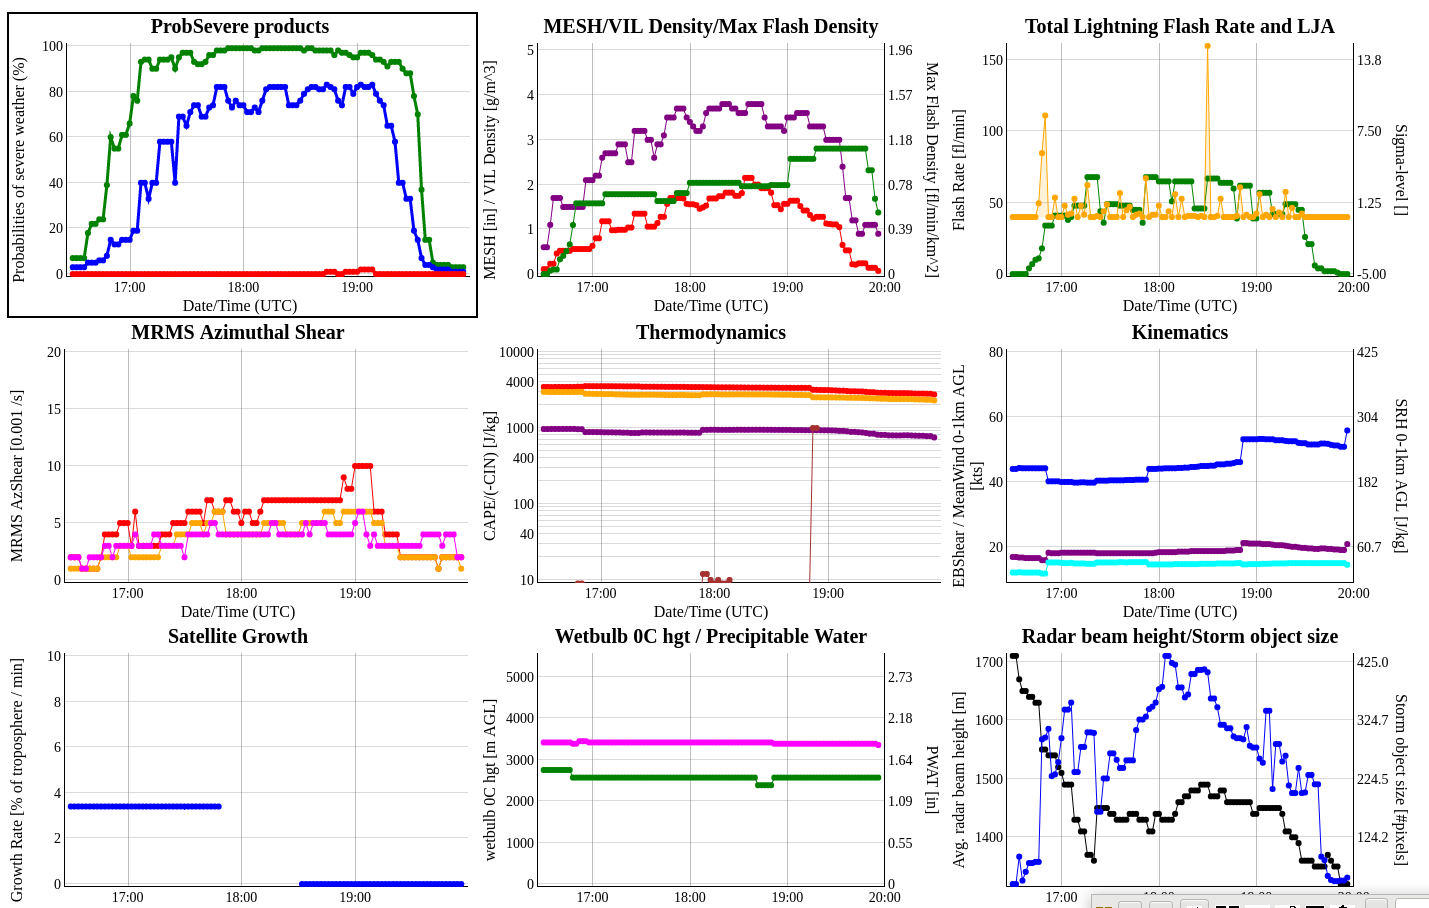
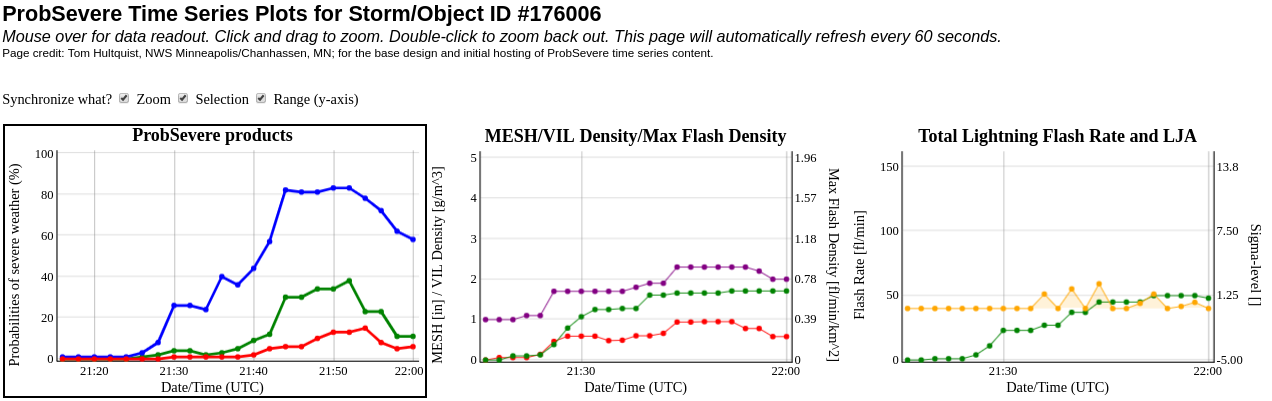
ProbSevere Trendmap for a splitting supercell

Graph of probsevere for splitting supercell discussed in earlier blog entries. These graphs are extremely useful to forecasters looking for trend analysis.

Possibly even more important could be their use in post-event analysis. For example, plotting lines on these graphs when LSRs came in, when tornadoes occurred, can give forecasters an idea of what the trends were showing in MRMS at the time of the impacts. The RealEarth viewer appears to allow you to view these graphs from object IDs back about 24 hours, however only the object ID shapefiles are available before that in time. It would be very useful for forecasters to have access to these time series plots for post event analysis – perhaps consider making them available for any object IDs up to a week old?

-Dusty

AzShear not helpful in depicting the increasing rotational velocities

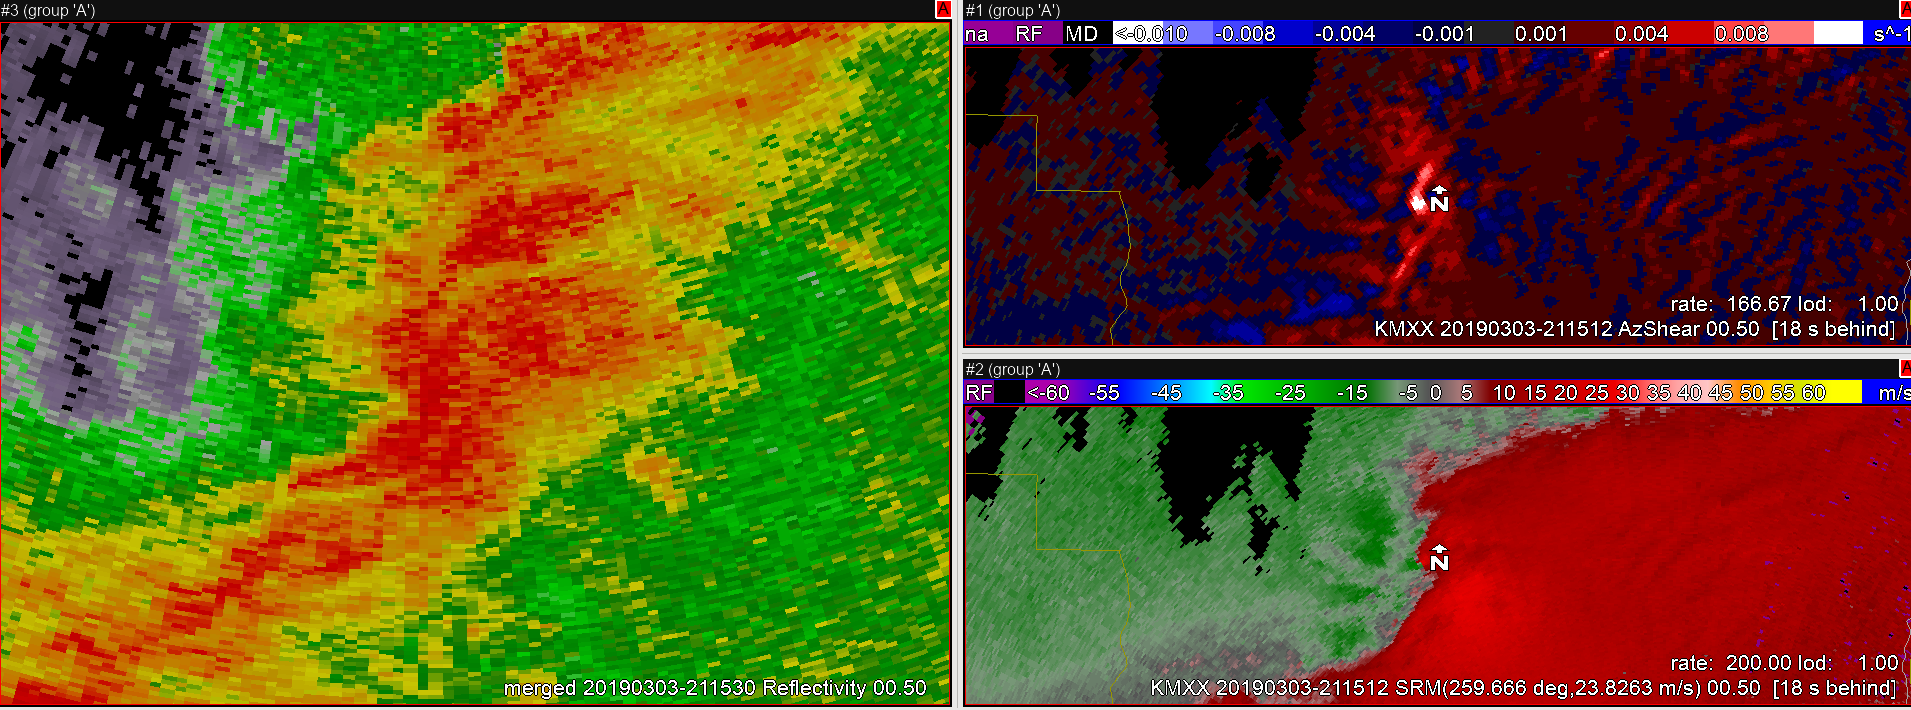
Here is an attempt to show how a circulation may evolve over time and become stronger and tighter (increasing rotation rate) however the single radar AzShear does not help the user identify the increase in shear rates. The merged product AzShear was even more nondescript with its weaker appearance of the circulation.

It would be helpful to have some way to better visualize the change in shear over time in the AzShear products, either with a trend line or a different color curve.

When we are making warn/don’t warn decisions, changes of just a few kts rotation velocity may tip the scales, the AzShear product as it is now does not provide the resolution/detail for these changes.

SRM – 2122, 2124, 2126, 2128 UTC

KMXX AzShear (Top), Merged AzShear (Bottom) – 2122, 2124, 2126, 2128

— SCoulomb

AZ Shear Final Thoughts

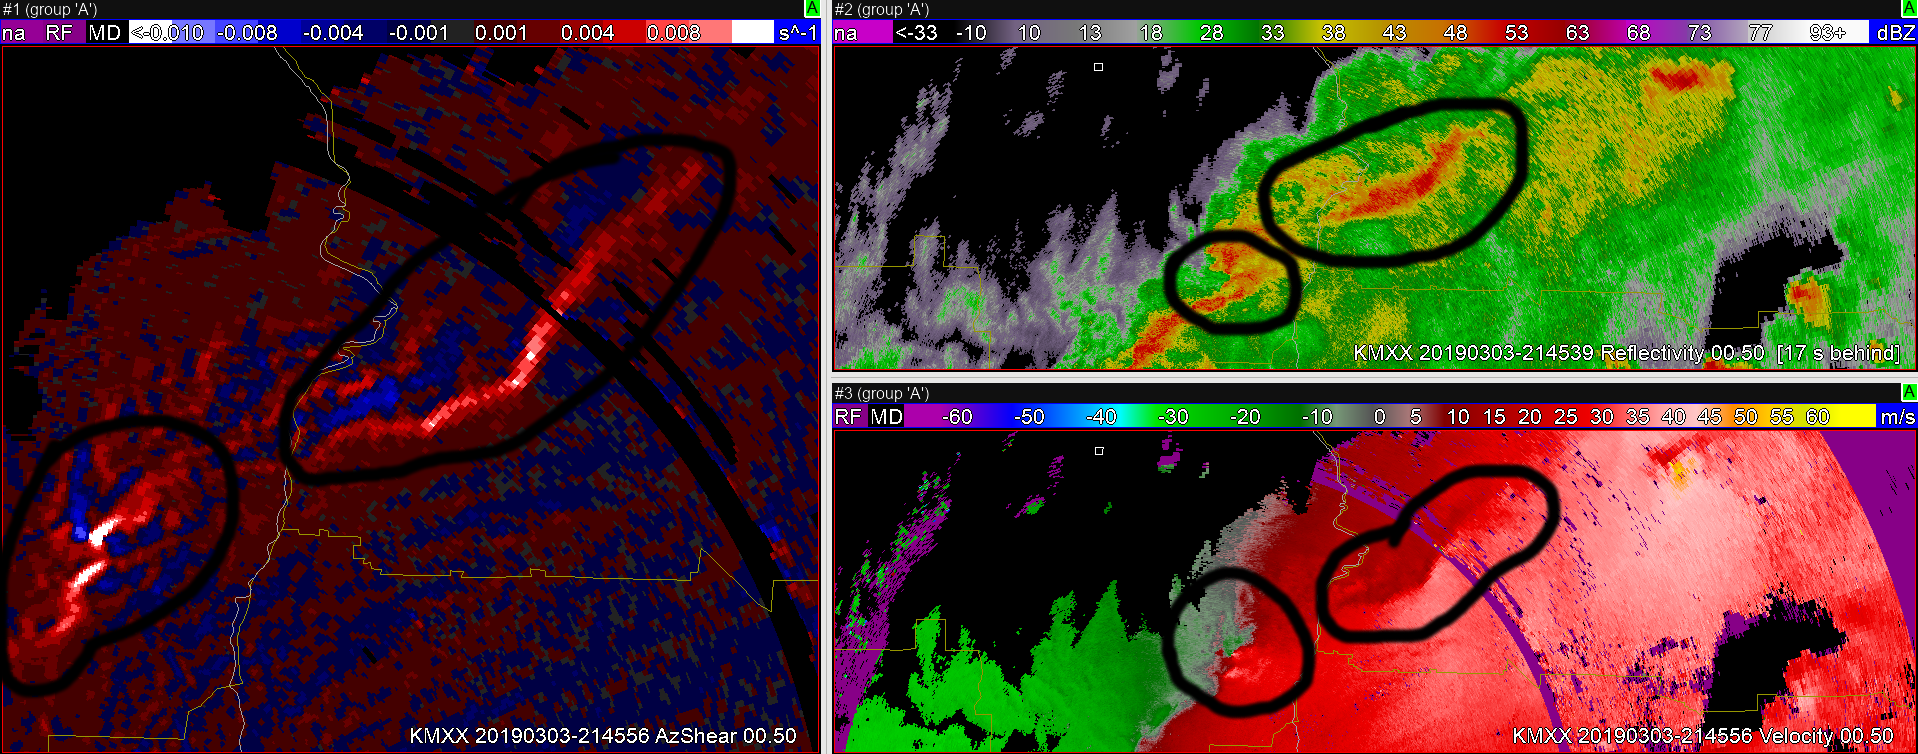
Ultimately, AZ Shear has a lot of potential value in warning operations. It is really good at highlighting areas that need immediate investigation. Notice in this case how AZ shear maxima are present along a segment of the the storm that has begun to bow. Additionally, it has highlighted an area of rotation along the QLCS. Within a warning environment, I could foresee it increasing lead time on warnings because your attention is gravitated immediately to specific areas of AZ shear maxima. One thing I think would be of great benefit is making some of the az shear values closer to zero transparent, so that it can be easily overlaid on velocity products. In this case, I would also recommend using a different color scale than red because it will end up blending in with the velocity data.

A weak bowing segment and velocity couplet highlighted by AZ Shear

South Beach

GLM behavior, overlaid with +40dbz/vis sat throughout a CI event and storm split

Full loop from CI through storm split. A good practice for GLM users overlaying with radar is to Alpha your color table below a certain range (in this case 40 dbz) to mask out low reflectivity values and focus on storm cores only. Because of the parallax error, the storm cores on GLM are displaced to the northwest of the radar cores – a hidden benefit for storm interrogation!

There are several things to note here. First is the onset of GLM data – this storm featured explosive development. The GLM data here is 5 min/1min update. Because of this, the upward trend is rather sudden – for early stages in deep convection it may be best to use 1 min data. As the supercell splits, the the different cores are most evident in the top left, which is Event density data. FED, AFA, and TOE do not snow this trend nearly as well. I chose not to include a loop of Minimum area, because this data was too low -resolution to capture details of different cores this close.

This is a longer loop of the same event showing the storm through its demise. You can see the Average Flash Area in the storm in the bottom left really increase as this particular supercell diminishes. This is consistent with the idea that shorter length lightning in the core ceases and most of the remaining strikes are longer flash events in the residual anvil.


-Dusty Davis


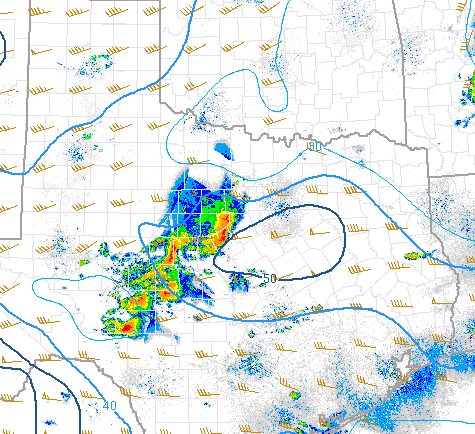
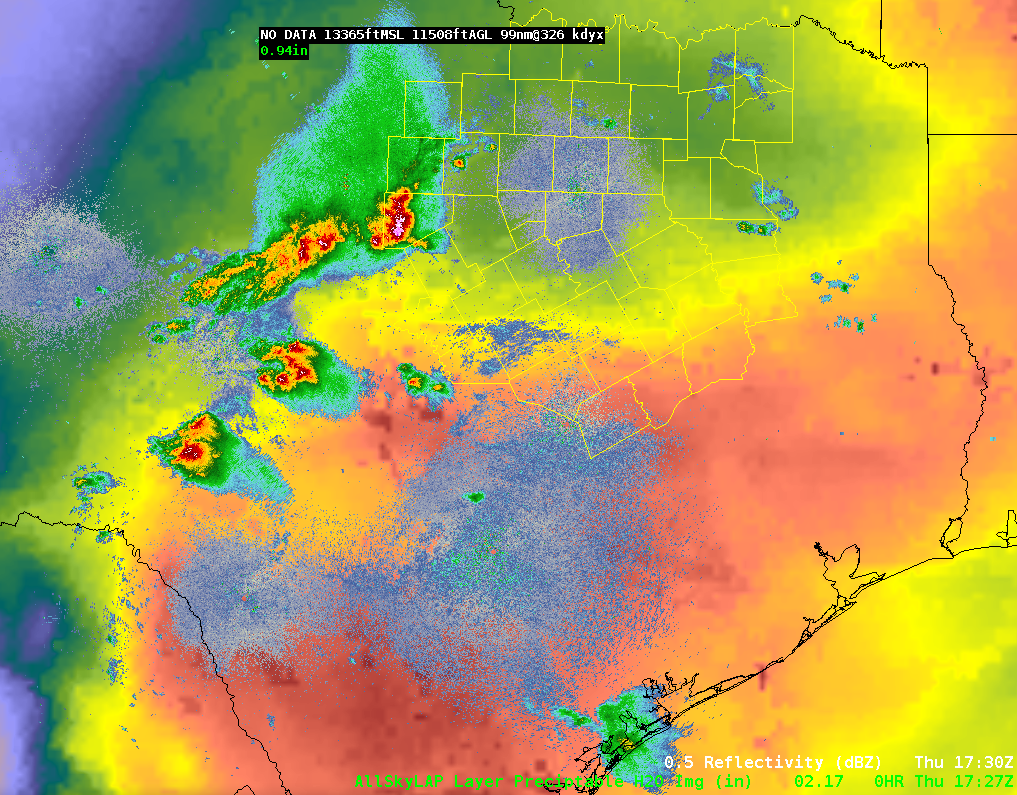
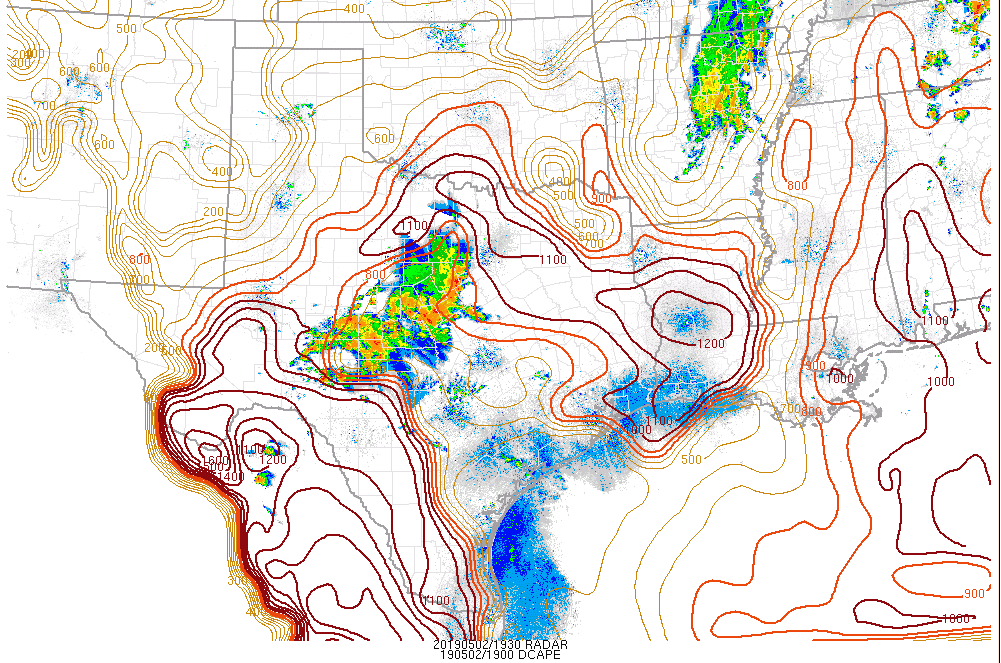
Mesoscale discussion using All Sky and SPC mesoanalysis page

Favorable 0-6km shear aloft from SPC Mesoanalysis page above across FWS CWA

All Sky Total PW above shows deeper moisture in southern FWS CWA.

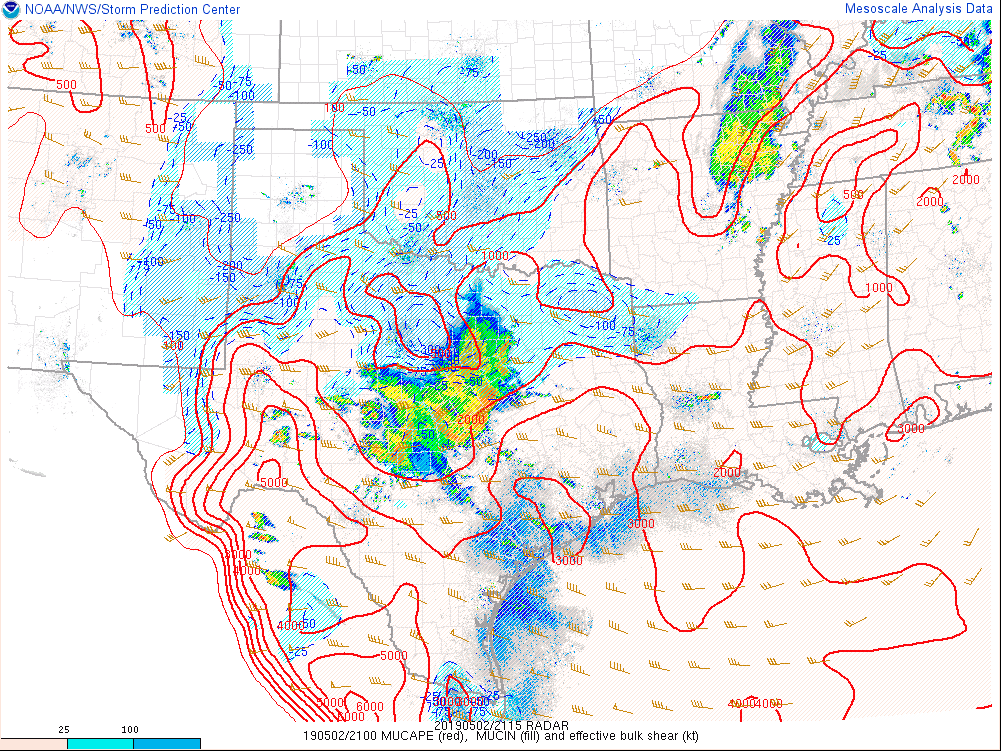
High DCAPE values across the FWS area per SPC mesoanalysis page above


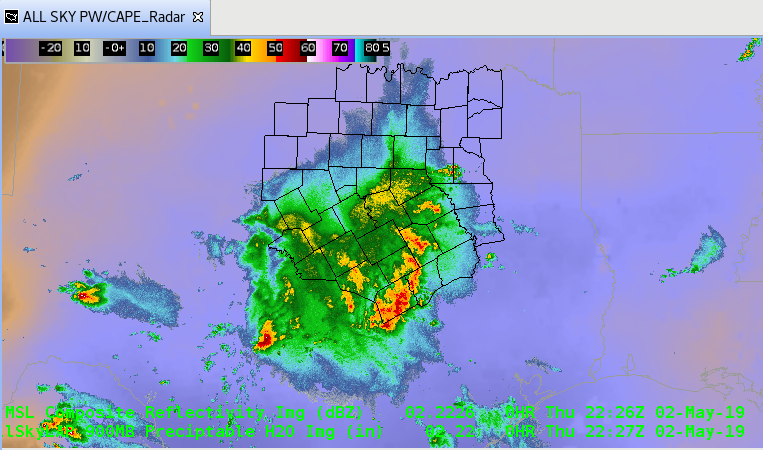
Mesoscale Discussion…40-50kts of wind shear aloft and high DCAPE values show conditions favorable for severe winds to occur, mainly for locations where  All Sky total PW shows strong moisture gradient along surface front in southern part of the CWA.

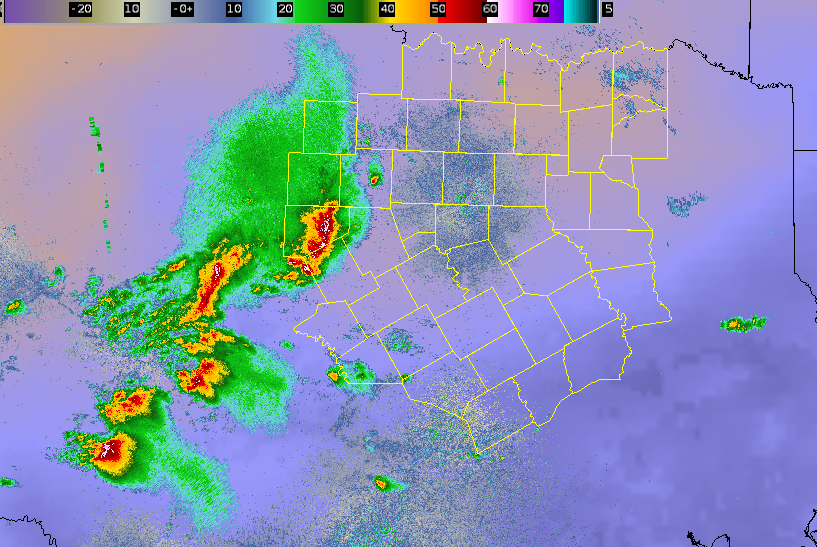
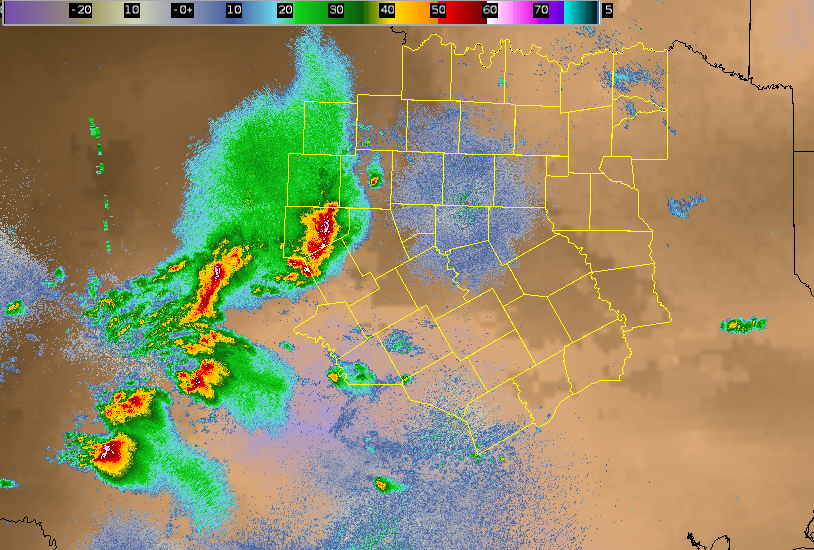
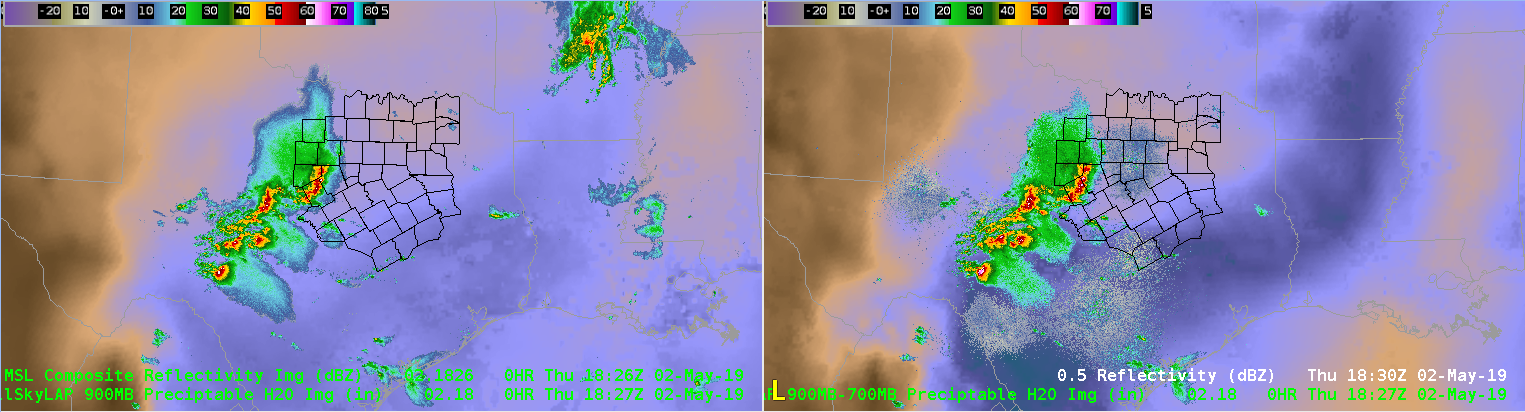
This is a loop of radar and All Sky LAP CAPE.  Notice the higher CAPE values in the southern part of the CWA. This is were linear convection could grow upscale become surface based and capable of produce damaging winds.  -Jake Johnson


The ProbSevere Wind spiked to 80% with a thunderstorm that later moved across southern FWS CWA, which was our area of concern.

Quick ID of QLCS circulation by AzShear


Single radar AzShear may be a game-changer for identifying the quick mesovortex spin-ups along a squall line. QLCS events remain one of the most challenging for radar meteorologists and any help in identifying these features could add needed lead time and/or confidence to the warning decision. Just being able to discriminate which circulation is most intense along a line would be sufficient argument to move this product into operations but the added benefit of early identification and consistent tracking of these features should get the attention of decision-makers.

— SCoulomb