


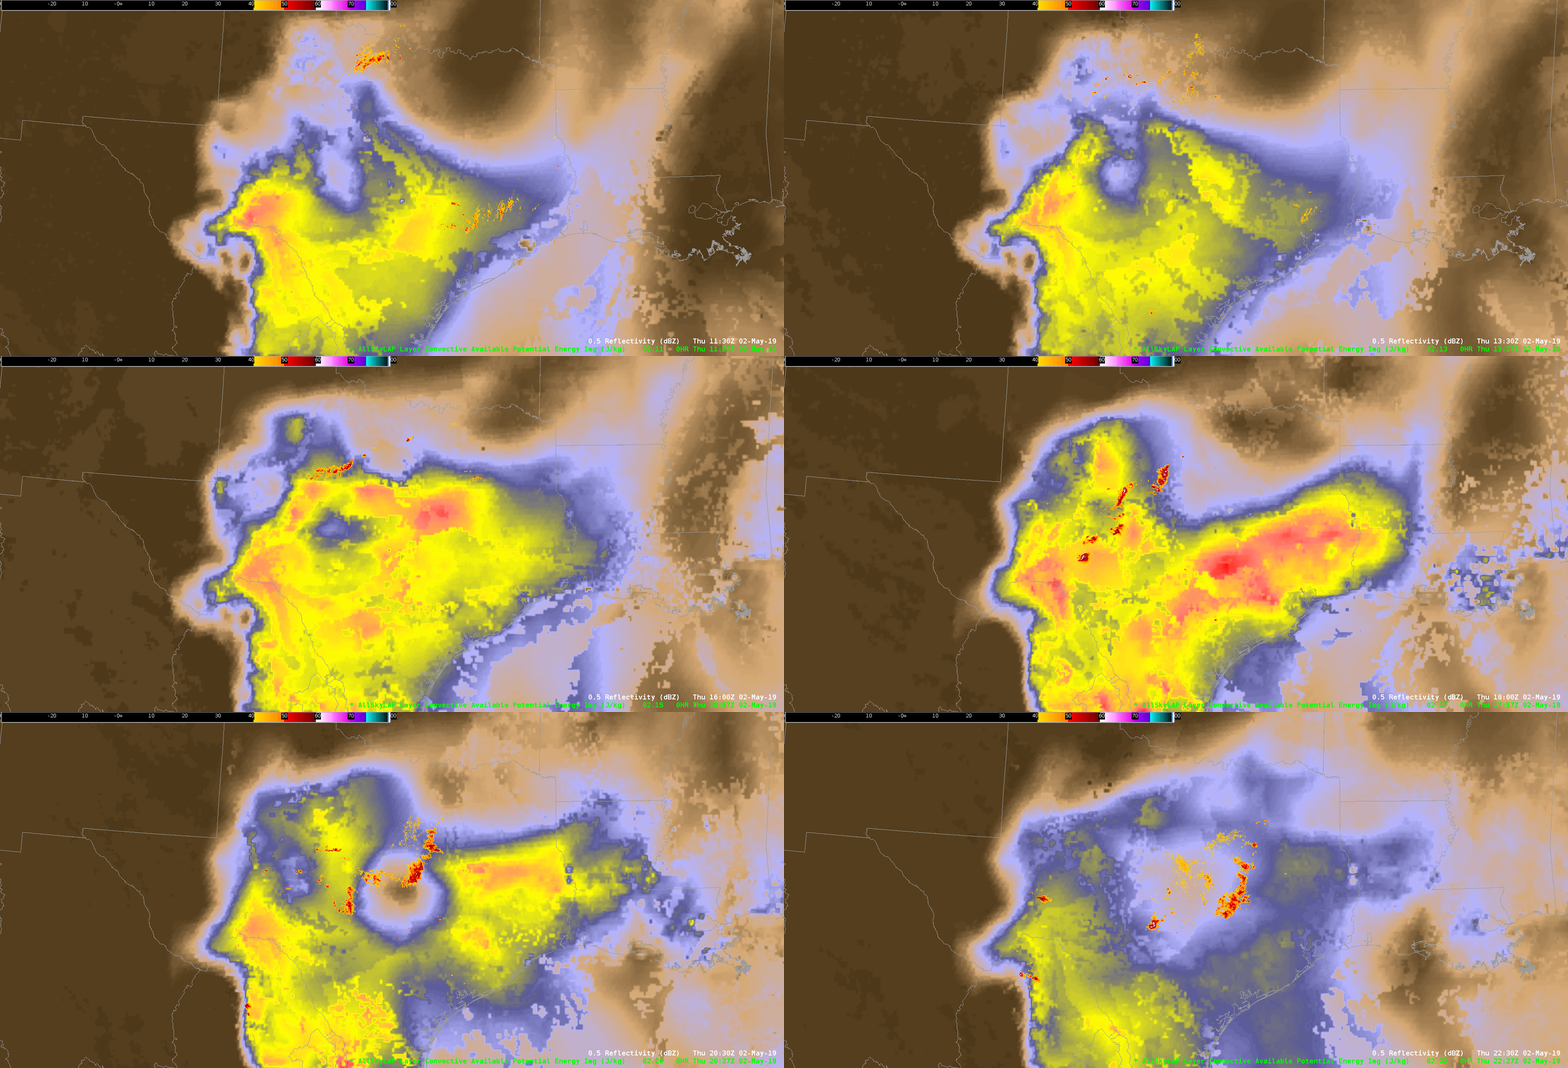
This loop shows how AllSky LAP CAPE behaved as convection evolved through the event. You can see which cold pools related to which thunderstorm events. Allsky Lap captured several of these cold pools including a large one over central texas.
Official websites use .gov
A
.gov website belongs to an official government
organization in the United States.
Secure .gov websites use HTTPS
A
lock (
) or https:// means you’ve safely connected to
the .gov website. Share sensitive information only on official,
secure websites.

This loop shows how AllSky LAP CAPE behaved as convection evolved through the event. You can see which cold pools related to which thunderstorm events. Allsky Lap captured several of these cold pools including a large one over central texas.
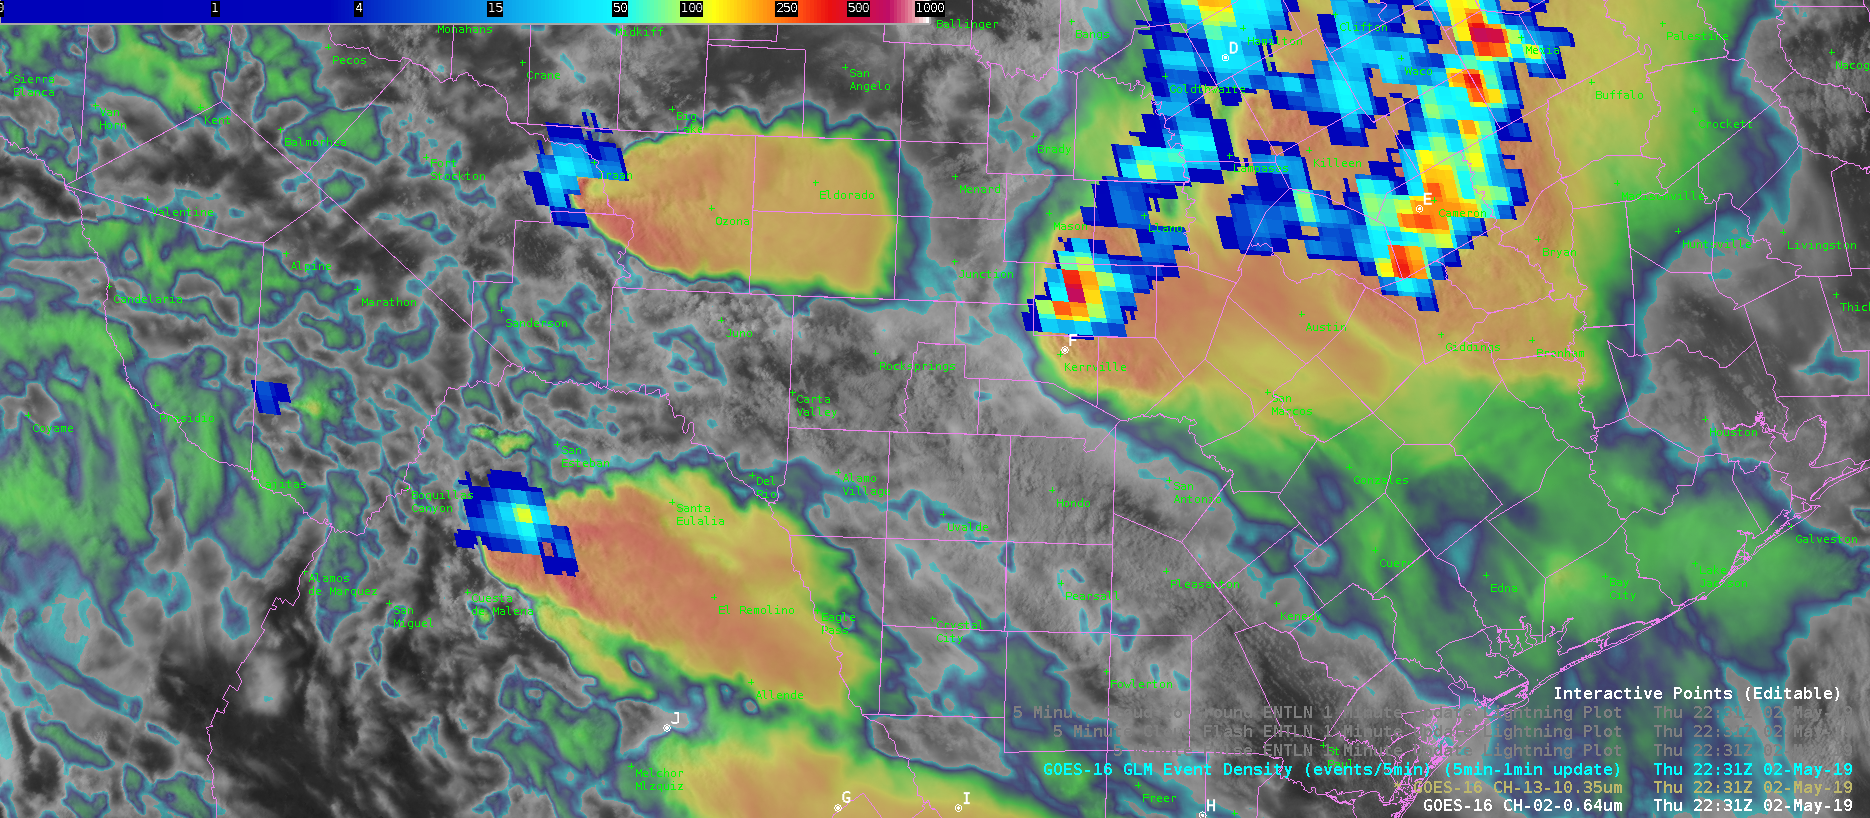
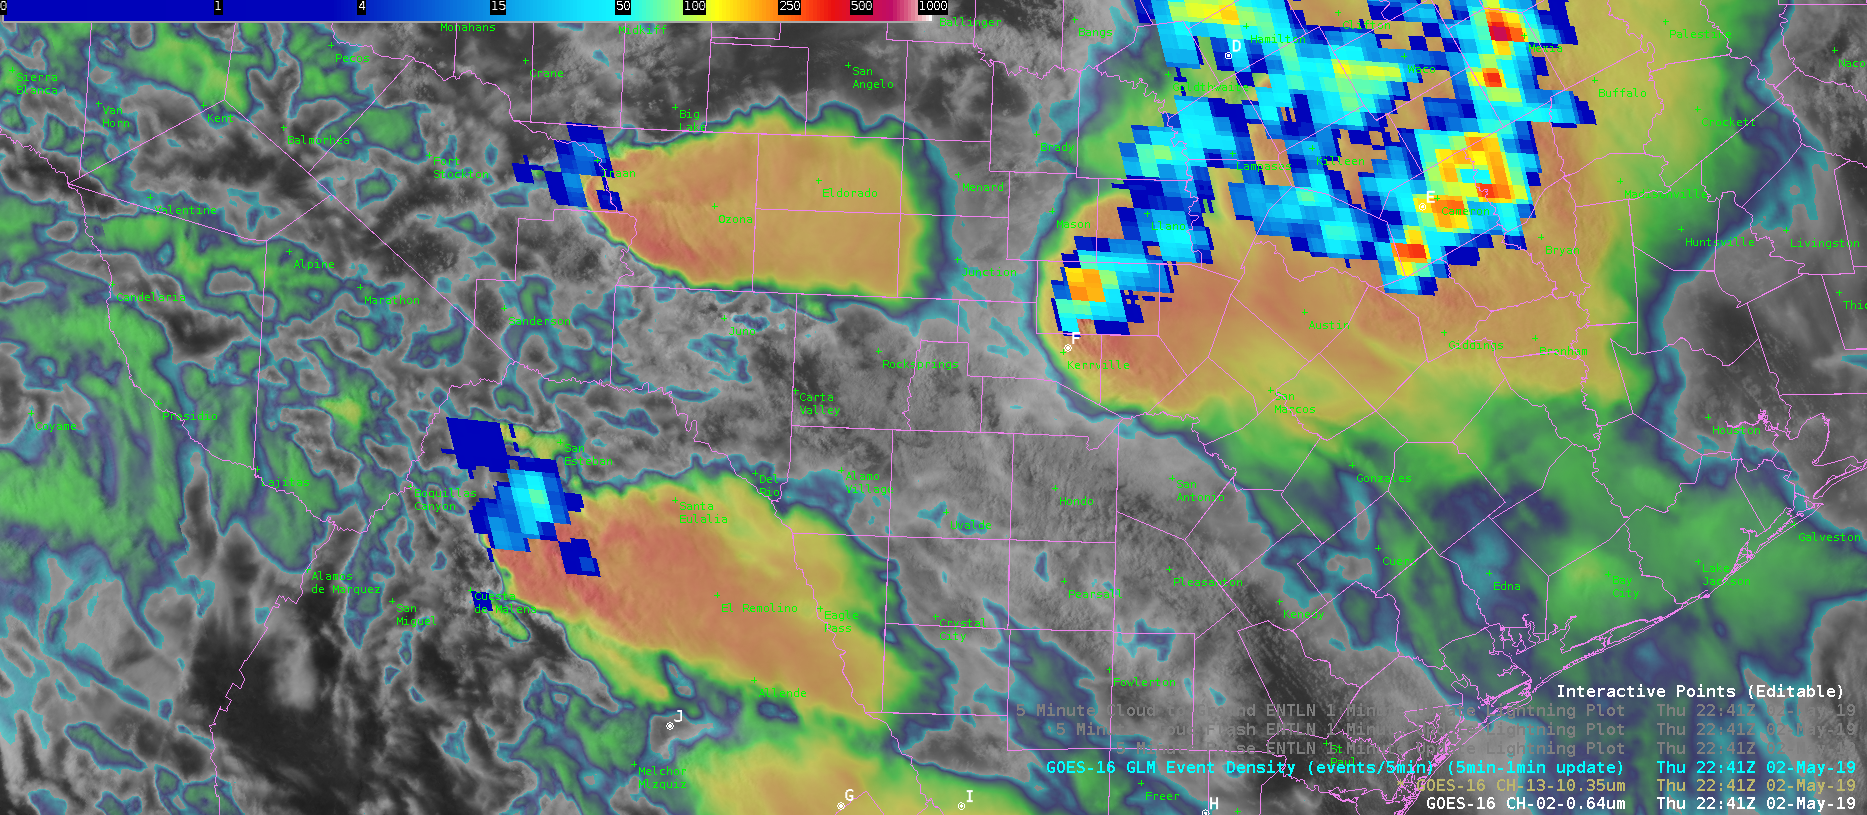
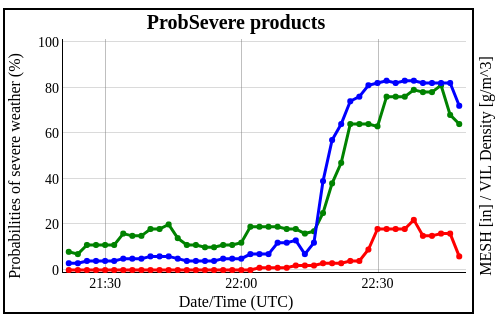
Lightning Event Density was mirroring the storm near point F for a fair amount of time. Notice how the prob severe graph almost directly correlates to the product. When Flash Event Density decreased, the Prob Severe decreased as well. Greater Flash Event Density seems to correlate to storm intensity.
South Beach
 This loop shows how event density evolved as a supercell rightmoved in west Texas. Another good example of GLM data showing a minimum during the most intense phase of convection. GLM data counts recovered somewhat toward the end of the loop.
-Dusty


The top image shows two discrete supercells in the center of the image. Meanwhile the middle image is from KMXX radar which shows weak/harder to identify AZ_shear circulations for the two supercells. Bottom image is AZ_shear from KEOX that has a different viewing angle that shows much more pronounced AZ_shear circulations. A Best practice…for using the AZ_shear single radar product is for forecasters to use multiple radars for better situational awareness since some radars might not show that strong of a signature compared to others due to different viewing angles. -Jake Johnson
There has been considerable examination of the All-Sky LAP products (PW and CAPE) this week, and for good reason – they’re quite good. I wanted to take a quick look at how the All-Sky LAP total PW compared with the merged TPW product. The All-Sky product is on the left and TPW on the right. I overlaid the 20z 1 hour RAP PW forecast for comparison. Ignoring the higher resolution of the All-Sky, the very broad distribution of enhanced and depressed values are similar in location between the two products. However, the TPW values are considerably lower than both the All-Sky and the RAP forecast. Further, pulling the 21z SPC mesoanalysis PW shows that the All-Sky tends to be the better of the two satellite products.
The TPW seems good for very broad generalizations, but if given a choice between the two in operations, I’ll take the All-Sky, All-Day Every-Day.
–Stanley Cupp


The AllSkyLAP PWAT compared fairly well with surface conditions and the merged product however it struggled in the wake of the front/dryline and was too generous with the PWAT values when compared to earlier UA obs. Values in the warm sector were more representative (higher) than the merged product.
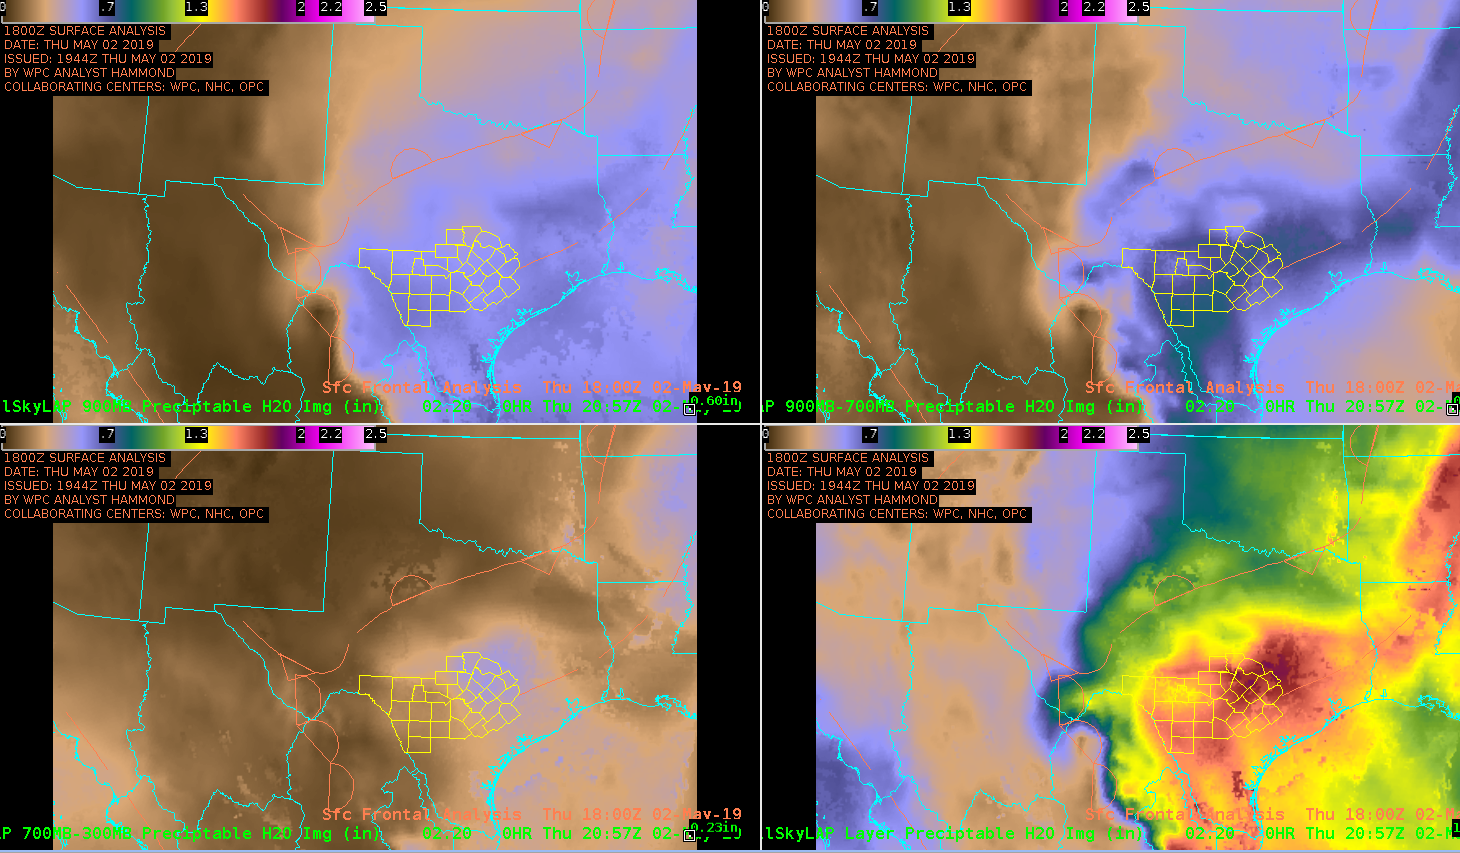
— SCoulomb
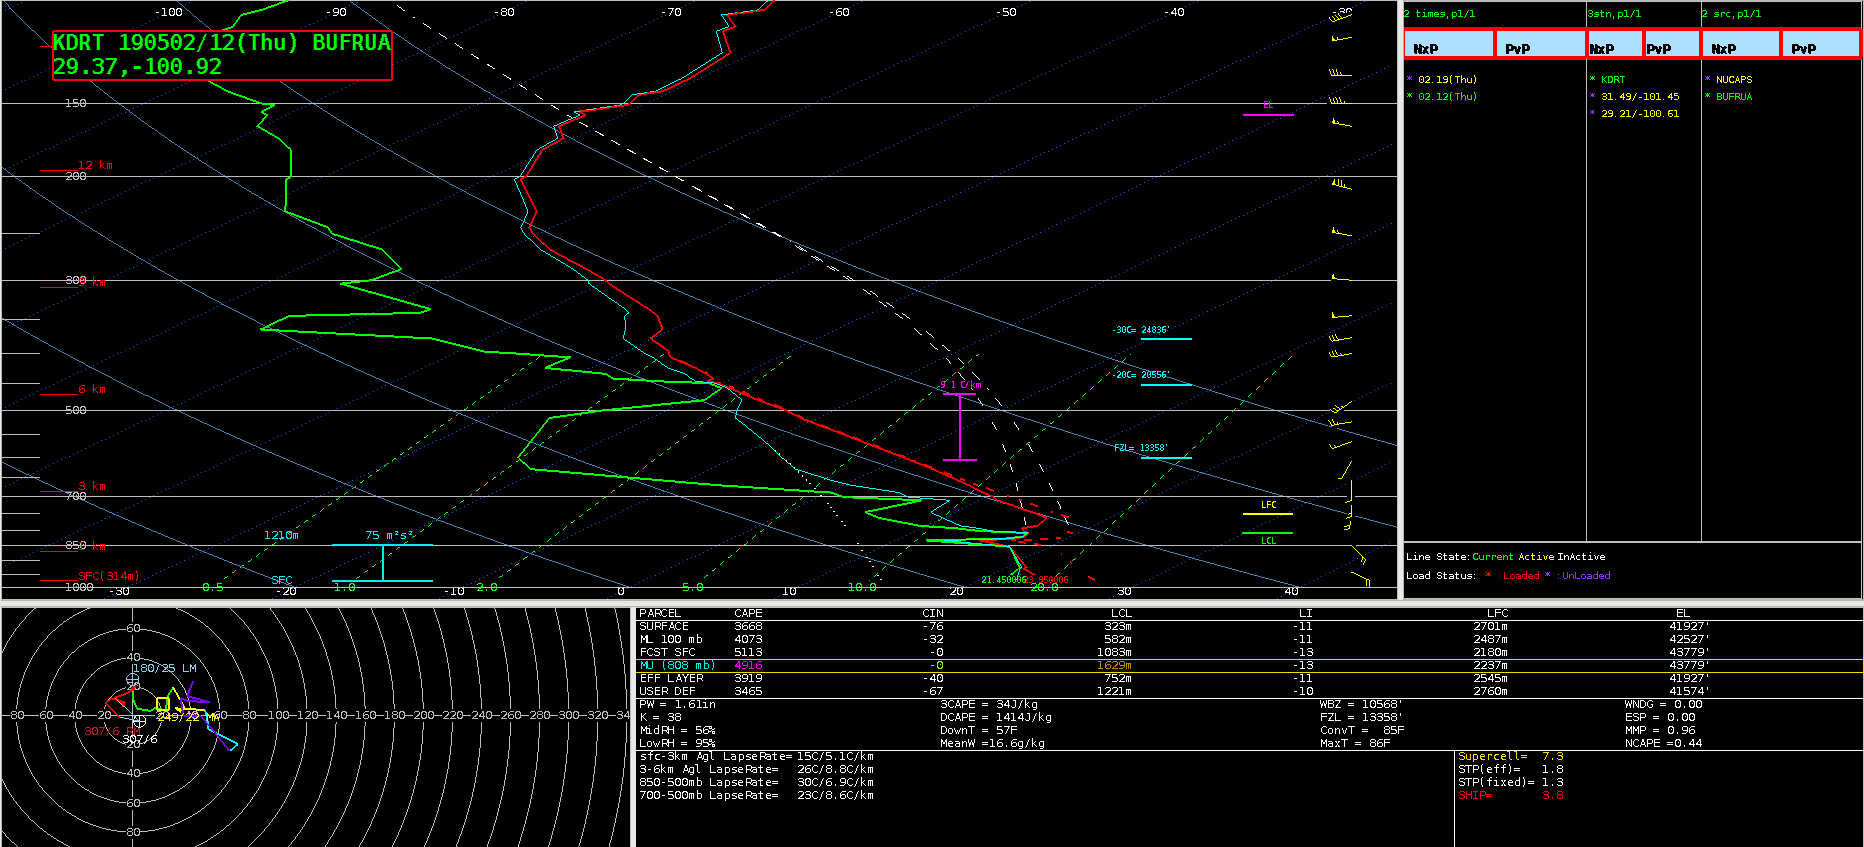
This was the 12z Del Rio sounding.
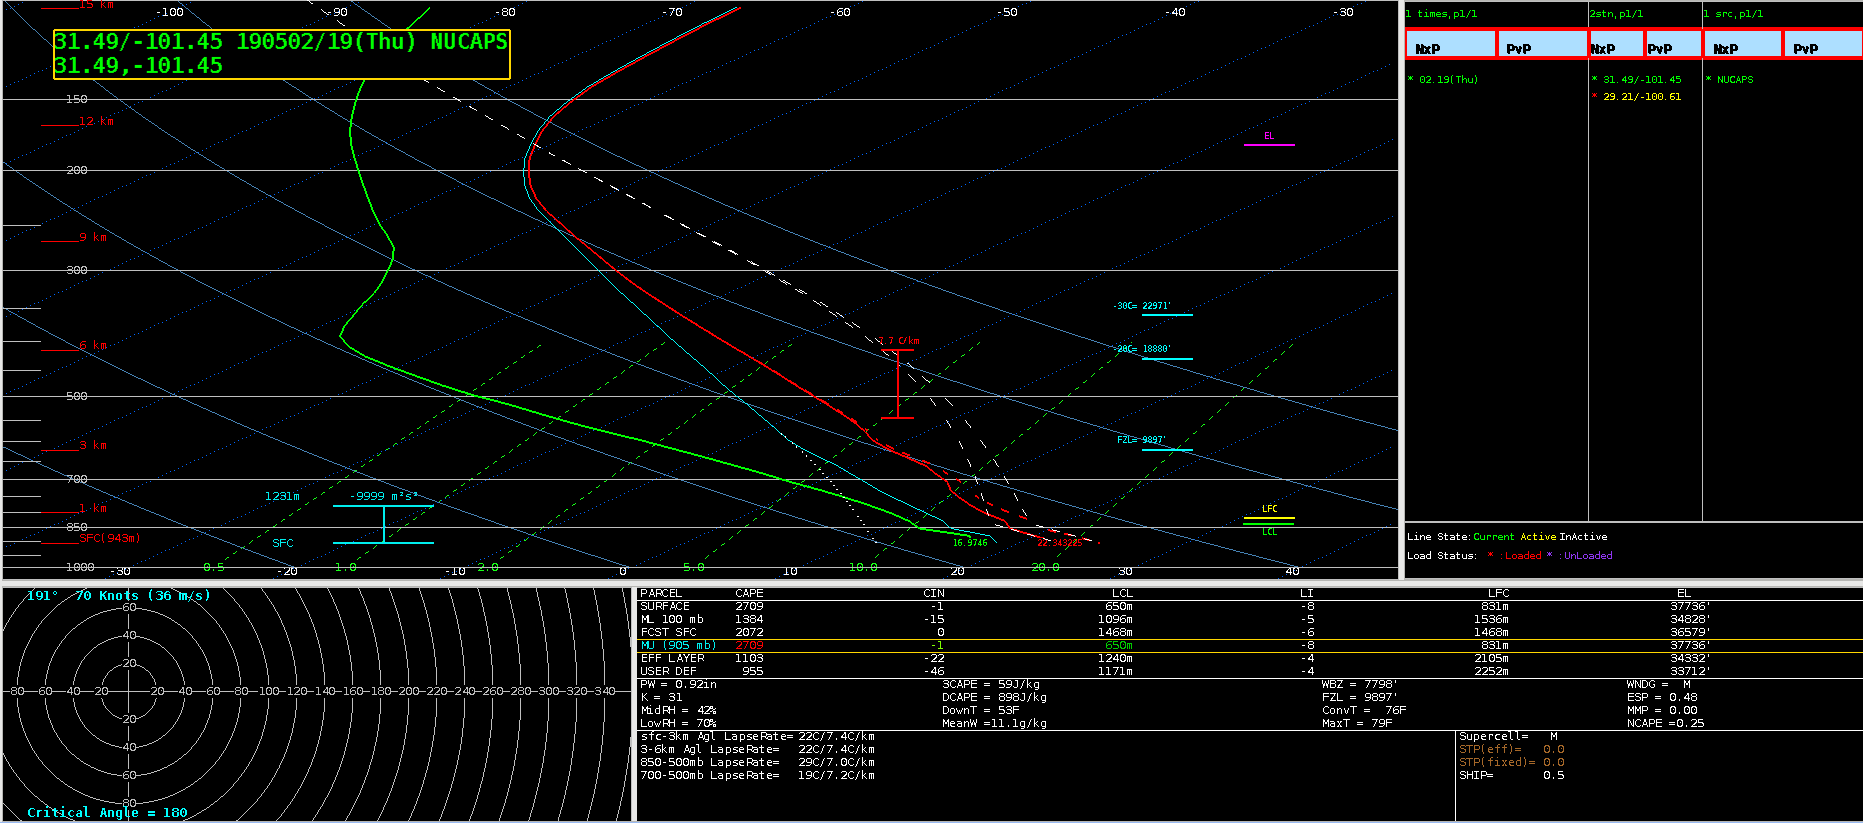
This sounding is a modified NUCAPS near Del Rio. While the lower level structure was a bit different than the actual sounding, the observed sounding was taken several hours earlier before boundary layer modification. 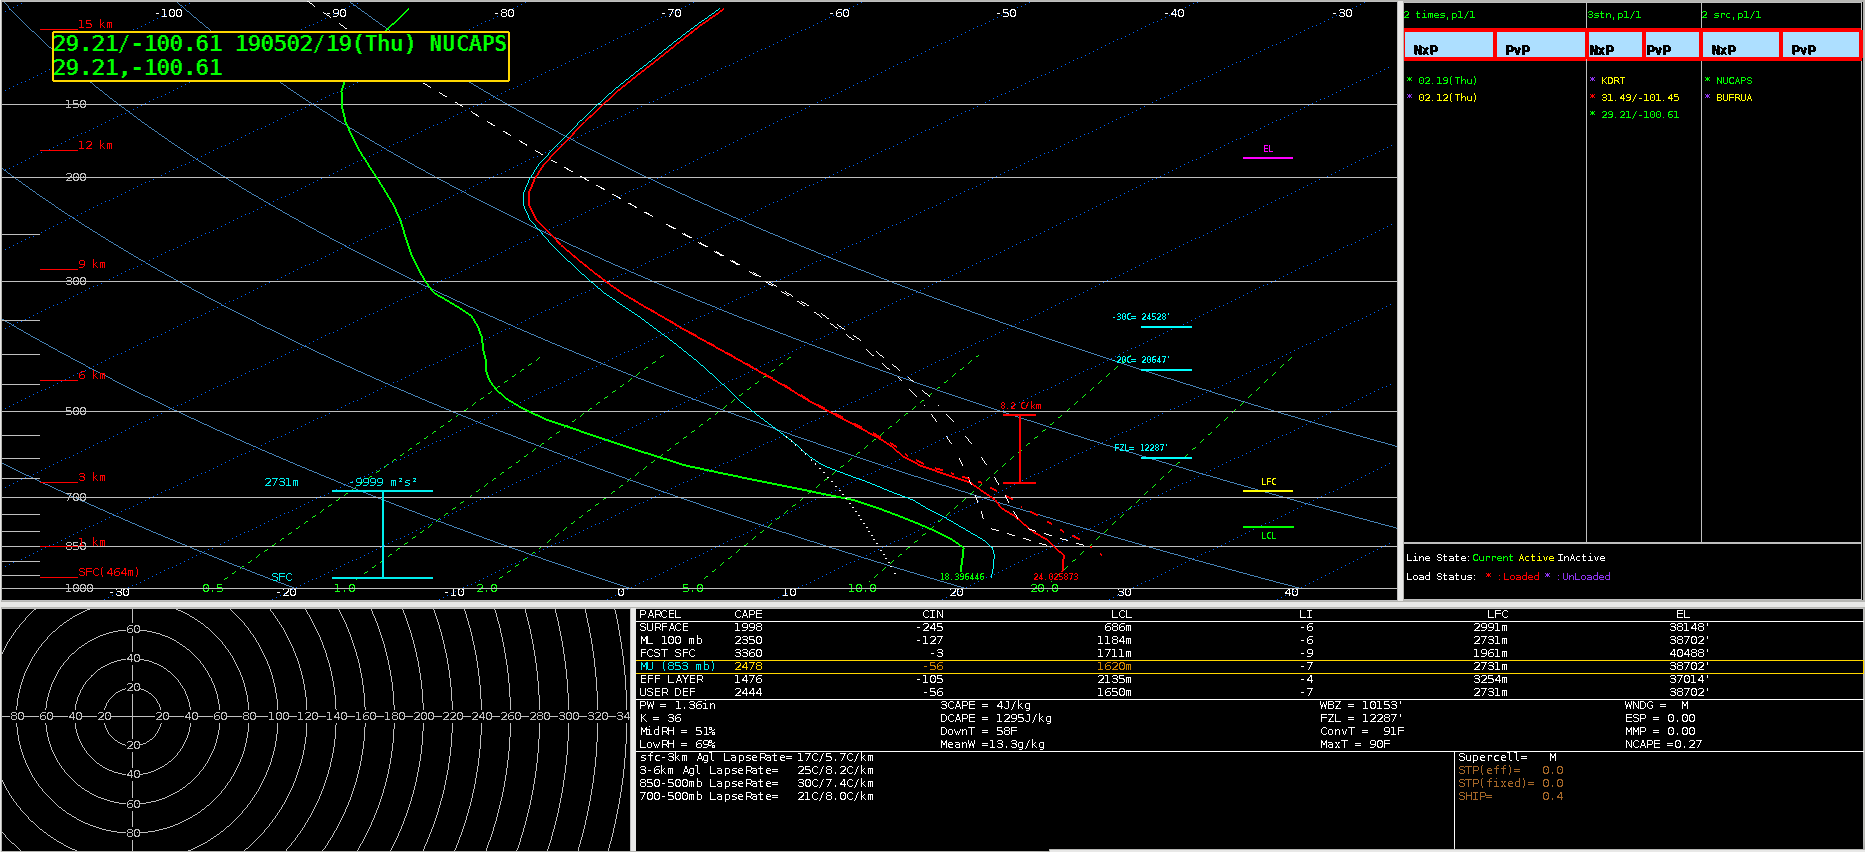 This was an unmodified NUCAPS sounding from the same region. Boundary layer moisture is not captured nearly as realistically as the prior modified example. Overall, trust in the modified NUCAPS sounding data has increased dramatically after some exposure to it. I would say many forecasters need more experience learning about the soundings through simulations to trust the data more.
-Dusty
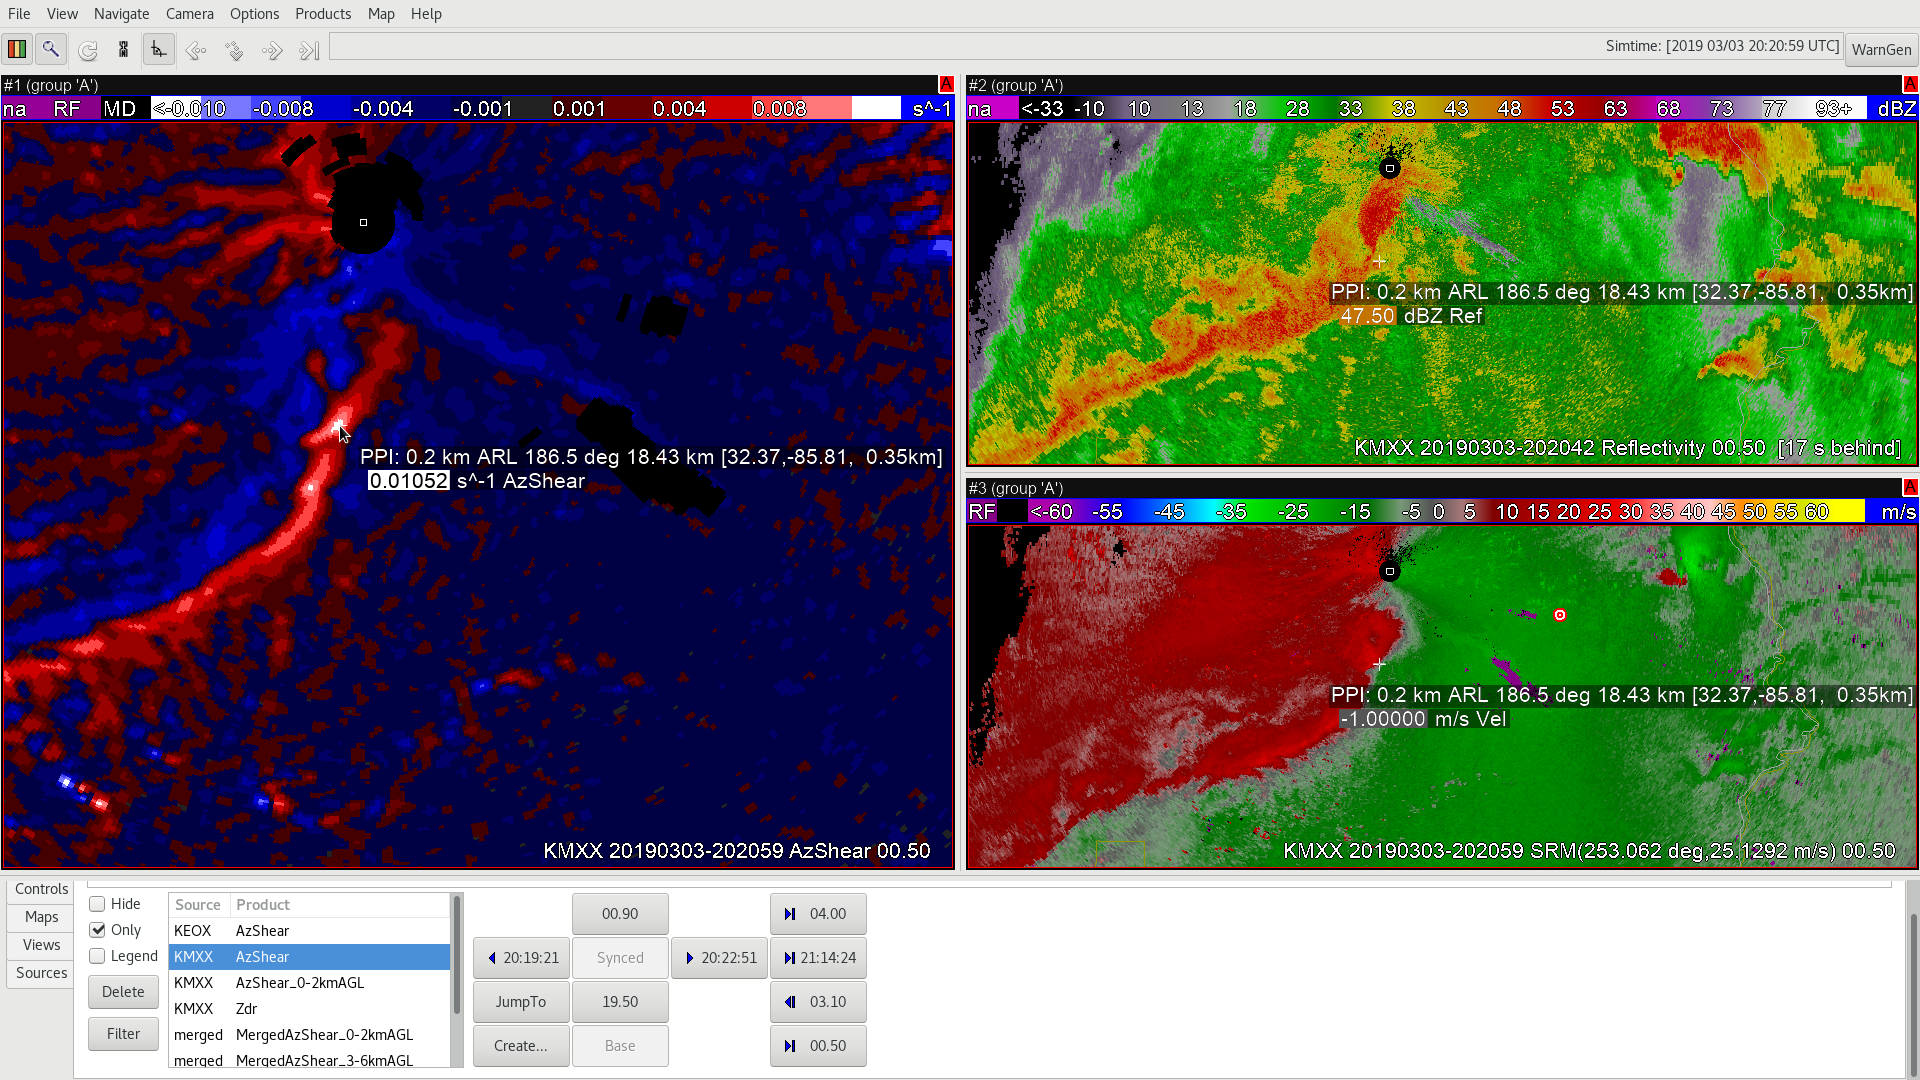

The two images above…KMXX 0-2km AZ product had a bright spot before the velocity couplet developed later on the leading edge of the QLCS which is a helpful pro-active approach to watch this area for possible QLCS tornadic development. -Jake Johnson
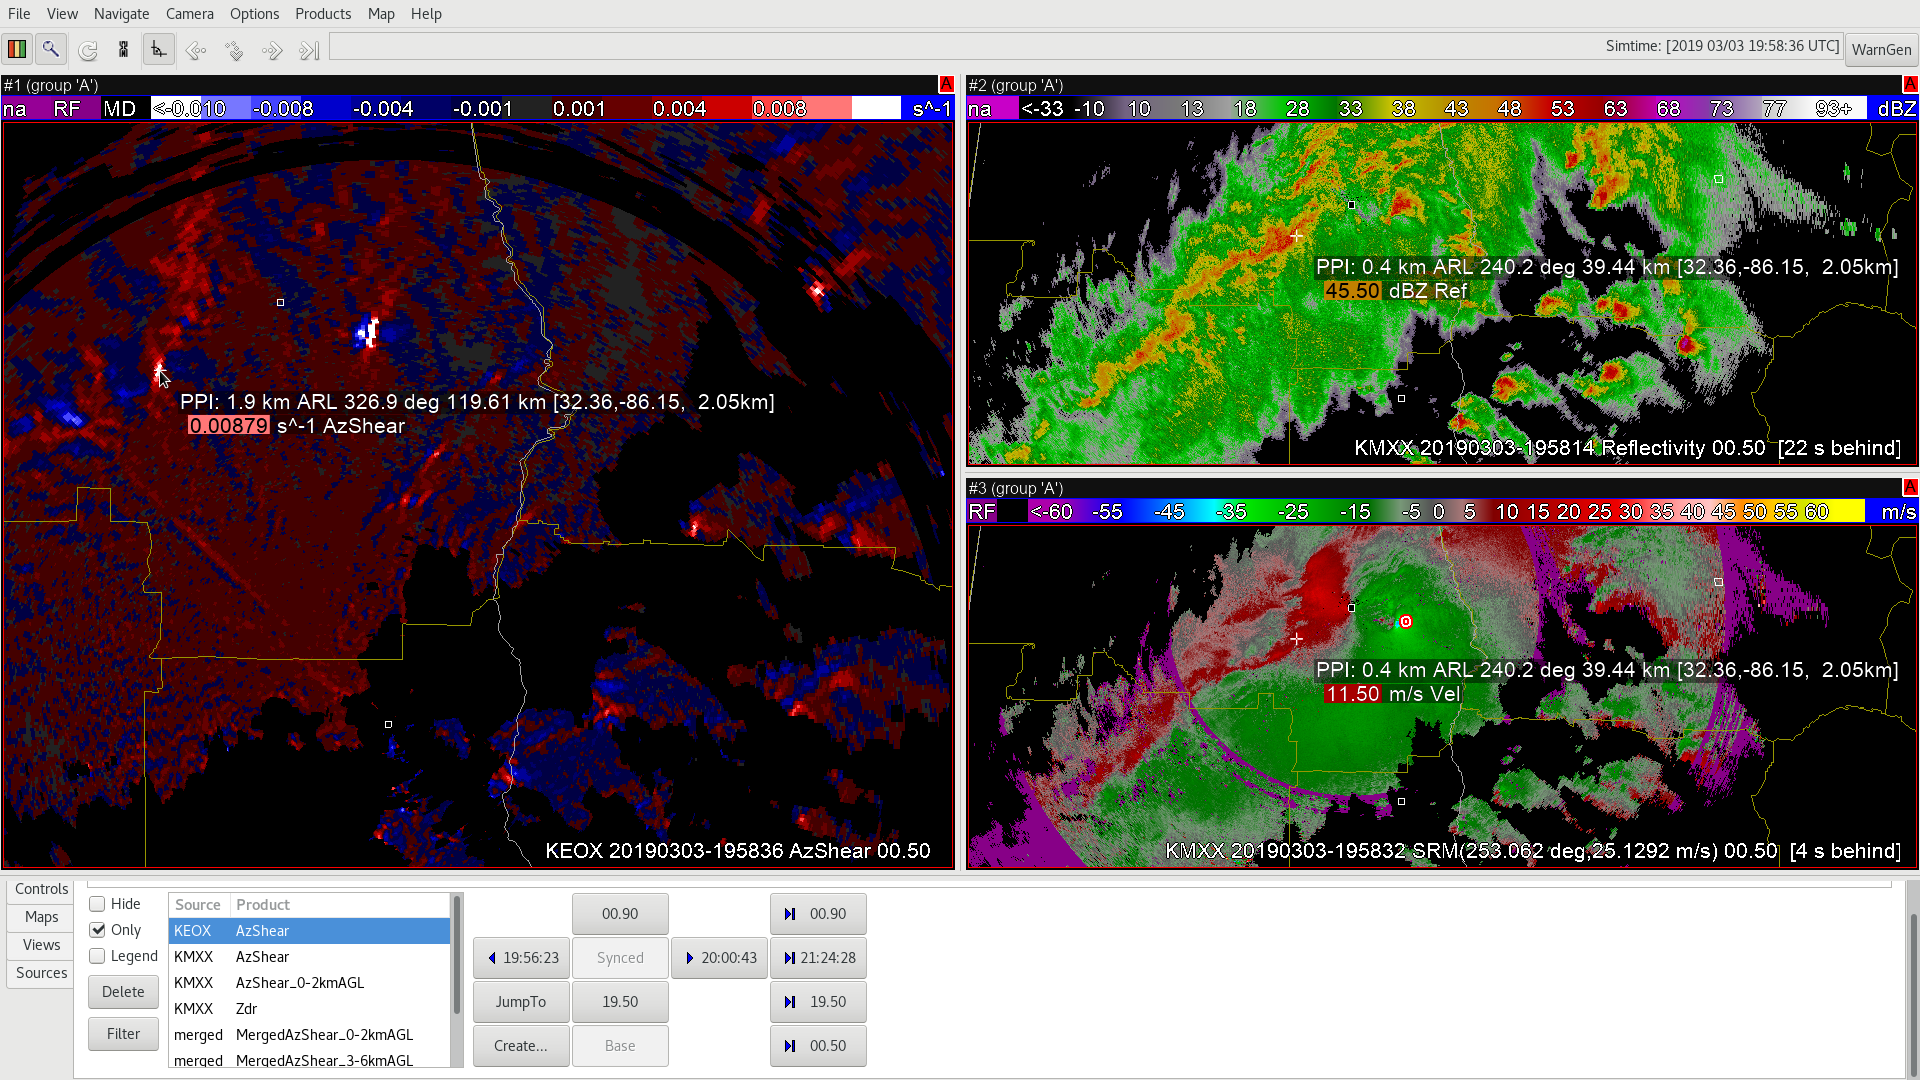
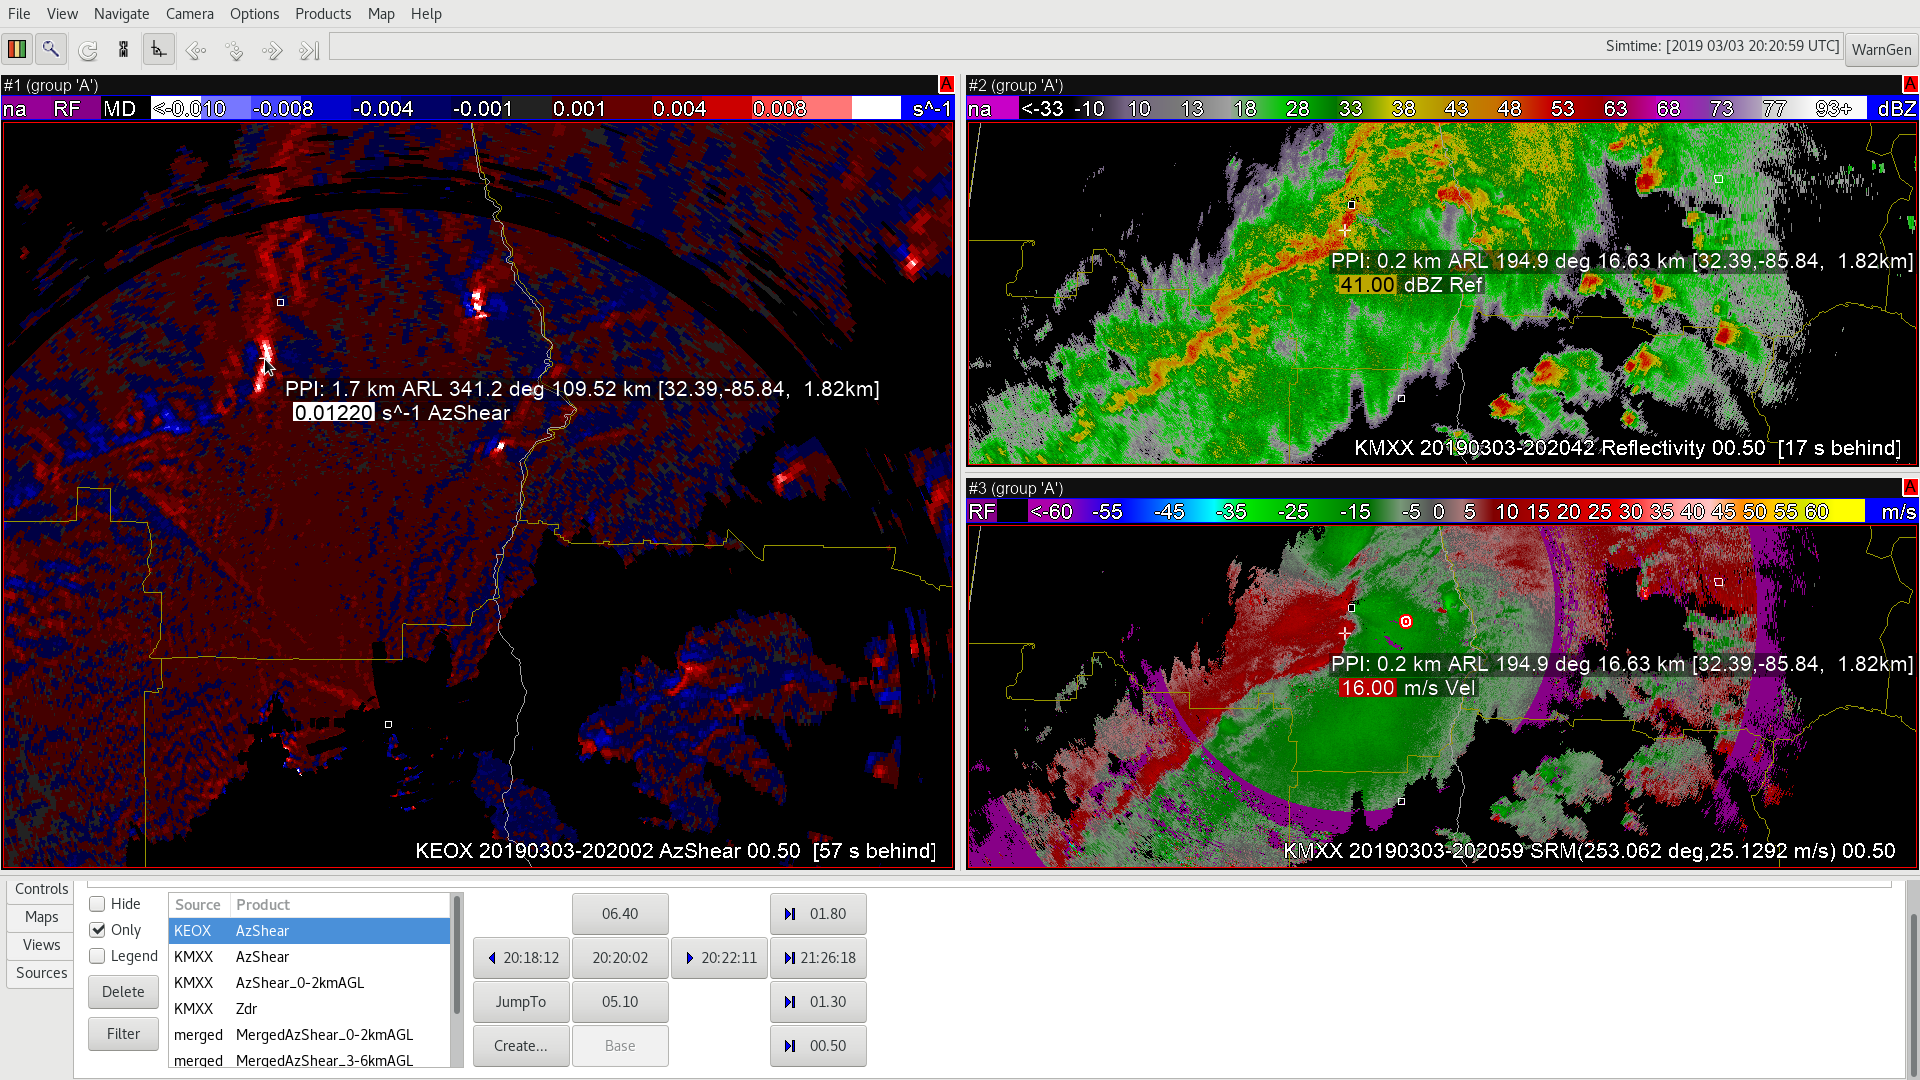
Two images above…KEOX radar had a different viewing angle compared to KMXX and it actually showed a brightness in the AZ_shear product way before KMXX. Its best to look at multiple single radars and look for developing AZ_shear circulations for better situational awareness. – Jake Johnson
The merged-TPW product compared well to the surface obs with 1) the strong gradient along the dryline 2) the lower PWAT values behind the MCS and 3) axis of greater PWAT along the immediate Gulf Coast. Actual values however were too high in the dry air (MAF/DFW) and too low in the moist air (DRT/CRP). Values compared to 12Z soundings at BRO the best.
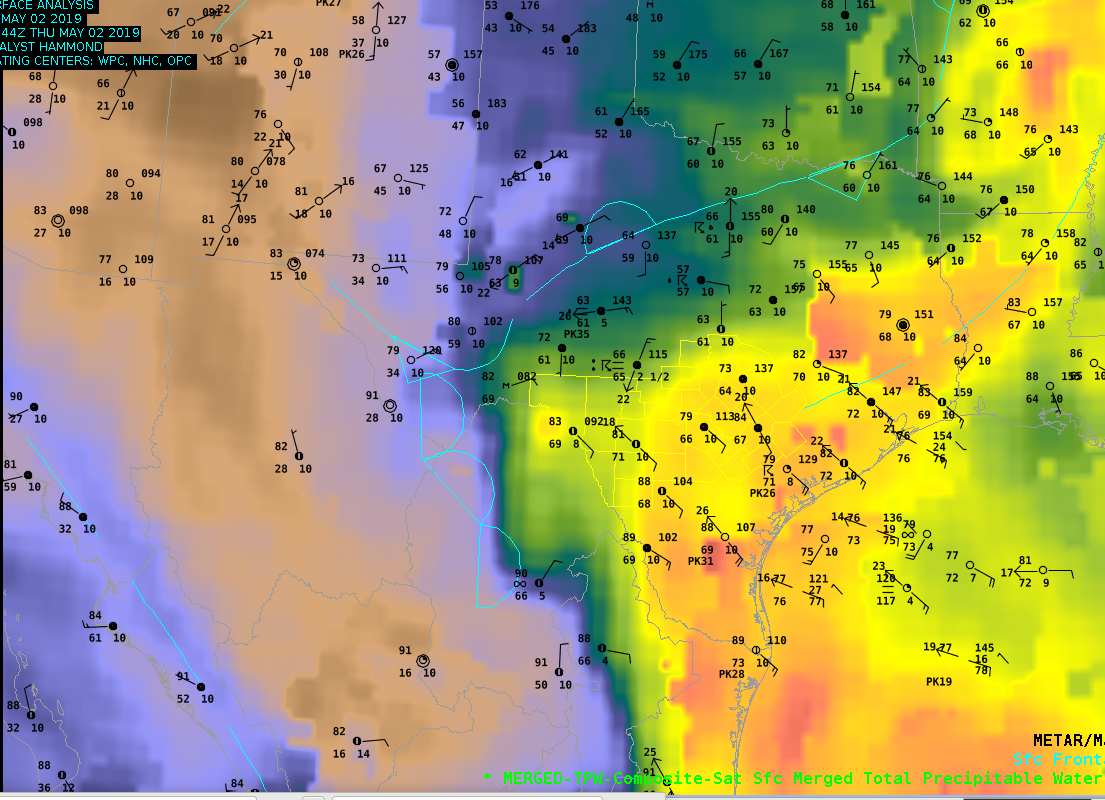
— SCoulomb
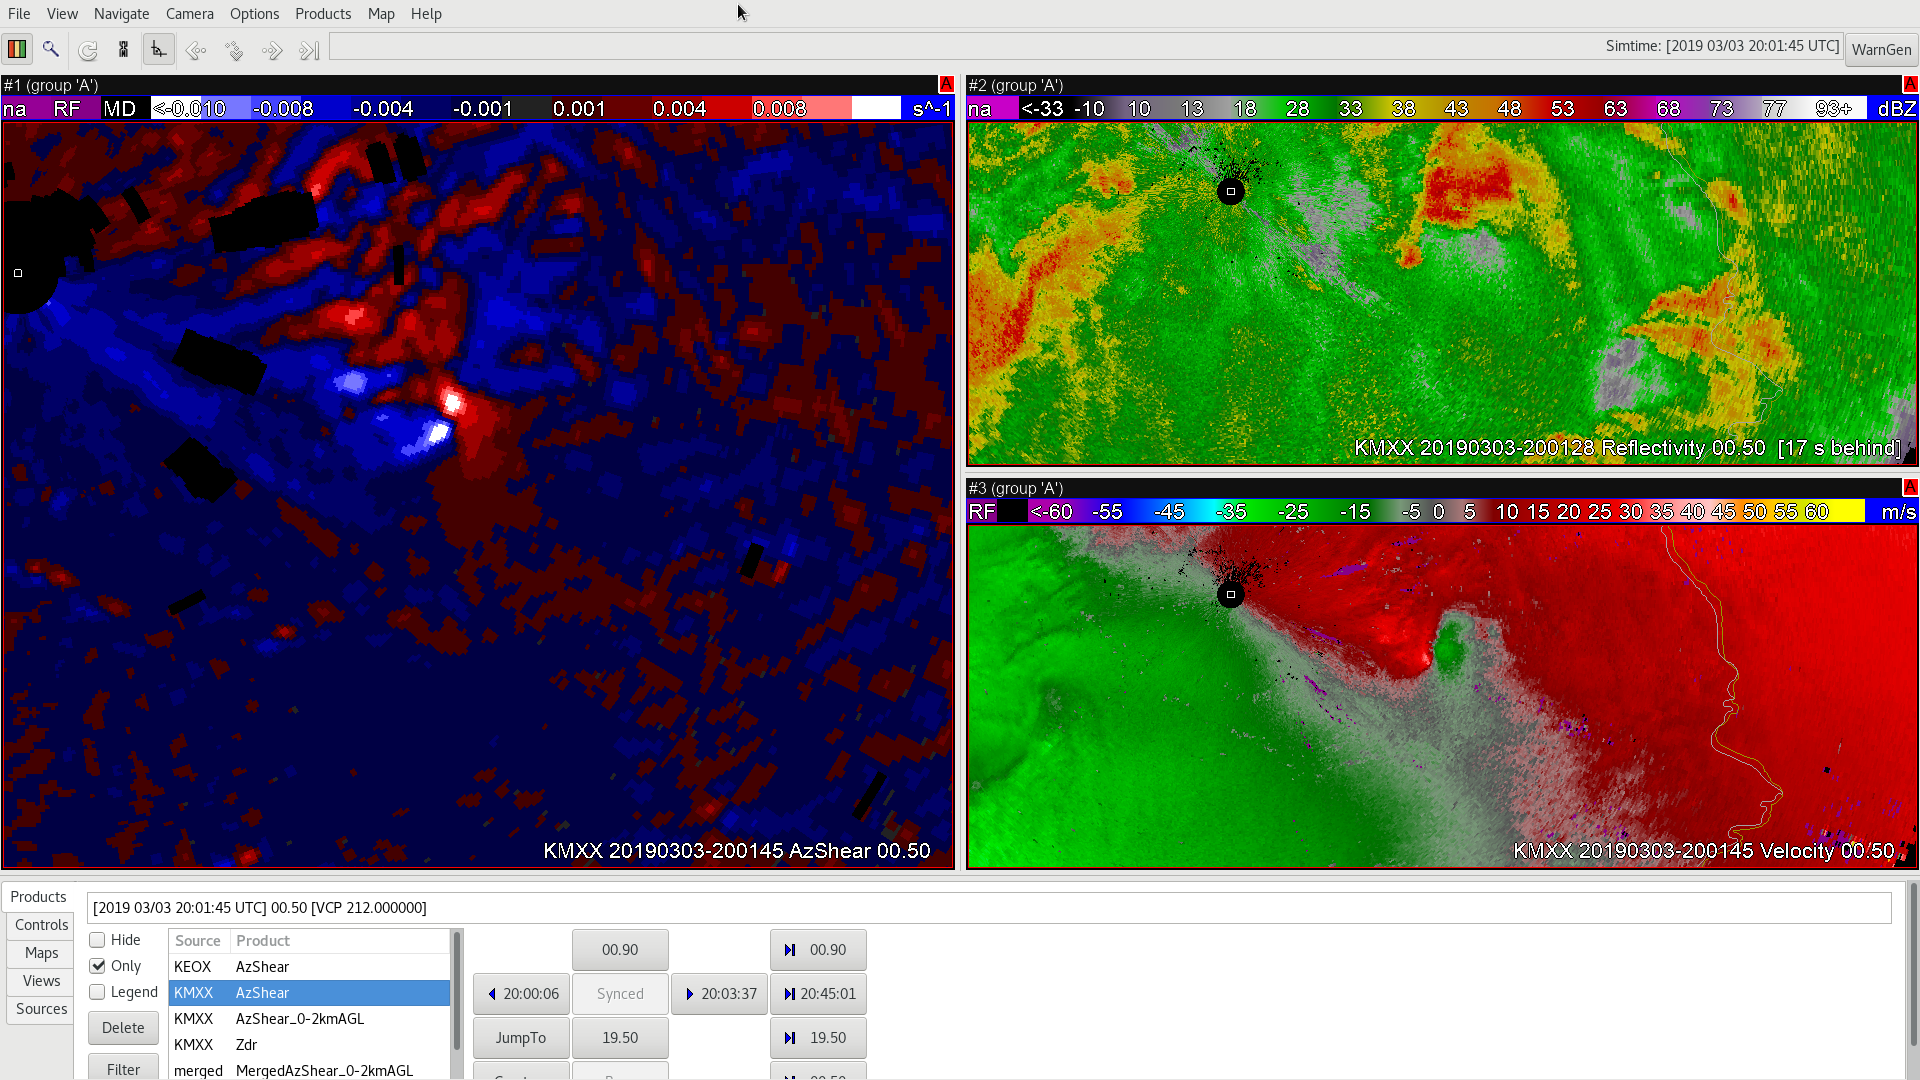
Figure A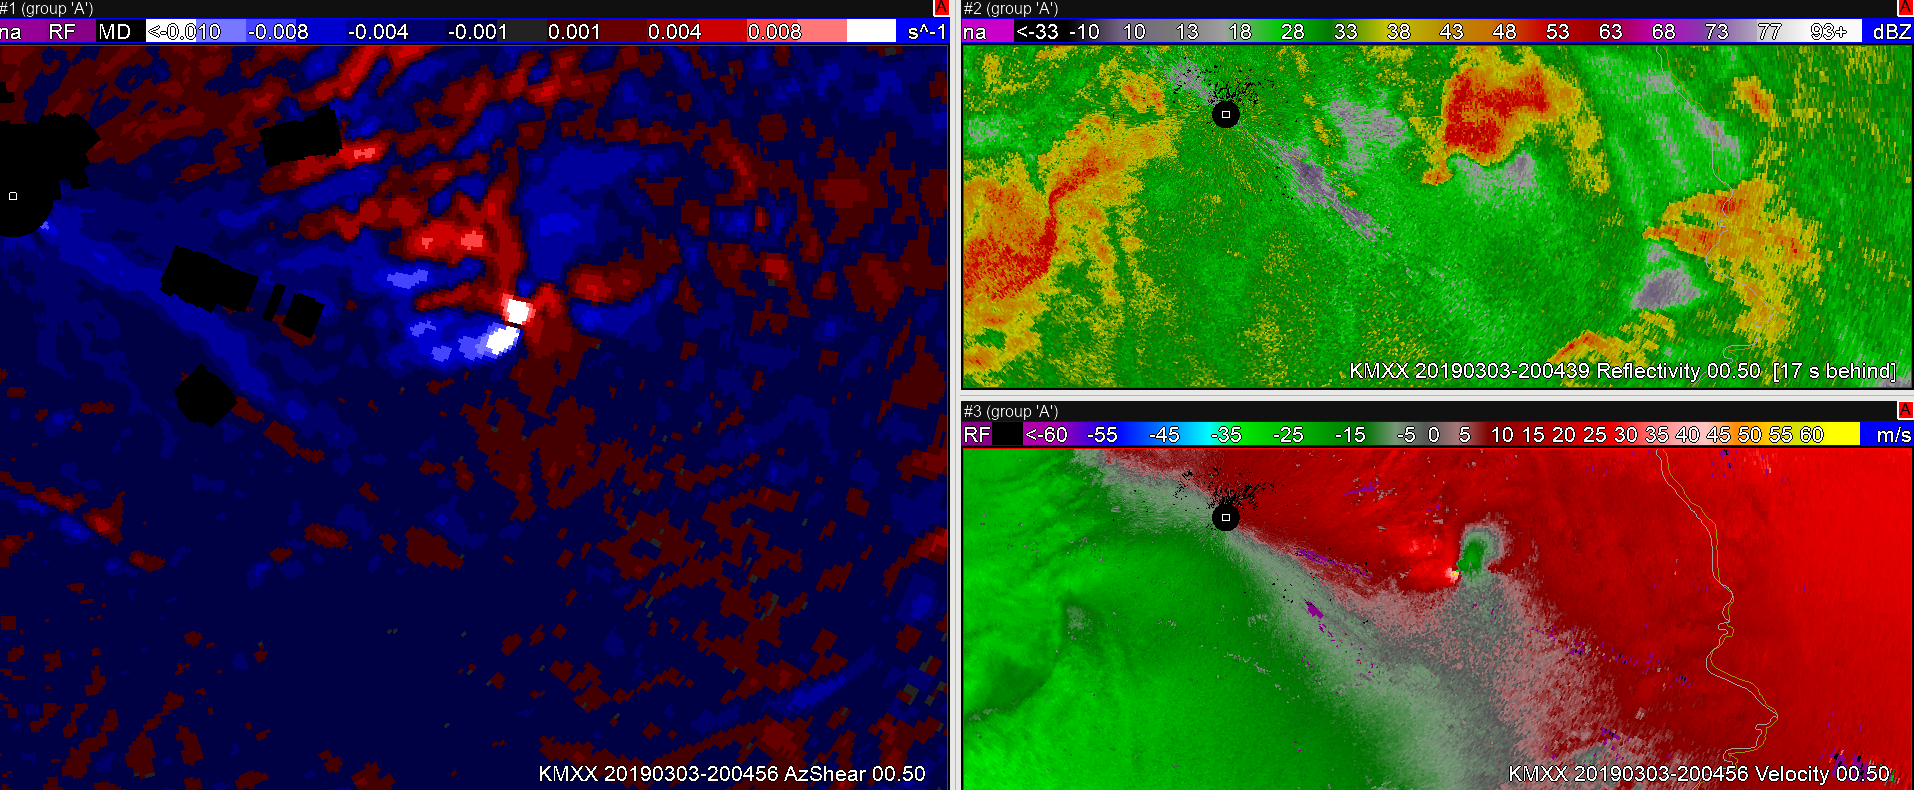
Figure B
AZ_Sheer product from KMXX shows developing shear circulation at max values in same location of zero iso-dop on velocity product at 2001Z in Figure A. Then at 2004Z velocity product shows a developed couplet while AZ_shear remains maxed out but grows in size. The AZ_shear in Figure A had the shear couplets further apart that became closer together in Figure B which is also the same time the velocity couplet first developed. -Jake Johnson