
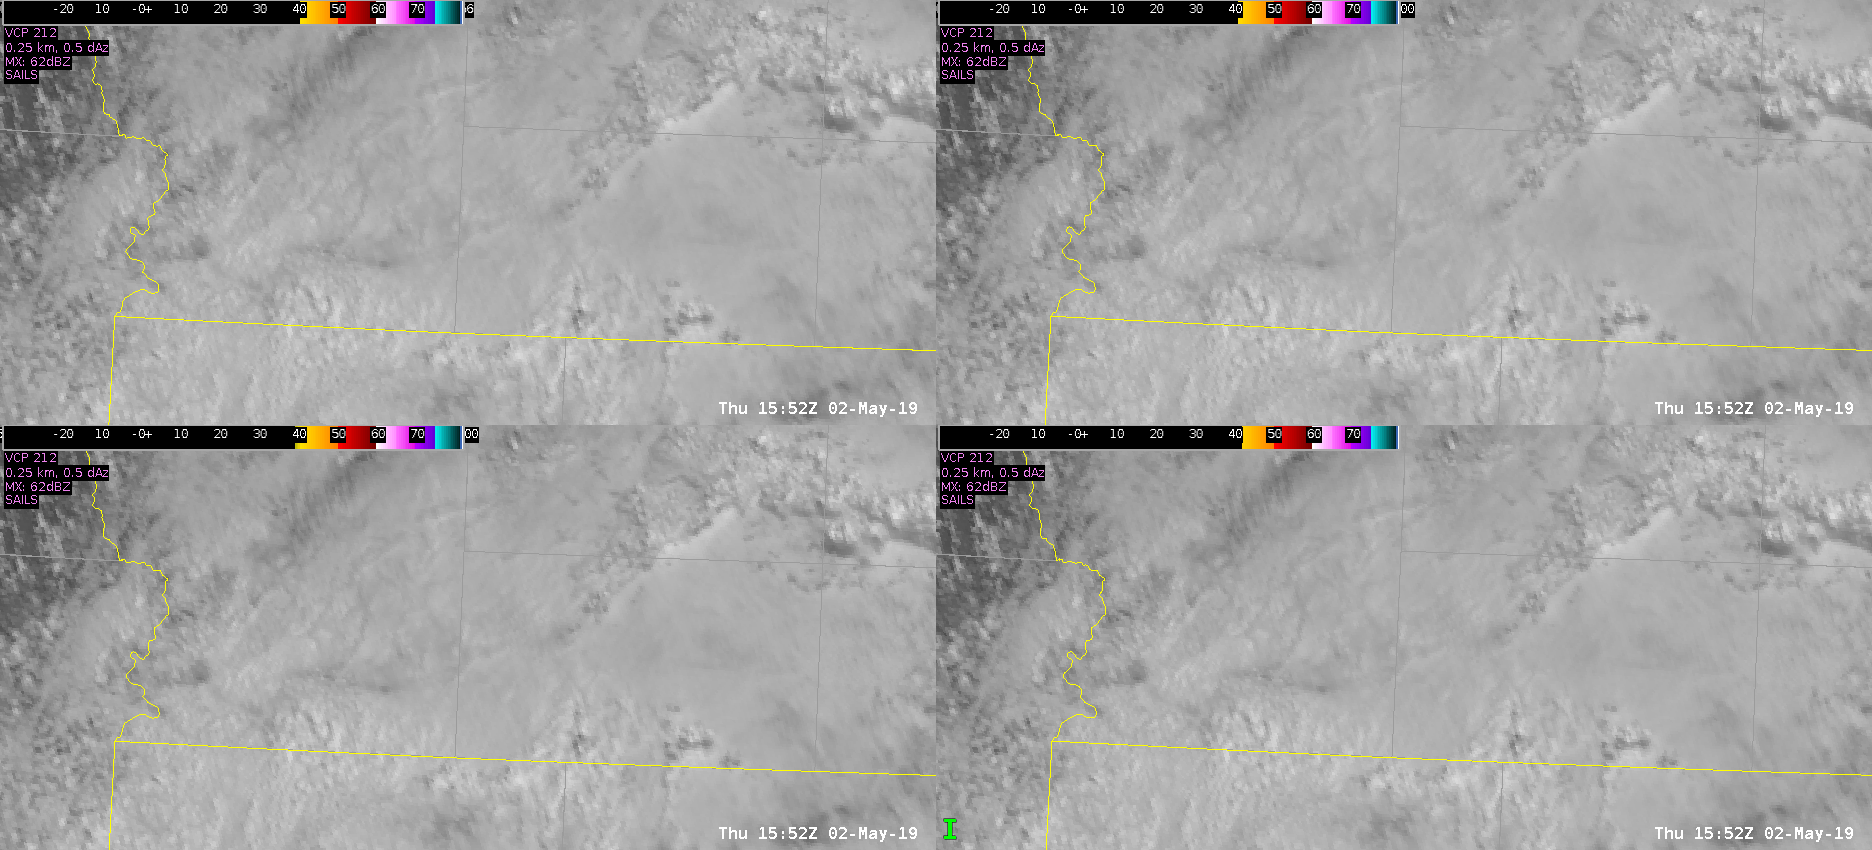
Full loop from CI through storm split. A good practice for GLM users overlaying with radar is to Alpha your color table below a certain range (in this case 40 dbz) to mask out low reflectivity values and focus on storm cores only. Because of the parallax error, the storm cores on GLM are displaced to the northwest of the radar cores – a hidden benefit for storm interrogation!
There are several things to note here. First is the onset of GLM data – this storm featured explosive development. The GLM data here is 5 min/1min update. Because of this, the upward trend is rather sudden – for early stages in deep convection it may be best to use 1 min data. As the supercell splits, the the different cores are most evident in the top left, which is Event density data. FED, AFA, and TOE do not snow this trend nearly as well. I chose not to include a loop of Minimum area, because this data was too low -resolution to capture details of different cores this close. 
This is a longer loop of the same event showing the storm through its demise. You can see the Average Flash Area in the storm in the bottom left really increase as this particular supercell diminishes. This is consistent with the idea that shorter length lightning in the core ceases and most of the remaining strikes are longer flash events in the residual anvil.
-Dusty Davis