
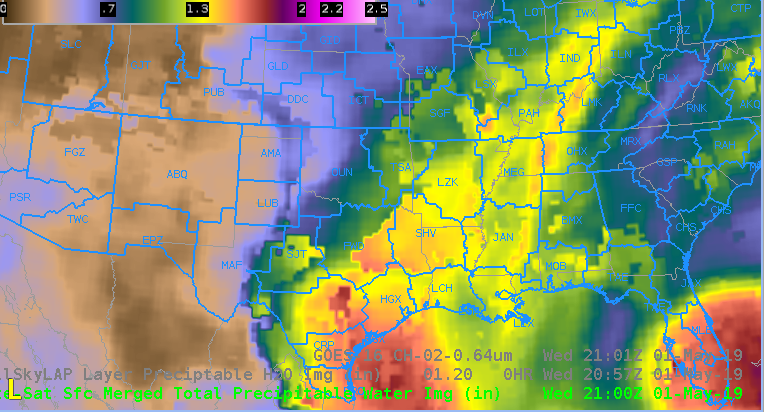
Figure A (CIRA Merged PW)
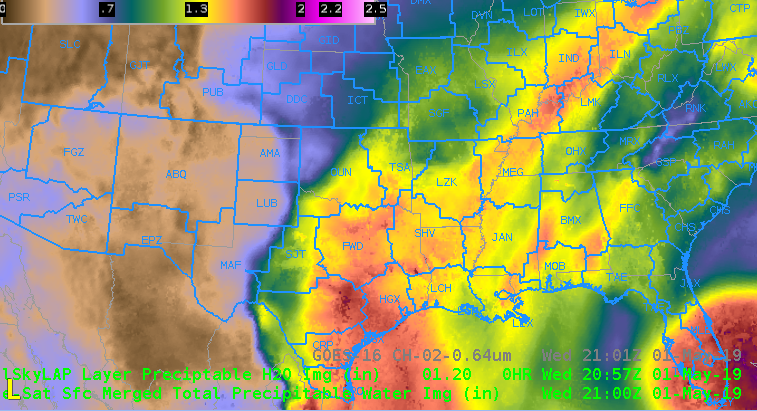
Figure B (All Sky Total PW)
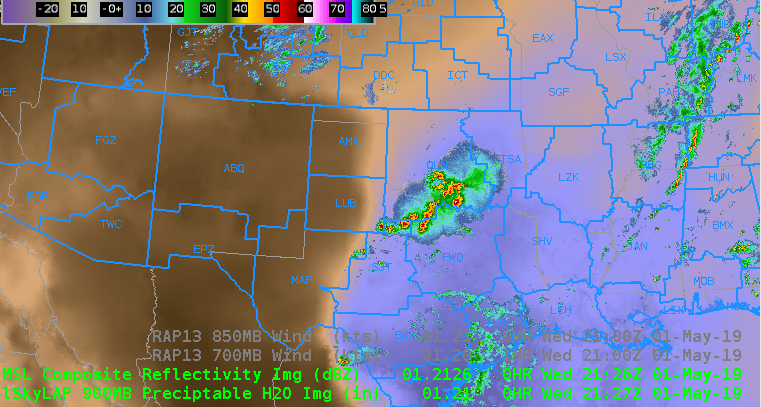
Figure C (All Sky Sfc-900mb PW)
Notice the big difference in Figure A compared to Figure B from DFW to OUN coverage area, Figure B with All Sky Total PW was handling the plume of moisture streaming northward much better. This also correlates well to area of deep convection in Figure C in the deeper moisture region. -Jake Johnson