An official website of the United States government
Here’s how you know
Official websites use .gov A
.gov website belongs to an official government
organization in the United States.
Secure .gov websites use HTTPS A
lock (
) or https:// means you’ve safely connected to
the .gov website. Share sensitive information only on official,
secure websites.
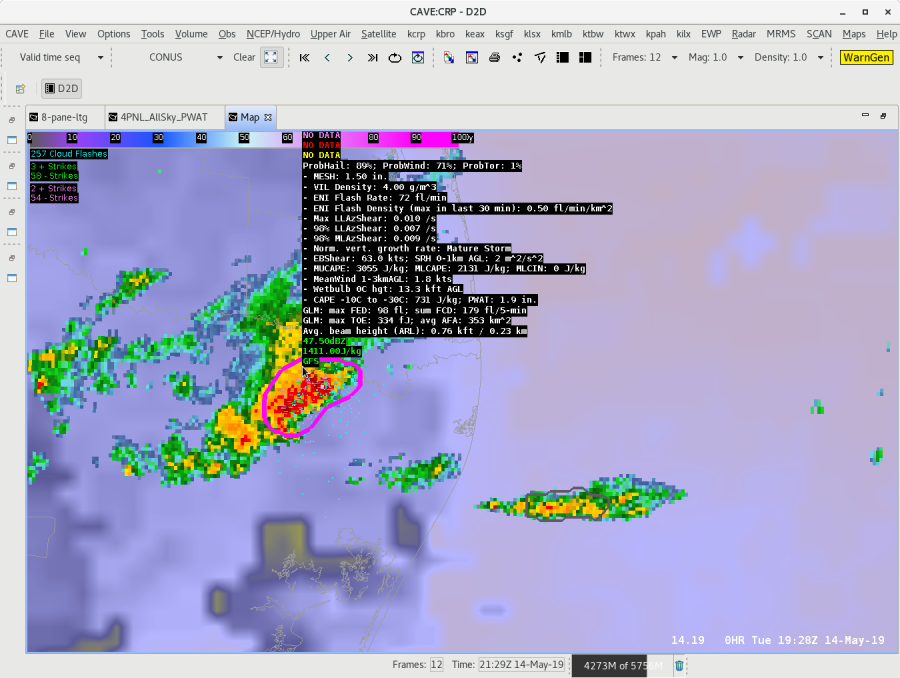
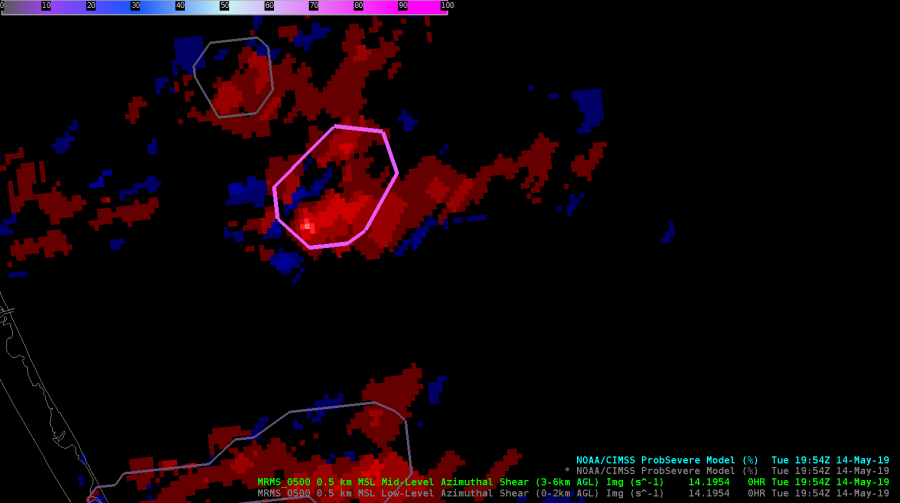
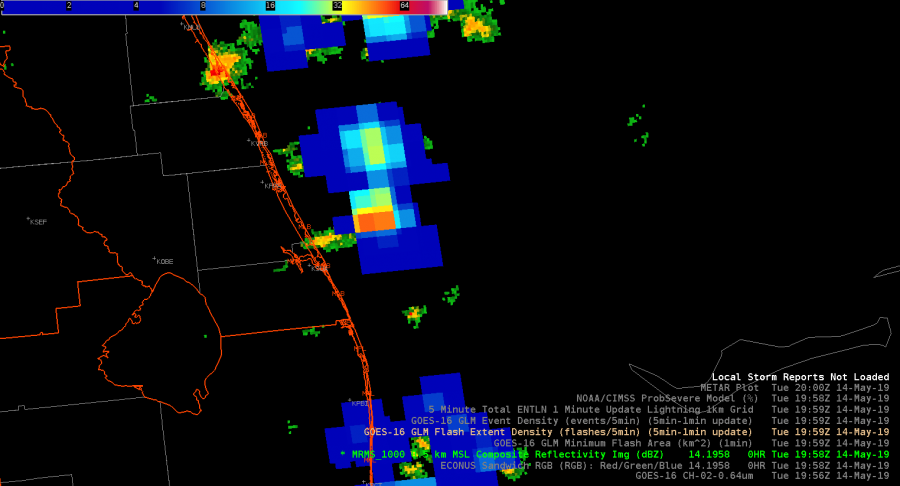
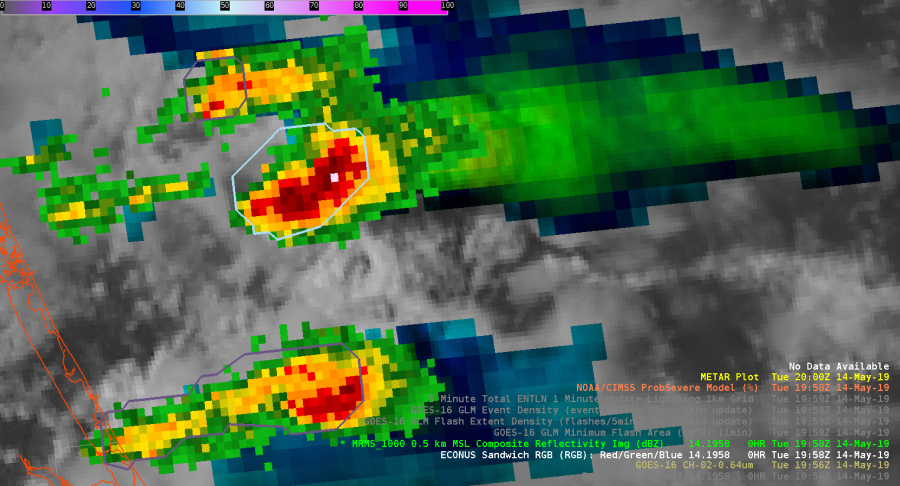
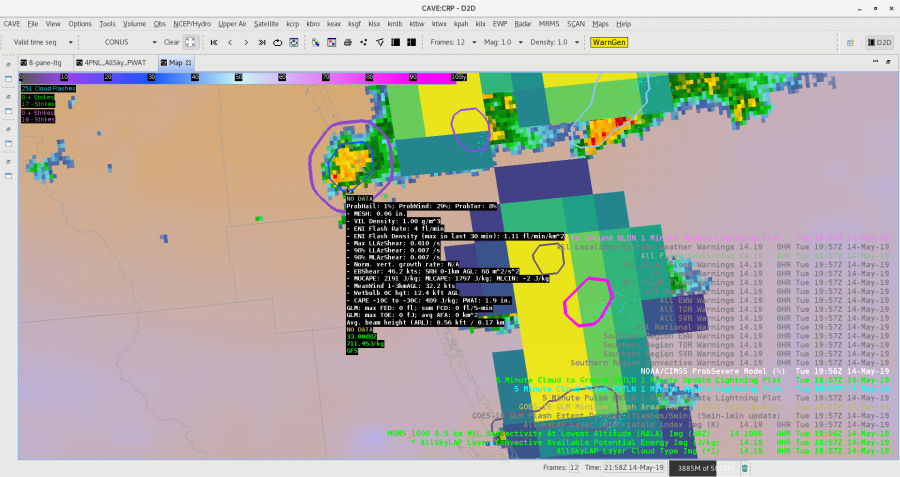
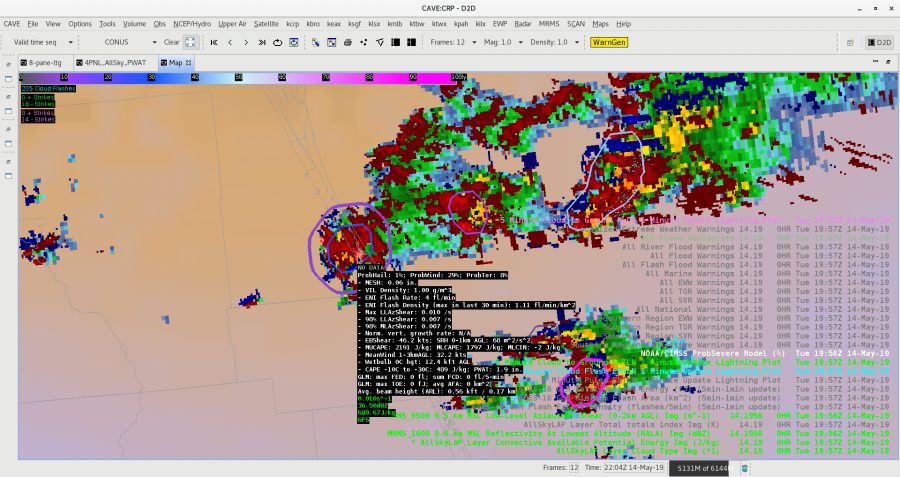
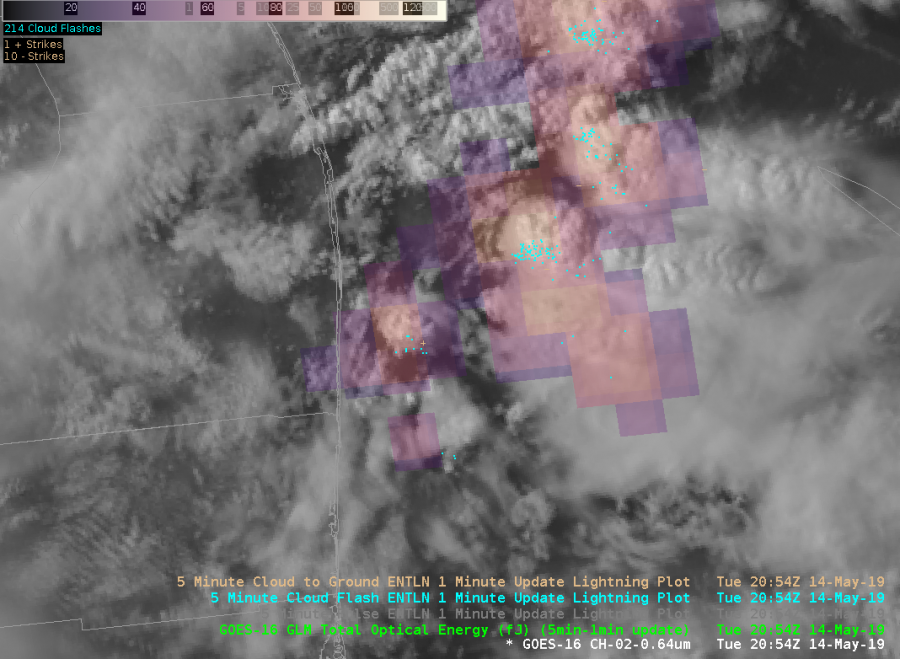
There is difficulty with having confidence of the ProbTor portion of the ProbSevere product due to an instance where it is estimating higher tor rates (8%) when a storm has no identified lightning (GLM, NLDN, and ENTI) along the coast of Florida. To be fair, the storm previously did indicate some lightning with it. I investigated the TOE, FED, and Min Flash Area in the vicinity of this storm, as well as usual point lightning data in 5 and 1 min updating intervals, and it has me confused as to what the ProbSevere is “seeing” for its lightning data (it is indicating ENTI lightning within its circle). Below is the image example of ProbSevere loaded alongside lightning data including GLM’s Min Flash Area:
I also pulled up the lowest level rotation tracks from MRMS data, and it did indicate a slightly higher maximum within the ProbTor circle, so I believe the ProbTor is locking on to that feature. – shearluck
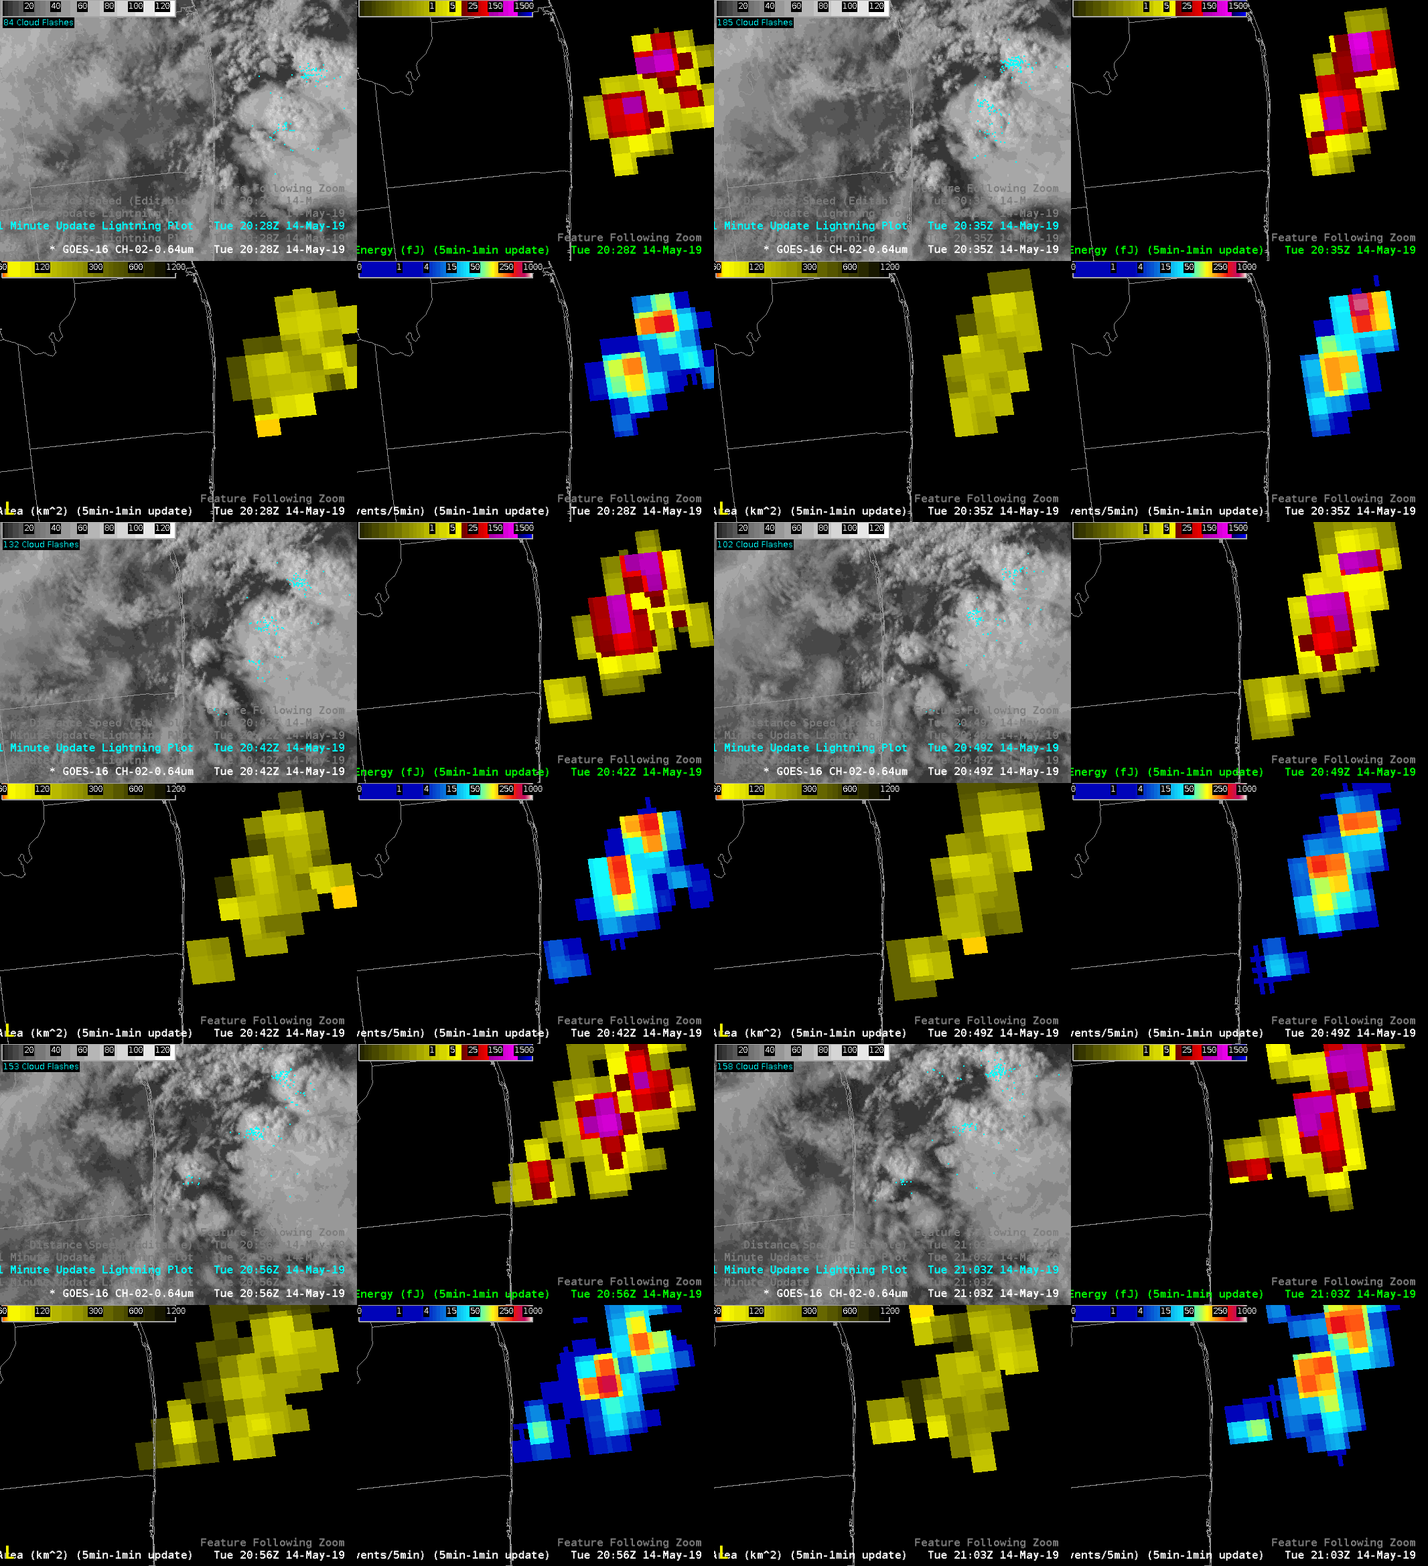
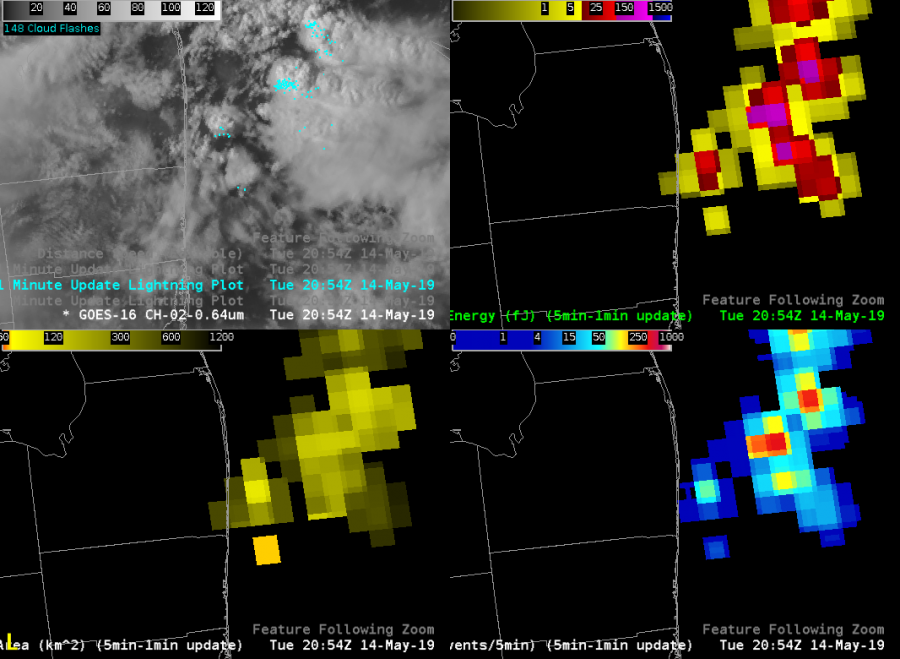
Upper Left: 1-minute visible with 5 minute cloud flash (1-min update)
Upper Right: Total Optical Energy
Lower Left: GLM Average Group Area
Lower Right: Event Density
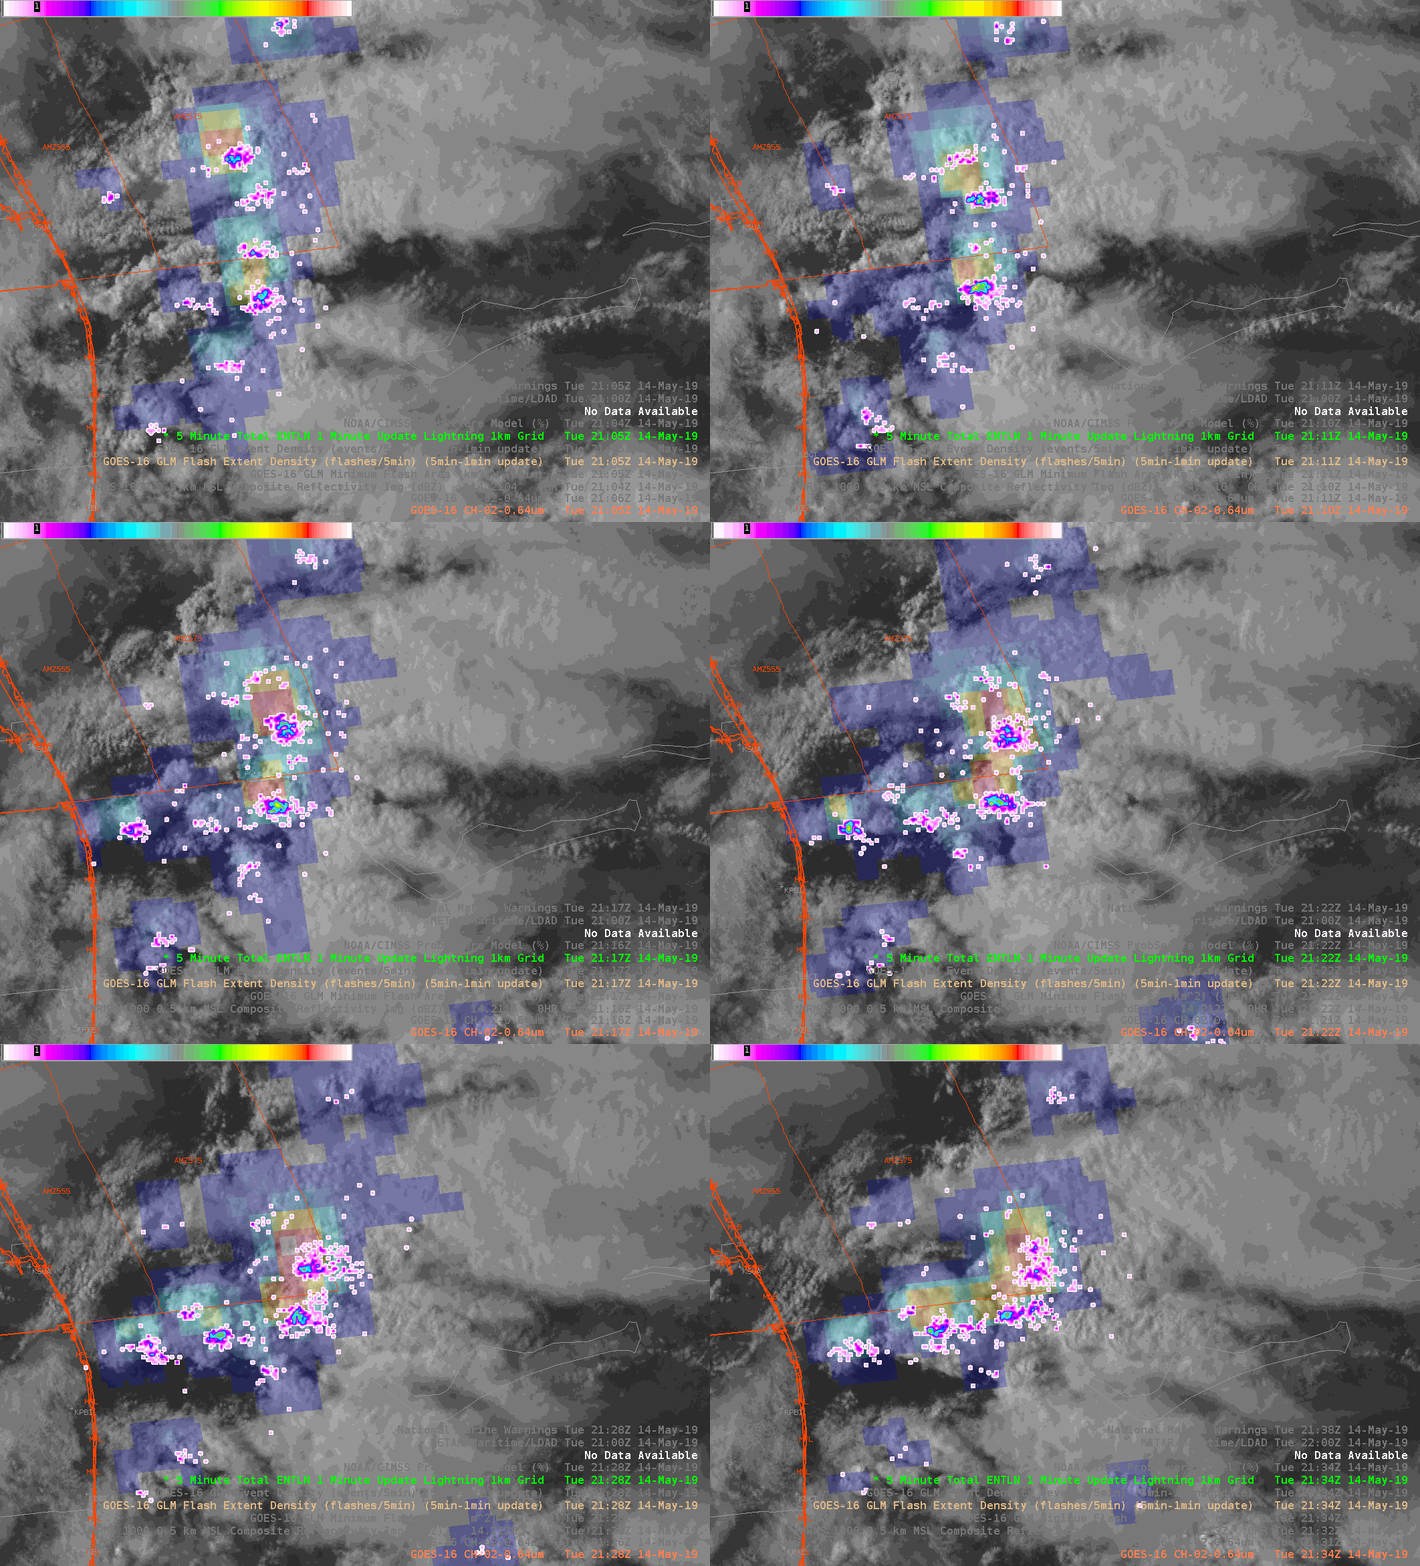
Bright yellow/orange colors on lower left depict a smaller average group area associated with a tighter concentration of flashes. We are intermittently seeing greater concentrations at the southern extent in an area otherwise associated with little activity.
Now taking a look at a specific time below…
We see a single pixel of orange (lower part of lower left panel) corresponding with a small group area. This appears to be associated with two fairly isolated ENTLN flashes (upper left). Total Optical Energy (upper right) and Event Density values (lower right) are not overly impressive, which is not surprising, given the limited activity.
Now for something else that’s rather striking (ha ha) in the eastern half of this area. ENTLN cloud flashes depict two active areas in the northeast corner but little if any activity to the southeast beyond that. Shown another way…
So, we see good connectivity in probable electrification from northwest to southeast that is not otherwise apparent in the flash data. So, I’m slowly coming around to the idea that this can be helpful for IDSS applications when lightning is a concern with multi-cell clusters featuring extensive anvil coverage.
Convection off the coast of Florida developed into a few organized strong to severe storms over marine zones. GLM Flash Extent Density (upper left) was far and away the most useful of the GLM products available for warning operations. The strongest storms were the most evident on this product compared to the others, and rapid lightning increases were most easily noted. This allows for quick use of the lightning data for situational awareness and setting priorities when there are numerous storms to interrogate. The other GLM products generally washed out any signal of which storms were the strongest, and didn’t provide as much information about overall storm trends.
The rapid 1-minute update times that can be linked with 1-minute meso sector satellite imagery and 2-minute MRMS data can allow for more rapid warning decisions (and thus more lead time) when all considered together with base radar data.
Compared to ENTLN 1km total flash data, there wasn’t much difference in warning utility between the two products. The same information can be derived from each product in terms of storm intensity and picking out the strongest updrafts. I would give a slight edge to the ENTLN in terms of product display as the smaller grid allows for better viewing of the background satellite imagery. However, the spatial extent aspect of the GLM has advantages for public safety messaging. So overall a very even match between the two products.
When utilizing the AllSky CAPE image product (MLCAPE), and comparing it to the ProbSevere MLCAPE values for reliability purposes of both tools, it is noticeable the differences between the two when there’s precip. This is due to the fact that most rain areas will not be able to be sampled by the satellite (clear/cloudy), and will be utilizing the GFS data in these areas where ProbSevere is located.
One way around this difference reliability issue is to scan the surrounding areas that are utilizing satellite data (preferably a “clear” spot), and in those cases, the MLCAPE values sampled seemed more comparable to the ProbSevere MLCAPE (RAP) of the storm than that of the GFS sampled MLCAPE data. The GFS sampled locations almost always show a lower MLCAPE value than the ProbSevere MLCAPE. The downside of sampling farther away from the storms/precip areas is that you are sampling rather far away from the storm environment. It’s also difficult to say that the ProbSevere MLCAPE is more accurate or not and what the reliability factors may be.
Below is an example of a storm over TX that is sampling the MLCAPE of the GFS (green text) and of the ProbSevere RAP (white text). -shearluck
Tested out the legacy (upper left), digital (upper right) and new (lower left) meso detection algorithms on a supercell off the Florida Coast. Tracking of the NMDA performed admirably on this cell from scan to scan. However, I was not seeing elevated icon statuses (thicker circle, or cross haired circle) as the meso strengthened and became strongest in the low-levels. Perhaps this was just an Awips display issue, but overall I would give an edge to the DMDA in term of overall usefulness because of this issue.
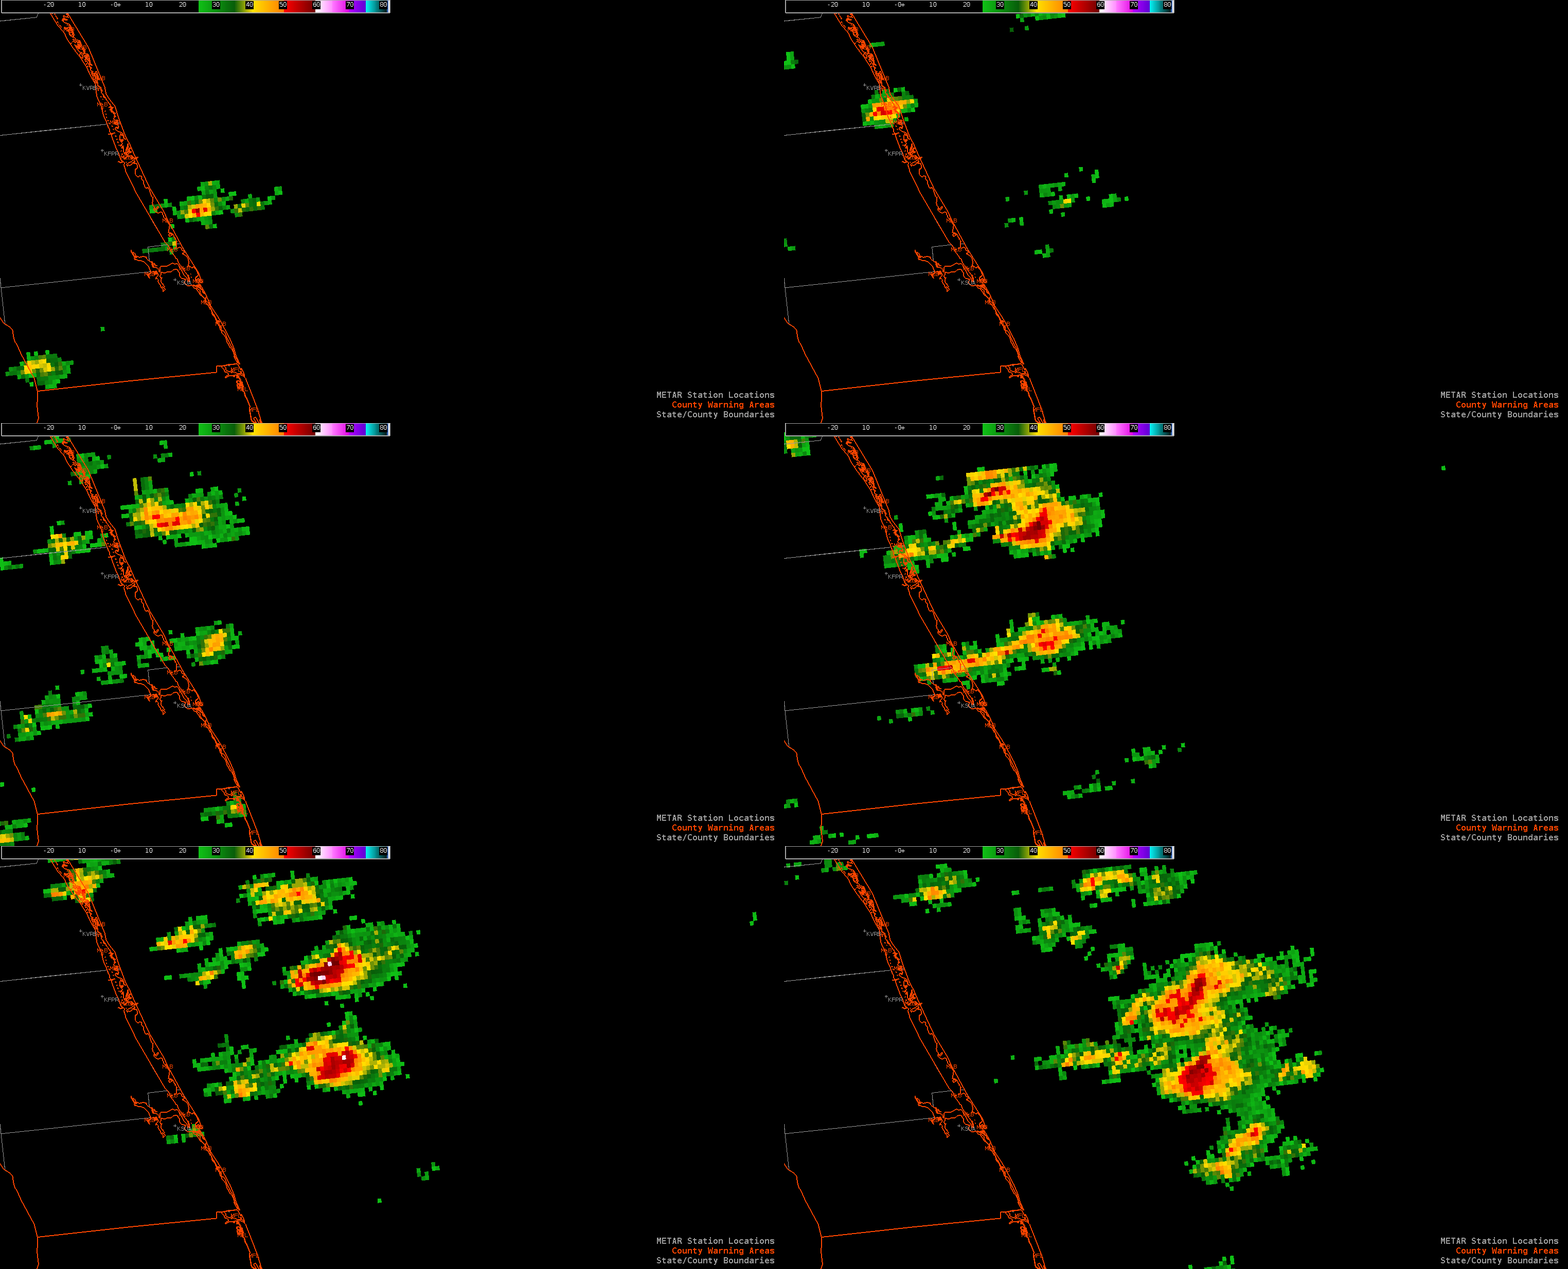
There was a nice area of convection moving off the east coast of Florida with storms forming off an apparent outflow boundary moving to the south. As the storms moved off the coast they increased intensity exponentially. Focusing on these storms as they moved over water reflectivity showed max dBzs in the low to mid 60s with tops 45-50k ft high. GOES-16 Event density (5min-1min update) showed a value of 247 suggesting a nice updraft, which AzShear seems to further support with a bright white color and value of .007s^-1 exactly where the max dBzs/echo tops/GLM data is. In addition,prob severe did a good job of tracking the storms…but with the storms moving off the coast it is impossible to get any storm reports to verify its accuracy.
Utilizing all of this data I would most definitely want to issue a localized small craft or some sort of marine advisory or warning…if there was one for this are. -Desmond
When life hands you lemons (or for that matter, a bleak, moisture-starved convective environment draped over the entire CONUS) we can still make lemonade on this particular day by focusing on the Gulf of Mexico.
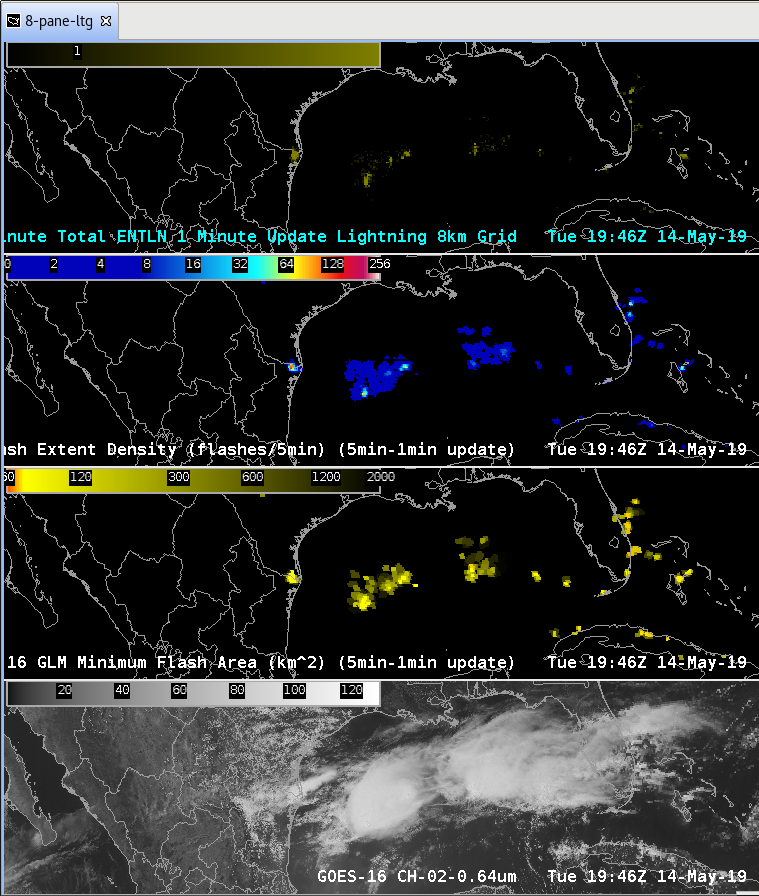
A question I’m asking all week when evaluating experimental products is: “How does this meaningfully improve upon what’s already operationally available?” My initial impression of GLM was that it’s merely duplicating efforts of ENTLN (except of course over the ocean where it’s unquestionably important given the lack of ground sensors exist). One of the better examples of this I’ve seen is below. In the panels below, looking south of Mobile, we see a much weaker signal in ENTLN total lightning grids compared to off the TX coast, whereas Flash Extent Density shows much more similarity between the two areas.
Another thing that was pointed up during discussion this morning: ENTLN pulse detection efficiency is *highly* variable across even the interior CONUS. This is because sensors are more clustered around metropolitan areas and therefore the number of pulse detections (and to a lesser extent, flash detections) can fluctuate quite significantly for completely non-meteorological reasons. So, I’m becoming increasingly convinced that GLM data might be a more useful sanity check than I previously thought.
Part of this experiment is to evaluate minimum flash area (botttom pane). To be continued…
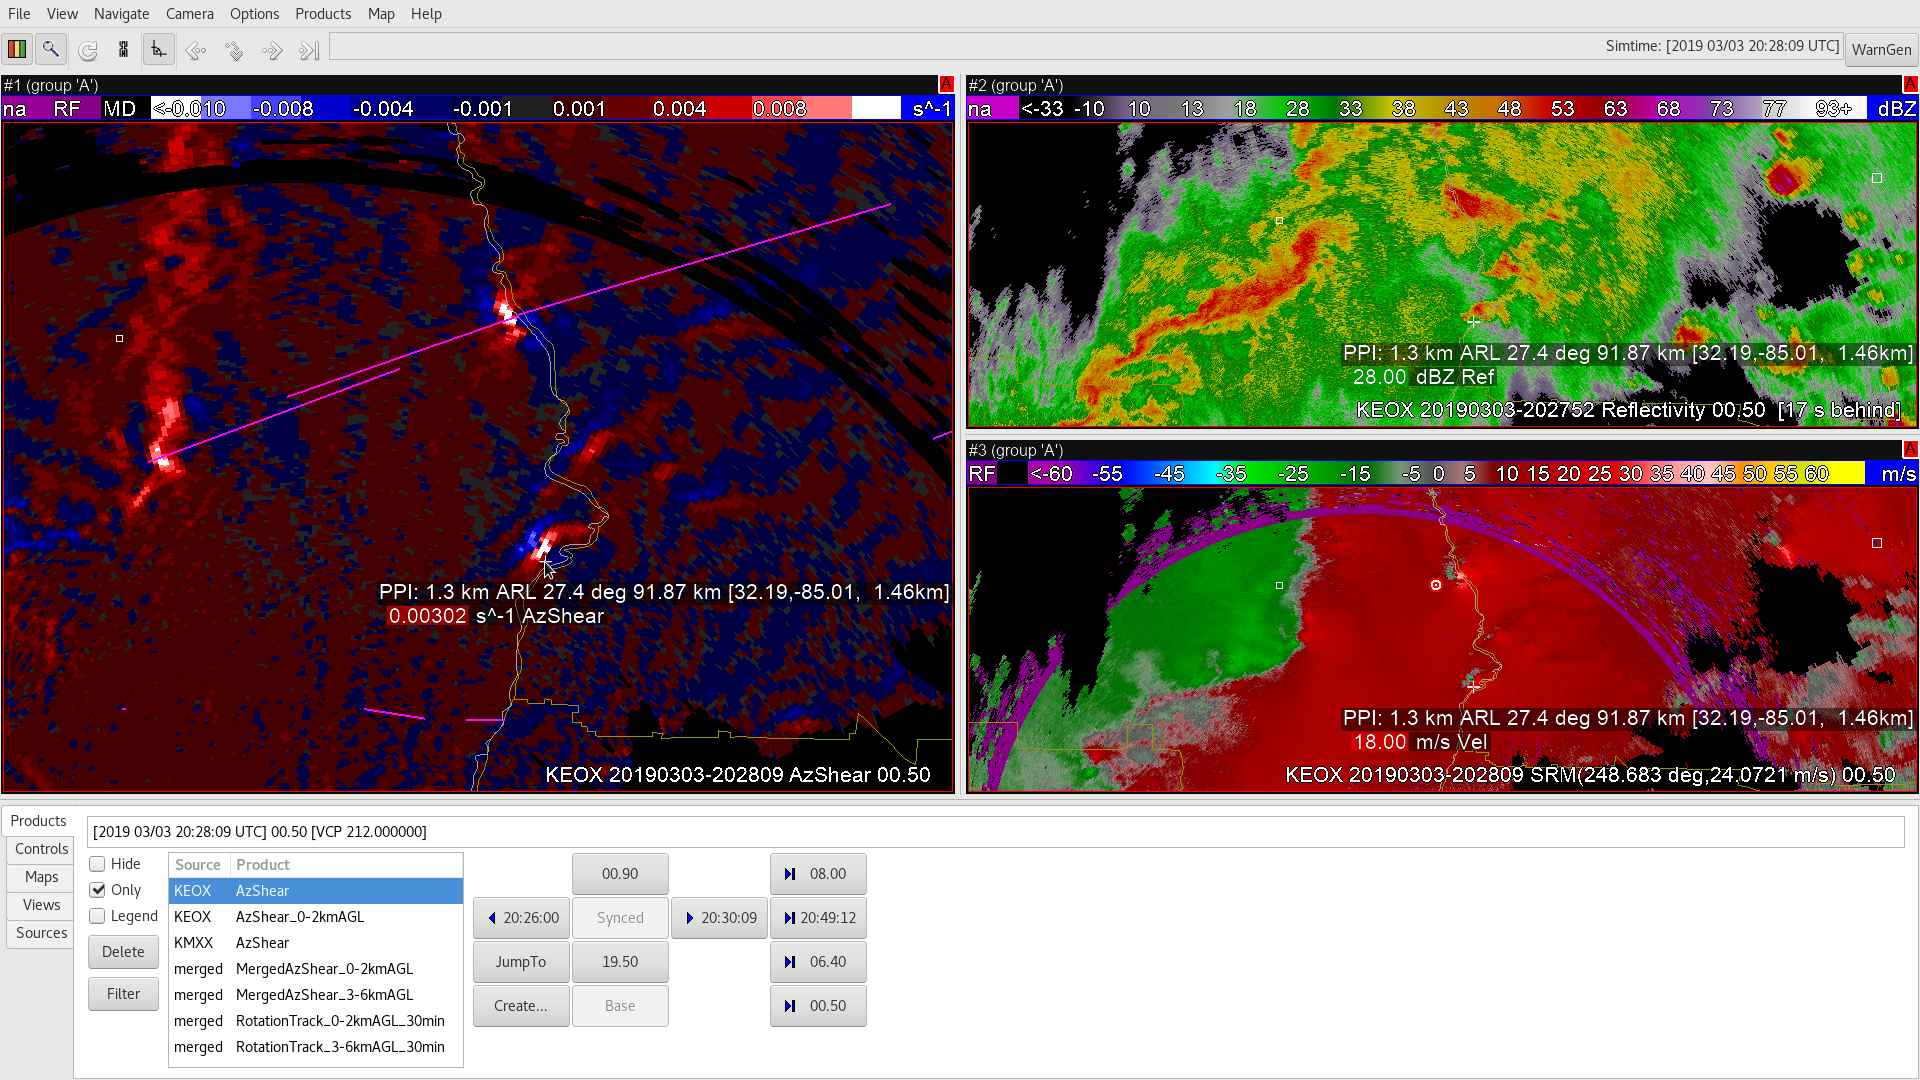
In one case of a tornado embedded within the QLCS, the AzShear signatures from both radars were nearly 100 km away. In both instances, the signature was displaced northward from the tornado path. From KEOX, the tornado path was 107.8km from the radar and was looking at approximately 1.8km up in the storm. From KMXX, the storm was 89.9km from the radar and looking at 1.4km in the storm. Something to consider for training is the distance from the radar and any tilt from the storm.
KEOX AzShear, Ref, SRM at 2036Z.KMXX AzShear, Ref, SRM at 2036Z.
Also interesting, is that KMXX, looking slightly closer and lower, shows a stronger AzShear signature than KEOX (0.016 s^-1 vs 0.006 s^-1). So, still a best practice is looking at multiple radars if looking at single radar AzShear, or look at the MergedAzShear 0-2km products. However, it has been noted that the mergedShear products may be more useful for QLCS type storms, vs. supercell storms.
_____________________
A little while later…
A long-tracked supercell ahead of the line exhibited very high AzShear values early in its lifetime (as high as 0.03 s^-1), but as the storm moved away from the radar, the AzShear values tended to decrease. At first, it was thought this was merely coinciding with the distance from the radar (160km at time of first image below) and how high in the storm the radar is looking (3km), however, there may also be some information about the strength of the tornado at that distance. At 160km, the AzShear strength dropped to around 0.006 s^-1. However, a short time later, there was another strong AzShear signature (>0.01s^-1) just south of there, that was also associated with a tornado path. This signature was also at 160km from the radar. Curious if it could be surmised that the northern long-track tornado was not at strong as the southern shorter track? Also of note, the southern signature was again north of the assessed tornado track.
KEOX AzShear, Ref, Vel at 2100z (Focus on end of the northern long-track tornado)KEOX AzShear, Ref, SRM at 2120Z. (Focus on southern tornado track signature)
While MRMS Az Shear product is useful for situational awareness of stronger storms, the jumpy nature of the updates degrades its usefulness in storm interrogation. Would really like to see single radar Az Shear in real time, as it would greatly compliment the base radar data interrogation.
Attached below is one example where the AzShear from a single radar/single tilt (KEOX 0.5deg) is indicating a comparable magnitude couplet with one storm as it is for the known tornadic supercell just north of it. The important item to note here is that both of these couplets are fairly far from the radar at this point, which means the AzShear is being impacted by elevation. This would be a good case in which having a different color scale may be of use to determine the differences in strength of the couplets. This is also a case to make sure to utilize the closer radar and not rely solely on one radar that may be primarily farther (if possible). In addition, this similar intensity in couplets is significant in recognizing that a tornado may not be observed even though the couplet is identified from one specific radar in case there is not a closer radar at the time.
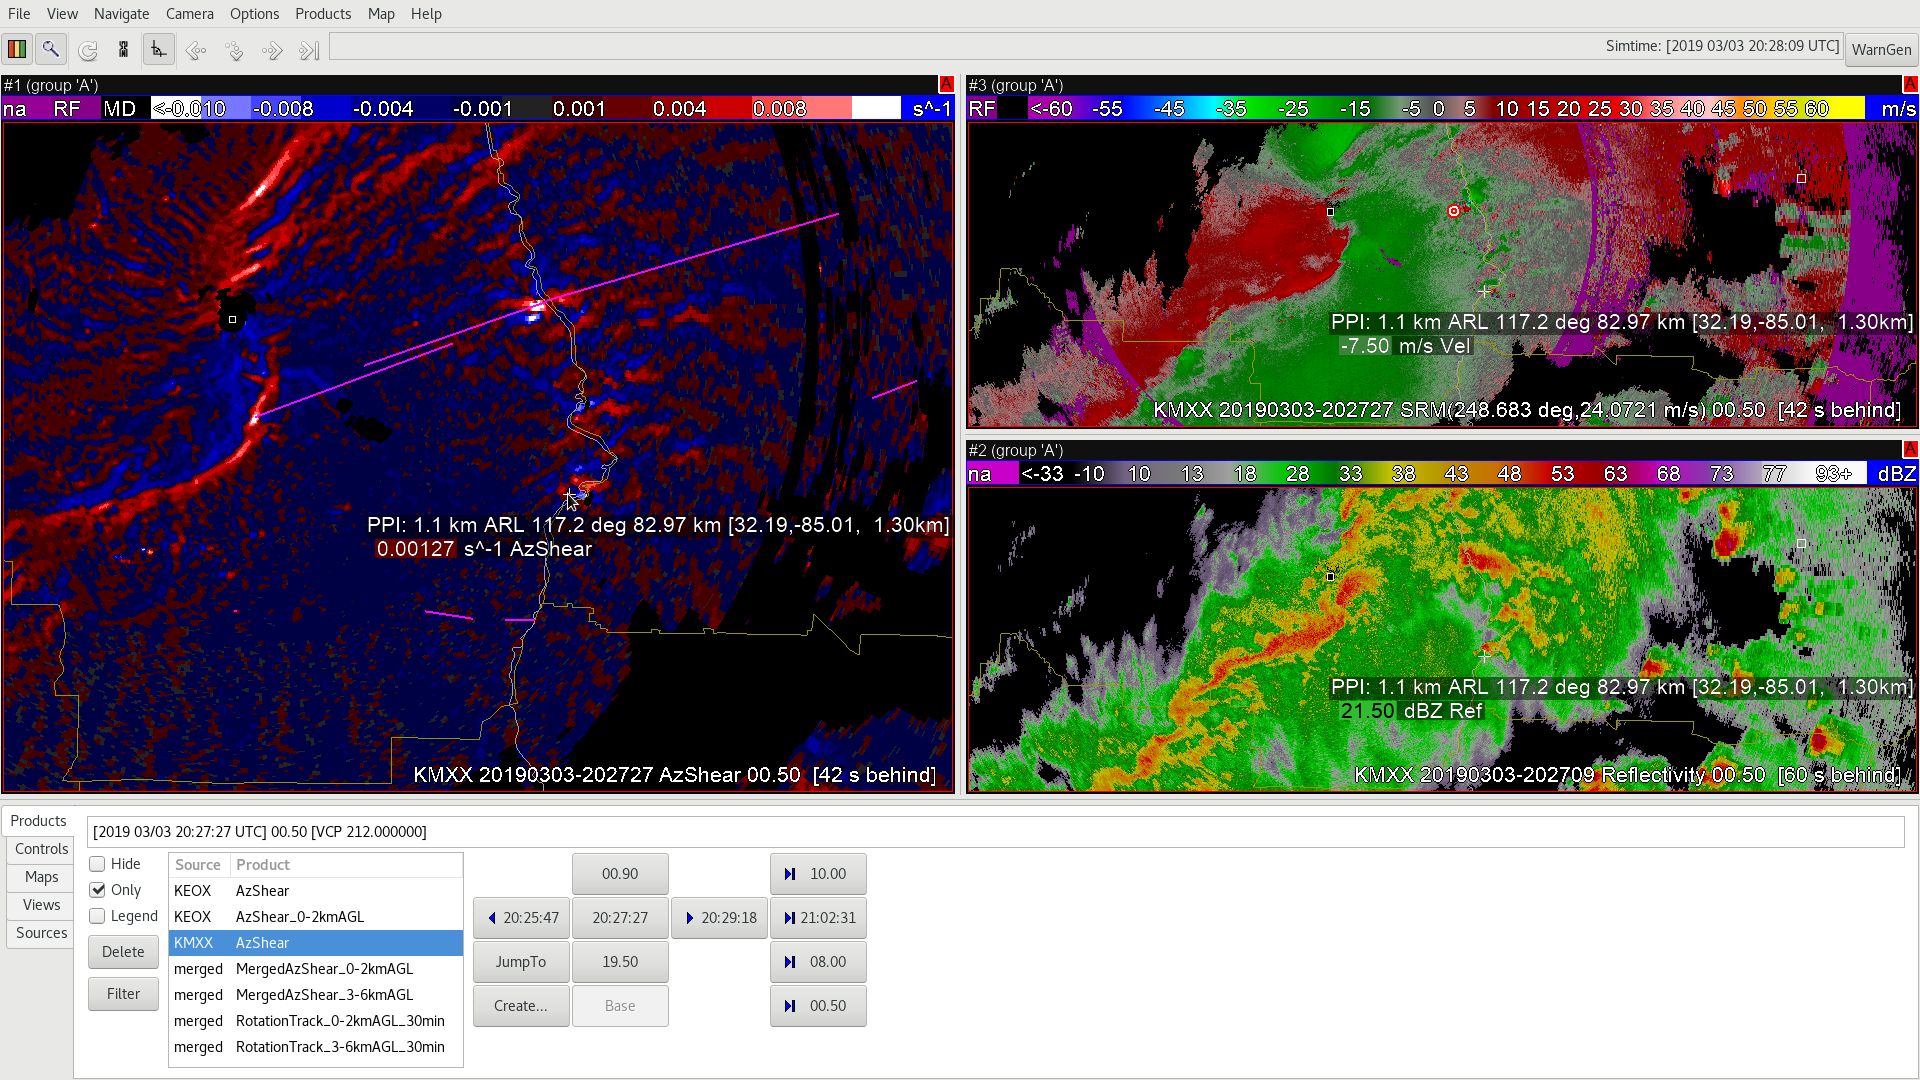
Below is the same circulation at the same time, but now identified by a closer radar (KMXX 0.5deg). The difference in magnitude of the same couplets are quite apparent.
Another area to note between KEOX and KMXX is the QLCS feature, where the closer radar is able to detect better resolution of the low-level AzShear features of the line compared to the farther radar. The farther radar is clearly sampling a higher elevation/swath of time creating a broader region of maximum AzShear. Both the merged 0-2km product and the single radar AzShear product can be helpful in seeing the vertical structure of the AzShear for this line. What’s also important at this time is the tornadic track (pink) begins around this time of the circulation.
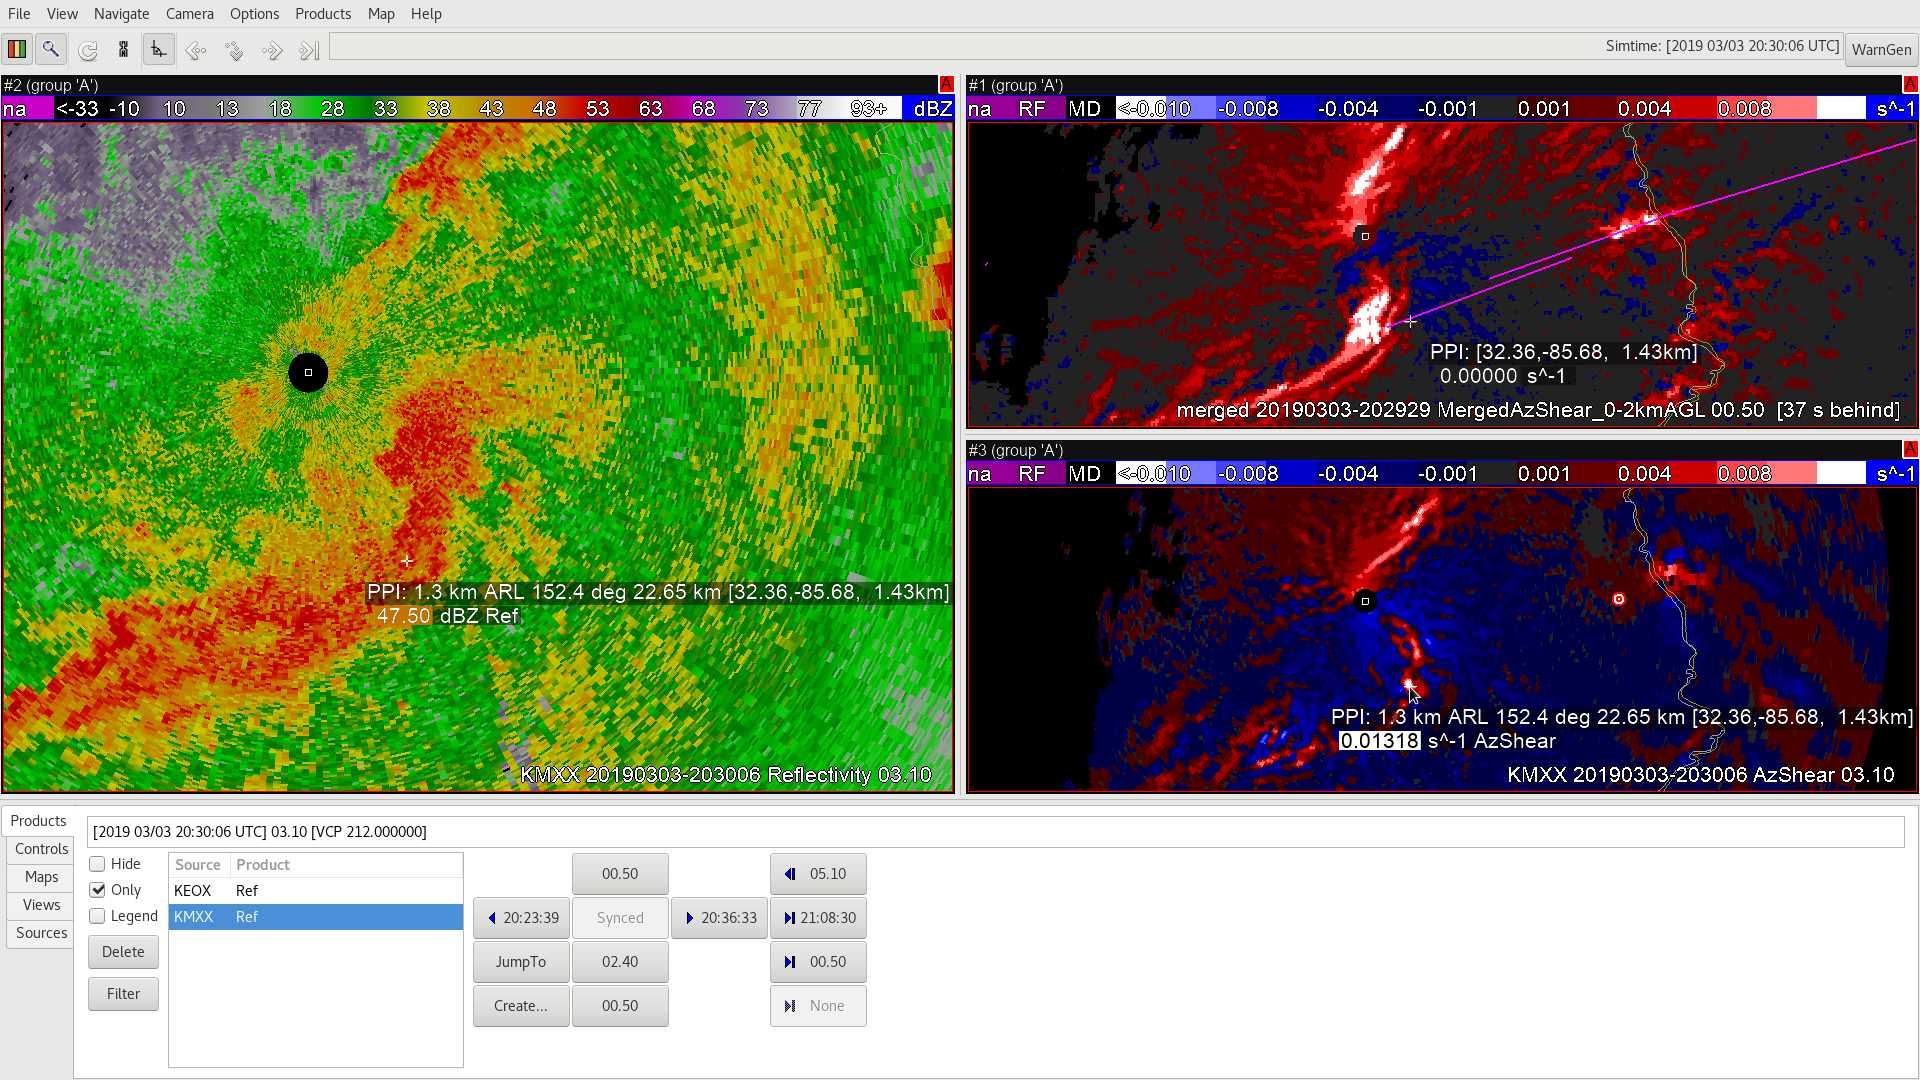
The QLCS feature in the single-radar AzShear has a better focus and greater “resolution” of small-scale features, versus the merged 0-2km AzShear product. See image below and the mouse location of the center. The maximum center is also farther ahead of the maximums in the merged product, which is important to realize when issuing a tornado warning. Also of note, the supercell to the northeast that is producing a tornado track is indicating multiple AzShear couplet maximum locations for the merged product (above right) vs the regular AzShear product (lower right).
I, personally, find the single-radar AzShear product closest to the radar the most useful for identifying a potential for low level tornadic circulations. I would use the 0-2km merged radar product as perhaps a “big picture, earlier lead time” type of product during the initiation stage of features. -shearluck



 So, we see good connectivity in probable electrification from northwest to southeast that is not otherwise apparent in the flash data. So, I’m slowly coming around to the idea that this can be helpful for IDSS applications when lightning is a concern with multi-cell clusters featuring extensive anvil coverage.