Severe storm review looking at PSV3 vs VS2 and Octane

We were watching a storm as it pushed from New Mexico into Texas. First looking at Octane speed we quickly identified a cell with good speed shear as it pushed from Curry County into Parmer County. This is one great application of Octane. The ability to identify the cell with the biggest potential to become severe in a cluster of storms.

Looking at ProbSev V3 you can see the values for hail compared to V2 are very similar at the end. However, the bigger thing we noticed is that V3 picked up on the hail much earlier in the event compared to V2. We also noticed the chance of tornadoes in V2 was nearly zero while V3 was almost 20%. Looking at velocity I would agree with V3 as we did see some good rotation in the low to mid levels. As of this writing the storm has produced at least 2 inch hail.  

-Thunderstruck

Tags: None

HWT Day 2 Tuesday Thoughts

OCTANE

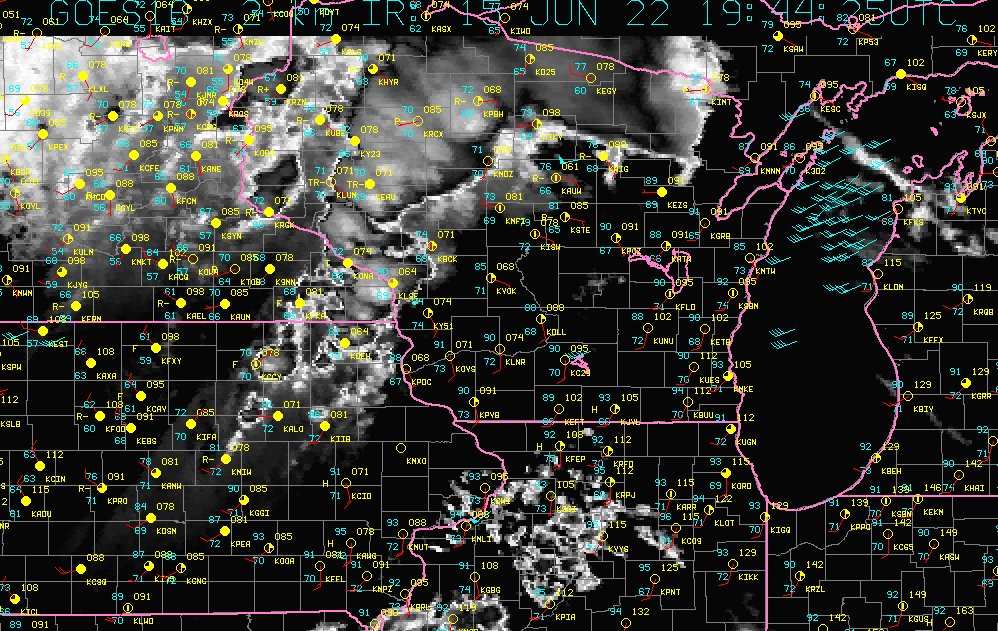
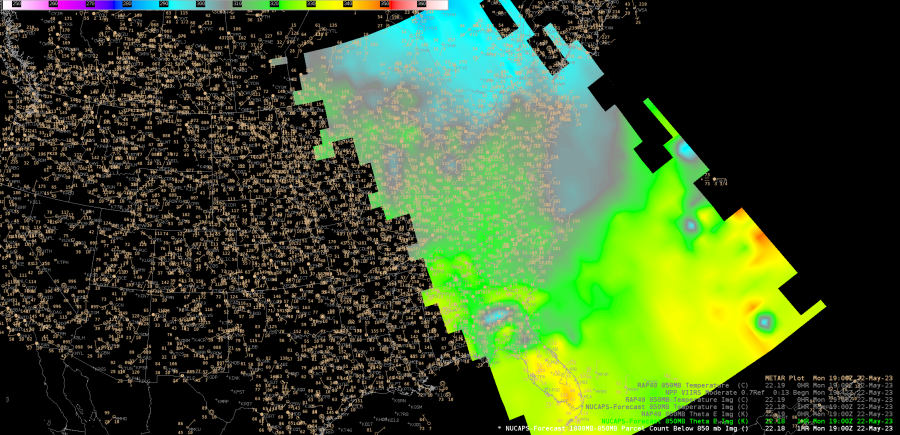
Interesting case to the north of the CWA today showing different layers that were flowing near surface and aloft. Was able to use the estimated motions to get a quick idea of how quickly the airmass over the Atlantic was moving to the SE. Could use this to get a quick estimate for when this airmass may clash with the seabreeze front which could lead to additional convection that fires near my CWA (TBW).
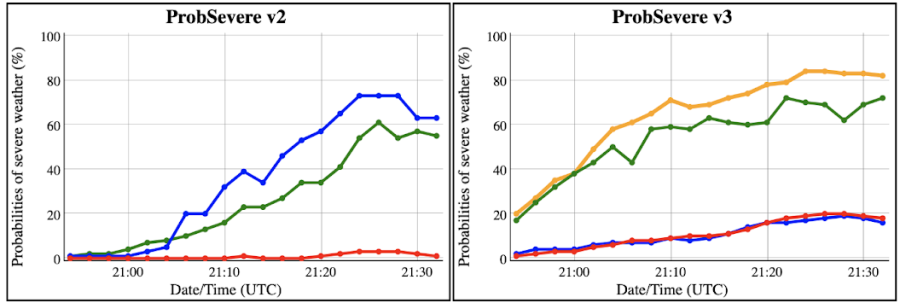
ProbSevere v3

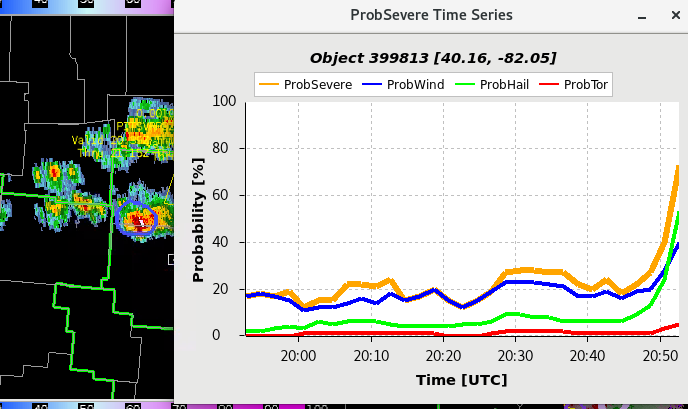
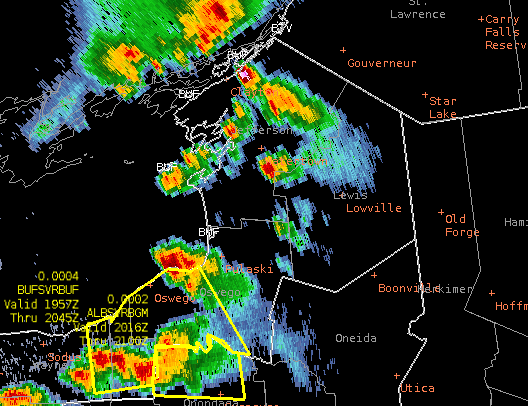
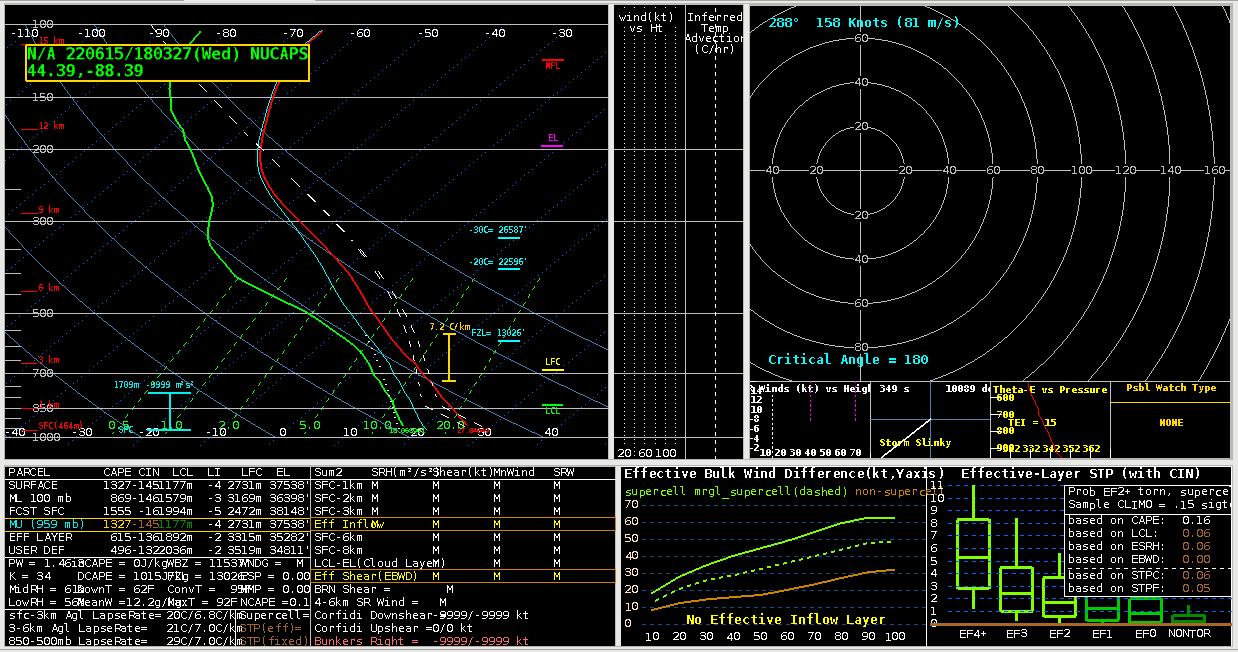
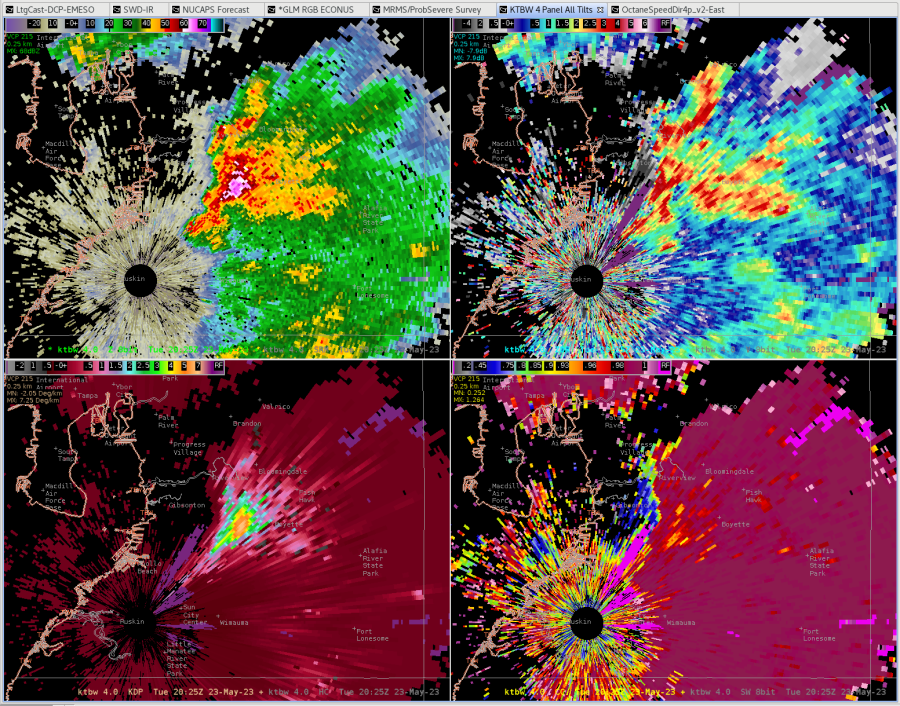
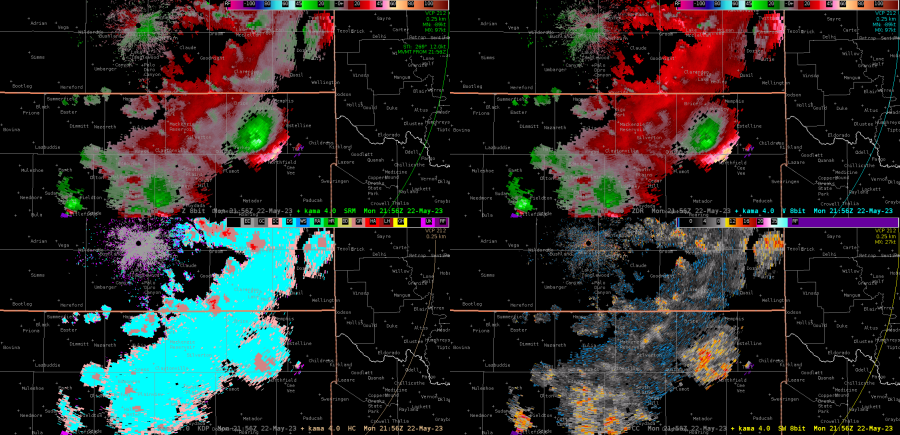
Great example of a marginal case where I considered issuing a severe thunderstorm warning. Core had pulsed significantly, showing 50-60 dBZ at the -20C isothermal layer. MESH was showing upwards of 1” of hail, but my experience in the south tells me that MESH will overestimate hail size. VII had a decent burst at one point, but biggest question mark to everything was how long core could hold together to keep hail aloft, especially given lack of shear (generally <30 kts EBS, little to no storm relative helicity or chance for any updraft organization or rotation). My bigger concern for warning was derived from the potential wind threat of the core falling out quickly, with DCAPE values analyzed between 5-700 J/kg.

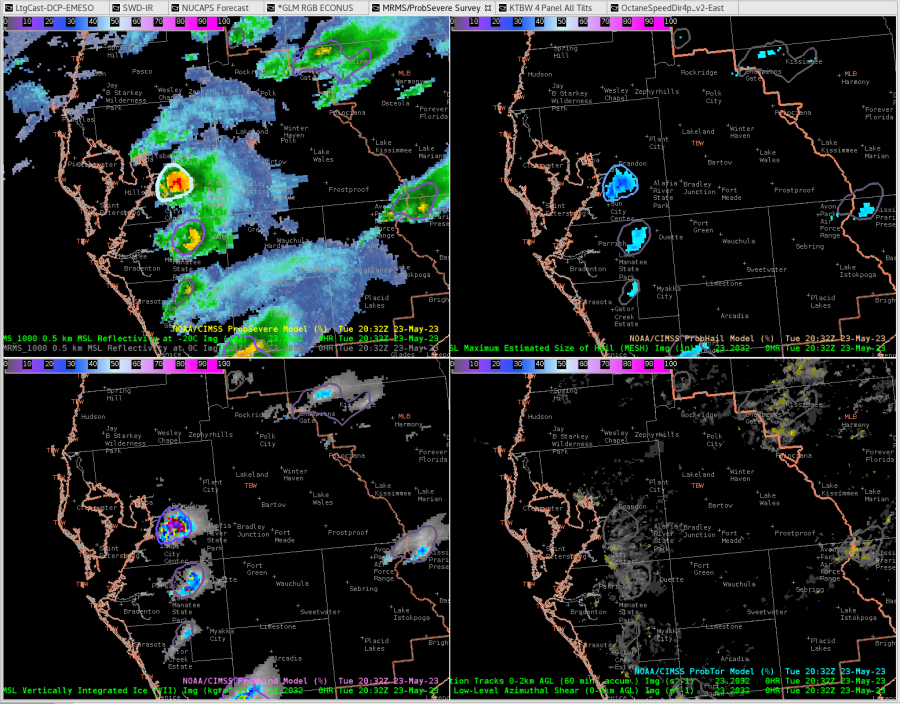
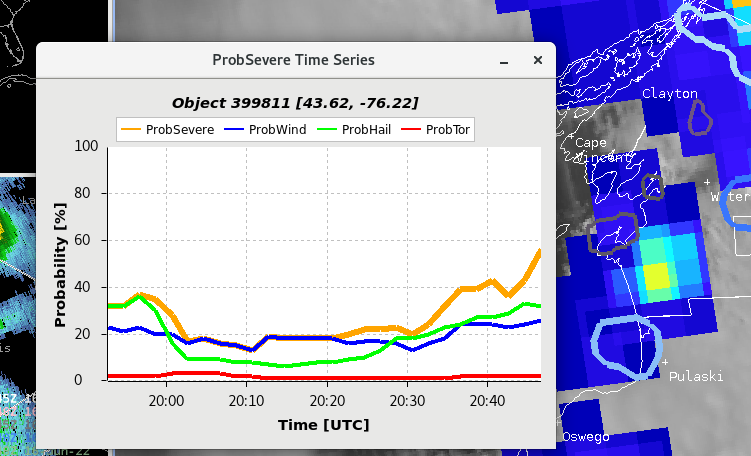
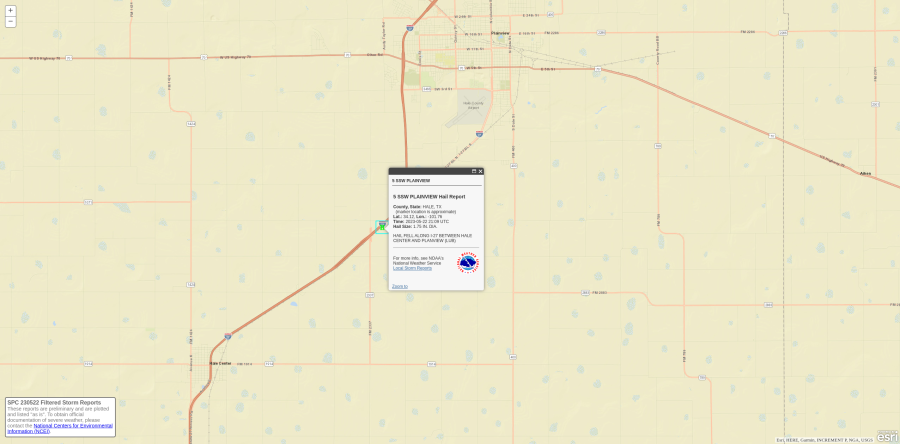
Probseverev3 topped out around 51%, which matches pretty well with my overall feeling of the situation, where I was already on the fence. Hail was the primary driver however, where I would have been a little bit more concerned with winds. That said, being right by the radar gave a good sample of winds as the storm fell, and they topped out at a whopping 32 kts. Hail was eventually reported at 0.5” near Riverview.

Otherwise, was using ProbSevere in combination with the OCTANE speed products for triage of storms, using the divergent signatures in OCTANE to pick out storms to quickly monitor and ProbSevere for continued development.

GLM Outage and ProbSevere

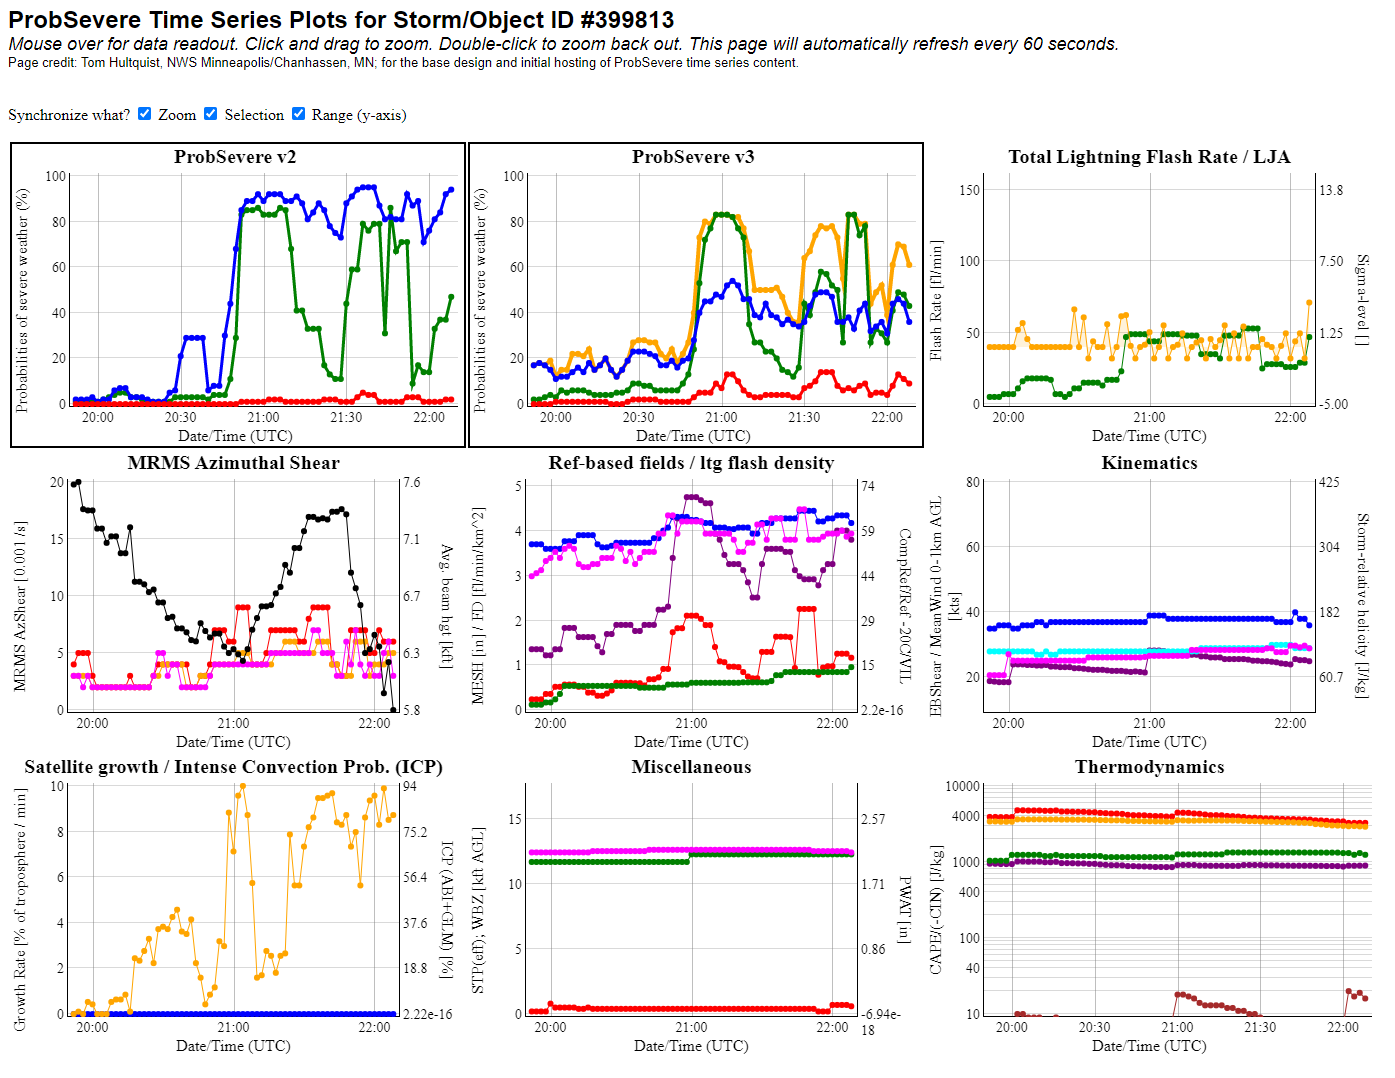
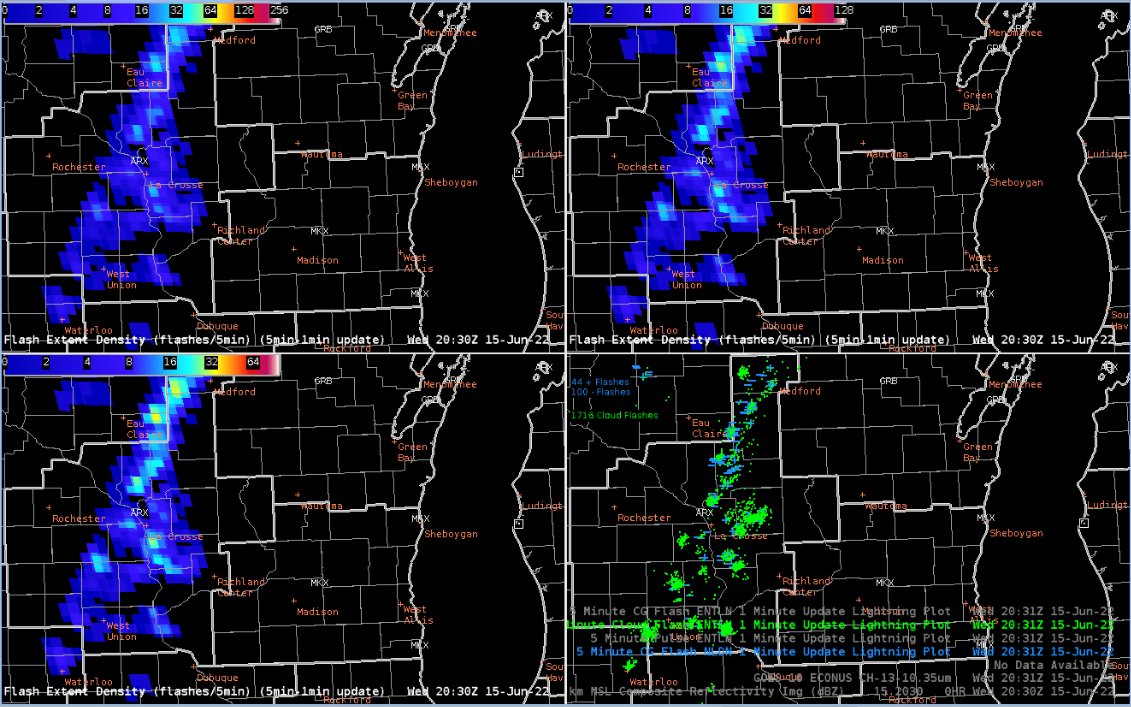
Due to a software error during an update, the GLM data dropped out for a few hours, which is an input into the ProbSevere model. It was good to see that ProbSevere seemed to remain well calibrated despite losing the data. I observed no large spikes or increase in the overall probabilities when the data was added back in – just a few small increases in some places. Data outages are not uncommon, so I think it is good that the model continues to perform well in the absence of a product.

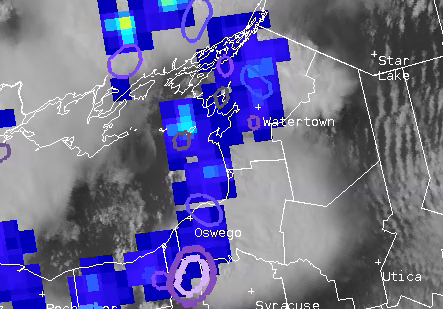
Octane View of an Updraft

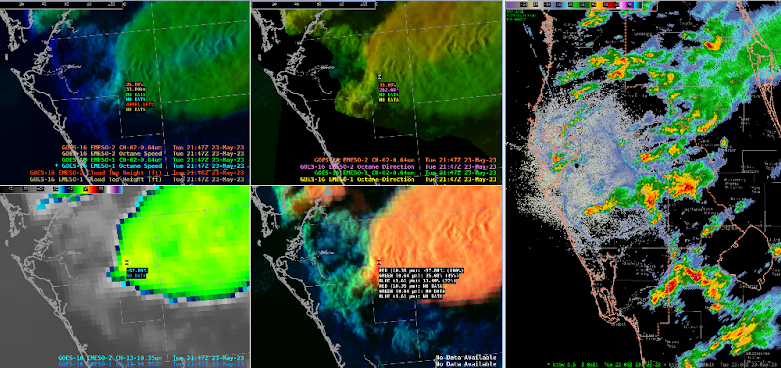
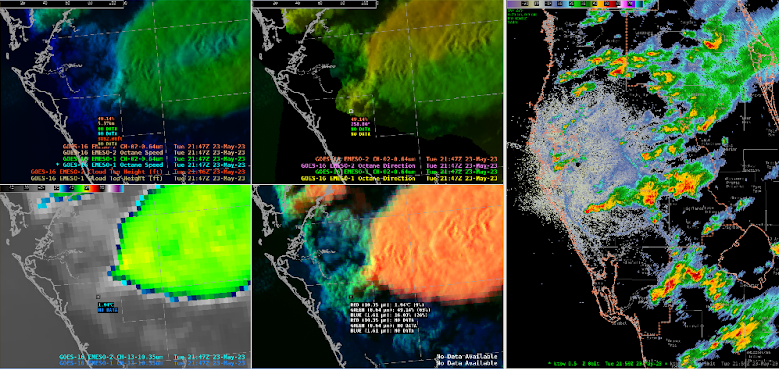
The sequence of pictures above show the speed and height of clouds within the updraft core of a thunderstorm that was moving slowly along the sea breeze front at the surface but was encountering faster winds aloft, giving a bit of a picture of the hodograph.

ProbSevere High Overall Prob with lower hail/wind

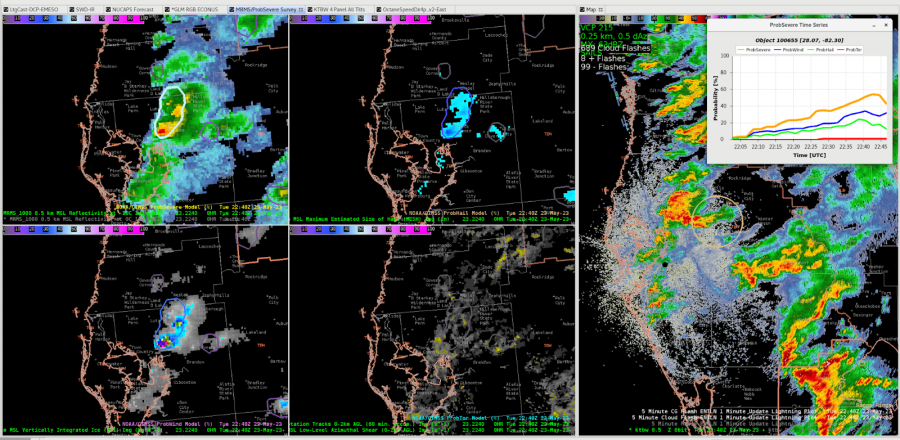
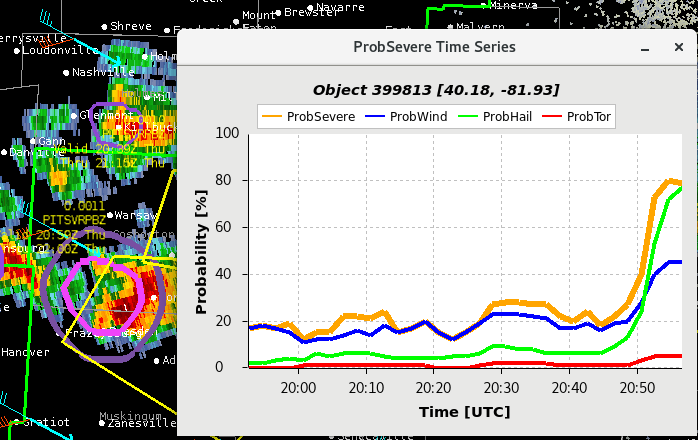
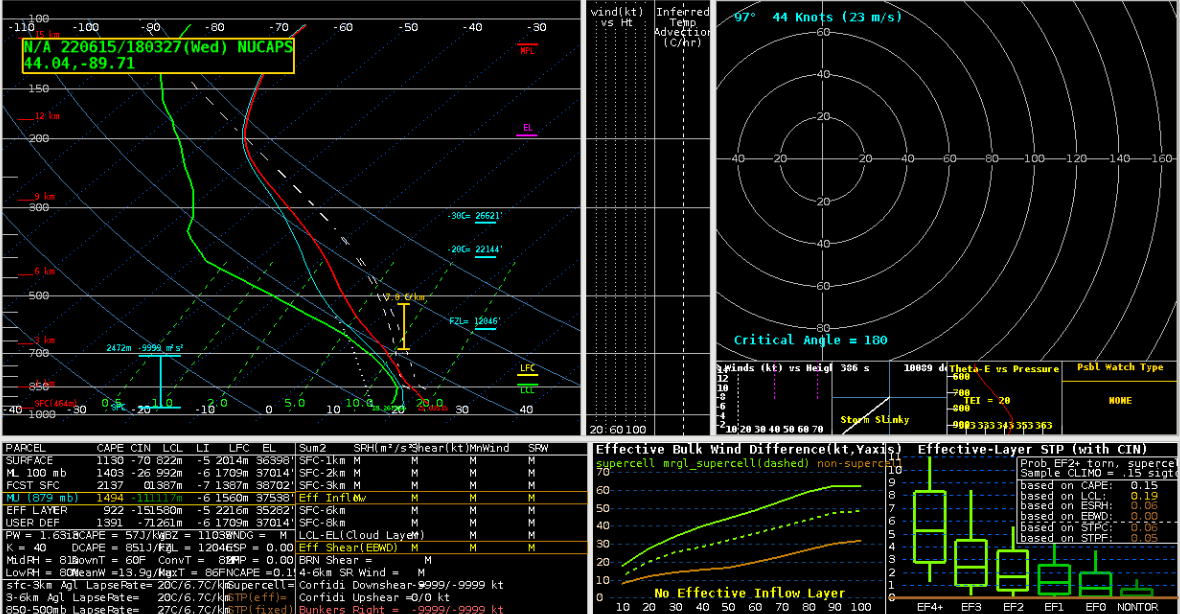
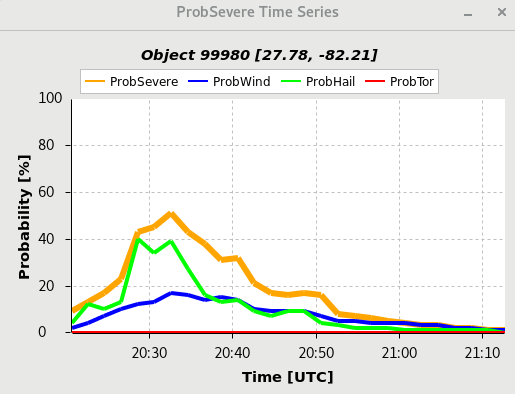
Interesting case where this storm ended up having one of the highest ProbSevere thresholds on the day I saw (54%) despite having both wind and hail thresholds that remained well below 40%. It makes sense that these probabilities would “combine” in a sense in the overall probability, but this definitely was not the “storm of day” or anything, with a less powerful overall updraft and core when compared to several others.

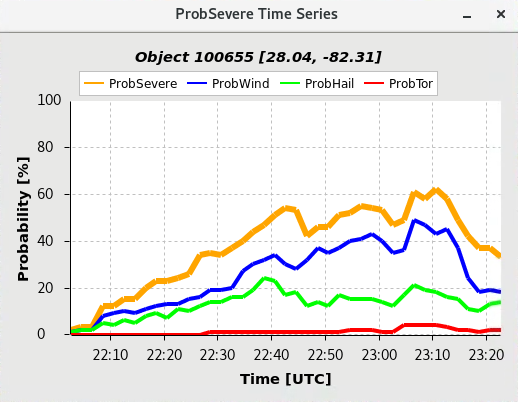
This continued to have relatively higher probabilities as shown below, especially in the wind, despite once again looking less impressive than others. While these cores did produce some 30-35 kt winds per radar, they never really approached severe limits (IRIS obs showed peak winds of 30-33 mph at various stations around the area). Wondering if the unique set-up, which led to some pretty high EBShear values that may not be truly realized by the updrafts, was leading to some higher values in the model.

The overall theme of today is that convection in the south is hard.

– Carl Coriolis      

Tags: None

Satellite HWT Day 1 Analysis Carl

PHS Model Analysis

PHS model struggled to properly capture convective initiation within the Texas Panhandle on the day. While it did see a few cells possibly starting, overall coverage was significantly underdone with many of these storms reaching severe thresholds including numerous reports of hail over 1″. The overall output shared many of the same struggles as the HRRR model on the day. Unclear what the exact problem was, but dry line convergence may have been better than in models on this day.

Above: 15Z PHS model output forecast for 17Z to 22Z from 5/22 with MRMS Reflectivity overlaid.

Below: 15Z PHS model output for 17Z to 22Z from 5/22.

NUCAPS Forecast

As I was beginning to test out these products, this caught my eye as a forecaster on the east coast that regularly deals with Cold Air Damming along the Appalachians. Models regularly struggle with multiple aspects of the dam, including extent, depth, and actual temperature and strength. Additionally, one of the most common pathways for large winter storms in the southeast is when low pressure passes across the Gulf Coast and into the Atlantic while an Arctic high in the northeast helps drive cold air damming into the area. Models again struggle with the dam, but also with strength of the warm nose aloft. I would love to see how this system performs in these scenarios – I know it isn’t “convective”, but it still is an incredibly impactful event, where the strength of the warm nose can be the difference between a few inches of snow or half an inch or more of ice. We regularly attempt to send up special soundings to get the best sample we can, but since GSP does not do a sounding, we rarely get a meaningful sample of the cold air damming in the SE states.

Above: NUCAPS Forecast from morning pass over east coast showing CAD feature over the east coast.

Octane Speed and Direction

Above: Octane image around 22Z for storm just south of AMA.

The Octane product was extremely useful in seeing when updrafts were really “taking off” and hitting the tropopause, immediately highlighting storms which require quick attention. Another extremely useful feature is sampling the actual speed, which gave a potential proxy for storm top divergence. Noticed that the Octane product gave a value around half of what the radar was measuring on this storm – ~50 kts on the Octane product vs ~100-110 kts on the radar. I’m assuming the resolution combined with some of the smoothing within the algorithm may be playing a role here, but it would be interesting to see if there is a consistent way to match the two up, even if there is just a “rule of thumb” or something. This would be huge in areas of sparse radar coverage (portions of the west or the ocean, for example).

Below: Radar image of storm top divergence near 22Z from KAMA.

ProbSevere v3

Noticed an interesting time period where two close updrafts – one fading, one picking up, resulted in some jumping of the ProbSevere product as it would sometimes combine the objects and then sometimes track them separately. I think this shows the importance of pairing the algorithm with analysis – just looking at the time series of the product could lead to misinterpretation of what was happening.

-Carl Coriolis

Tags: None

ProbSevere_V3 Captures Hail

Severe storms developed over Hale County, TX on the afternoon of 5/22.  KLBB 0.5 Z reflectivity at 2109Z (top left image) indicated intense convection, especially just southeast of Hale Center.  ProbSevere V3 (the 4-Panel) did well at 2108Z.  The upper left has the ProbSevere Model at 84% with the MRMS 0.5 Comp Reflectivity peak value of 66 dBZ.  The upper right has ProbHail at 85% and MRMS Maximum Estimated Hail Size (MESH) peaking at 1.85″.  The lower right has ProbTor at 12% and MRMS Low-Level Rotation Tracks.  The lower left has ProbWind at 35% and MRMS Vertically Integrated Liquid (VIL) at 55.  Notice how the ProbSevere Time Series ProbHail was at 60% at 2020Z, nearly an hour before this.  What happened?  Here is the LSR…

SSW PLAINVIEW Hail Report
County, State: HALE, TX
(marker location is approximate)
Lat.: 34.12, Lon.: -101.76
Time: 2023-05-22 21:09 UTC
Hail Size: 1.75 IN. DIA.

HAIL FELL ALONG I-27 BETWEEN HALE CENTER AND PLANVIEW (LUB)

Since forecasters should consider warning with lower ProbSevere values for V3 compared to V2, these high values supported a warning.

-Champion


Tags: None

Monitoring Storm Evolution Via ProbSevere & Octane Speed/Direction

This video shows a storm’s evolution as it moves into far SW Lamb County just before 21Z. The upper left hand shows the Octane Speed product…the upper right shows the Octane Direction product…the lower left is the GOES-16 Ch. 13 Clean Window IR Band…the lower right is the Day Cloud Phase Distinction RGB product.

Looking at the Octane Speed product, as this storm is initially growing,  the cloud top features moderate cloud top divergence with the variation in Octane Speed (as the greens and yellows nearby). The storm evolution then plateaus and eventually diminishes in intensity, shown as the cloud top speed becomes more consistent (with the loss of the yellow colors). The Octane Direction product shows a southerly component to the direction across the north of the storm with a westerly component along the southern side of the cloud top. At the end of the loop you can see the yellow (the southerly component) begin to disappear as the loss of cloud top divergence causes the direction to change from the motion of the divergence to the environmental westerly component. 
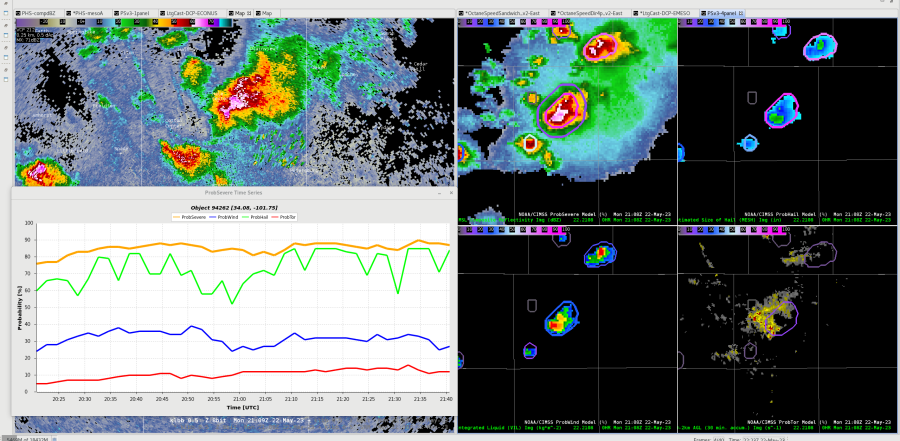
Below is an image showing the storm’s trends via the ProbSevere Time Series (storm location now just NNW of Anton). Though the ProbSevere values will lag behind the satellite imagery, one can note the storm’s gradual increase in ProbSevere values with the “warming” colors of the Octane Speed product. The values then also level off, before dropping off as the cloud tops become more consistent.

Joaq & Bubbles

Tags: None

GLM and Lightning Cast

The GLM parallax showed up again Thursday, June 16th, over the PBZ area. This was even more evident than yesterday’s event in WI that was written about in a blog post.  Figure 1 has ProbSevere, LightningCast, GLM Flash Extent Density, and ENTLN data overlaid in a 4-panel.  This case was fairly simple to “self correct” the parallax as the GLM was clearly displaced to the north of ProbSevere (as well as the base reflectivity).  Really once you get a few cases under your belt recognizing the parallax, it’s not too challenging to keep that “self correct” in the back of your mind.  One interesting thing to note about Figure 1 is the storm just outside the PBZ CWA just south of Mount Veron, Ohio (See bottom left in Figure 1).  The ProbSevere and GLM FED are lined up perfectly and this is a great example of utilizing the lower threshold in the colormap. The bullseye shows up much nicer than the larger thresholds in the top two images.

Figure 1: GLM with ProbSevere and LightningCast

– Podium

ProbSevere V3 Adjusting During New Cell Formation

ProbSevere V3 has been showing much improvement over version two, with this particular day featuring somewhat pusley mixed-mode storms across upstate New York. This particular group of cells had habitual new updraft development, with storms nearing or briefly becoming severe as high dBZ cores develop aloof then make their way downward. These particular cells were able to form 1.00” hail. The ProbSevere V3 time series reflected the marginally severe nature of these storms very well, with values peaking at 60 to 65%. The very encouraging sign was the peaks and valleys in the ProbSevere V3 time series that showed this group of cells peaking at over 50% severe probabilities, dipping below 50% as the new updraft takes over, and then once again peaking above 50% once the new updraft strengthened. I’d definitely recommend forecasters to take a look at the timeseries to build confidence in cell trends during warning applications.

Shown above is the group of cells, with the initial one showing a core of 60+ dBZ that begins to drift off to the northwest while a newer updraft takes over and moves more east-northeast.

– aerobeaver

ProbSevere Time Series

I utilized the ProbSevere Time Series in warning operations today (June 16, 2022) within the Pittsburgh, PA CWA.  With only using basic radar products and no other products  (that I’d normally use during warning operations), it was extremely helpful in warning decision making.  After issuing several warnings already and monitoring a storm quickly developing in the western portions of the CWA that was getting close to severe, I issued a warning based on an uptick in the ProbSevere Time Series (See Figure 1 vs Figure 2).  The uptick in ProbHail occurred within about 5-6 minutes or roughly 2 radar scans of the PBZ WSR-88D prompted a warning.  The storm continued for several minutes and regenerated about 30 minutes later that prompted another warning downstream (See Figure 3).

Figure 1: ProbSevere Time Series at 2056z

Figure 2: ProbSevere Time Series at 2100z

Figure 3: ProbSevere Time Series Plots.

– Podium

GLM & Prob Severe in Low Radar Coverage

With the Buffalo CWA being a long and narrow forecast area, there are areas where the Buffalo Radar doesn’t provide good coverage. On a day like today where their second radar (KTYX) isn’t providing any data, the entire eastern half of the CWA has the Buffalo radar hitting storms at 20 kft or higher. This meant that we had to more heavily rely on Satellite data for warning operations.

Looking at the northeast corner of the CWA we had convection popping for a few hours along a frontal boundary. Being able to look at spikes in the GLM over time and Prob Severe time scales and just instances in the Prob Severe were very helpful with determining what was going on in the lower levels that weren’t visible on radar. As one storm over the lake begins to move inland there is a jump in the GLM and Prob Severe.

Being able to see the upward trends in time with the prob severe over time and then the increasing GLM was a big confidence boost to put out a warning.

-Cirrus Fields

Pre-Convective Environment Across GRB

With a busy day still underway across Wisconsin, the use of the Optical Flow Winds, GLM, Prob Severe, and NUCAPS soundings were a big help in looking at the pre-convective storm environment and in warning operations.

When it came to looking at sounding data we had a NOAA-20, and AQUA pass for the polar orbiting satellites, that we could then compare to the special observed sounding from GRB.

There are some spatial differences in the locations since each satellite doesn’t pass over the exact location and the observed sounding came from the GRB office. I ended up grabbing NUCAPS soundings from west of the office where I thought the better storm environment would be. Regardless of this they do show great information over a temporal and spatial scale.
Just between Aqua (bottom image) and NOAA-20 (middle image) you can see that the environment becomes much more moist over time (AQUA came around 19Z and NOAA-20 came around 18Z). The increase in temperatures and dew points in the low levels between the two NUCAPS soundings show that there was increasing low level lapse rates and increasing CAPE through time. Then compare both of these to the special sounding sent out by GRB, you can see AQUAs vast improvement in the low level over NOAA-20. The one caveat seems to be the smoothing of the values in the mid levels. Smoothing seems to have decreased the values almost too much for both satellite soundings. It is fairly within reason given that there is a dry layer in the mid levels on the observed, but the smoothing looks to have slightly overdone it.
Moving on to the GLM, it was very helpful when boosting confidence in the warning operations. There were lightning spikes collocated with increasing rotation and reflectivity. The one things worth mentioning is to have a reminder or maybe even have offices lower/change the color curves for FED prior to the start of an event. It could even be a permanent change that some offices make.
Since I was the only one in the group to check, compare, and lower the FED color curve accordingly it was much easier to pick out lightning jumps. From the graphic above alone, 0-65 was much more informative than 0-128 or 0-260.
The last thing worth mentioning for the day was the Optical Flow Winds. While this was helpful in a warning environment to look at storm top divergence and speed of the winds at the tops of clouds, I was able to find another great use for it. In the pre convective environment I had pulled up the Optical Flow Winds and noticed that it was tracking winds and speeds of clouds over Lake Michigan. In an area where any wind information and observation data can be very sparse to near non-existent. The optical flow winds could be very helpful for open waters forecasting.
-Cirrus Fields