Observations from Hail-Producing Storms in the Panhandle of Texas

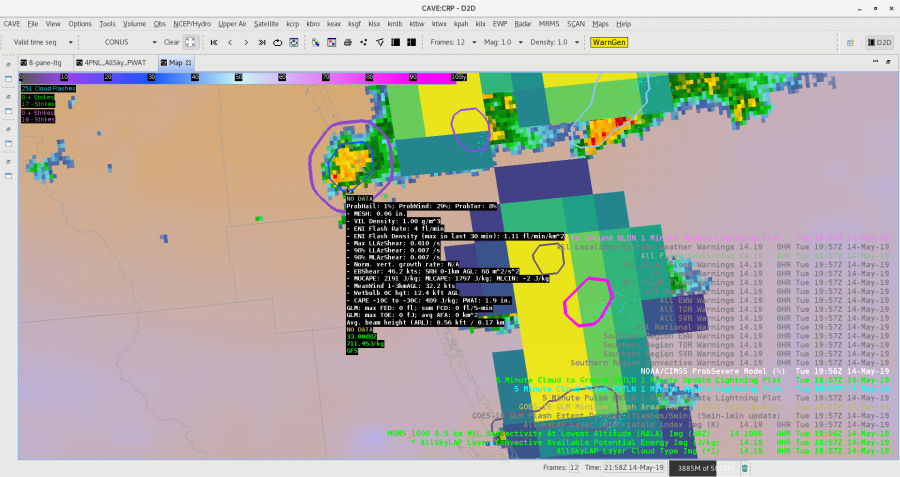
Today’s environment is ideal for all types of severe weather. Unsurprisingly, the ProbHail algorithm indicates high probabilities of hail with most of the storms. Here I’ll use dual-pol interrogation to investigate ProbHail performance and include a few  additional observations.

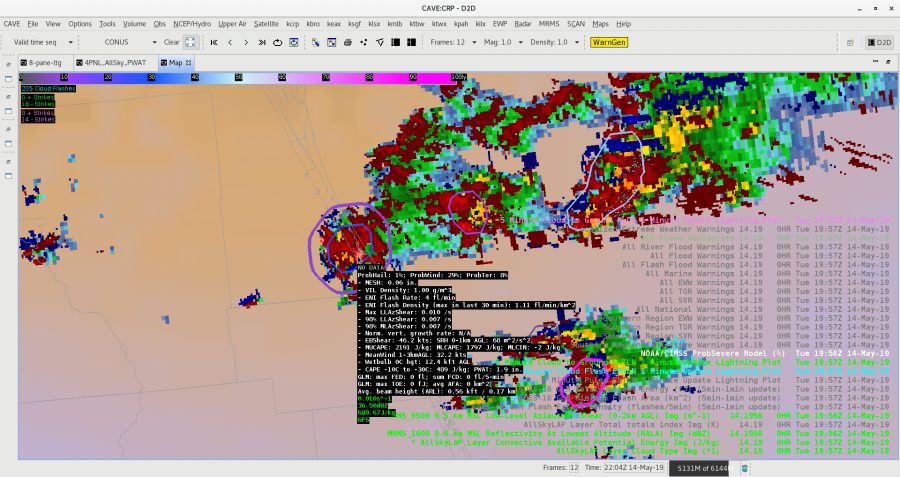
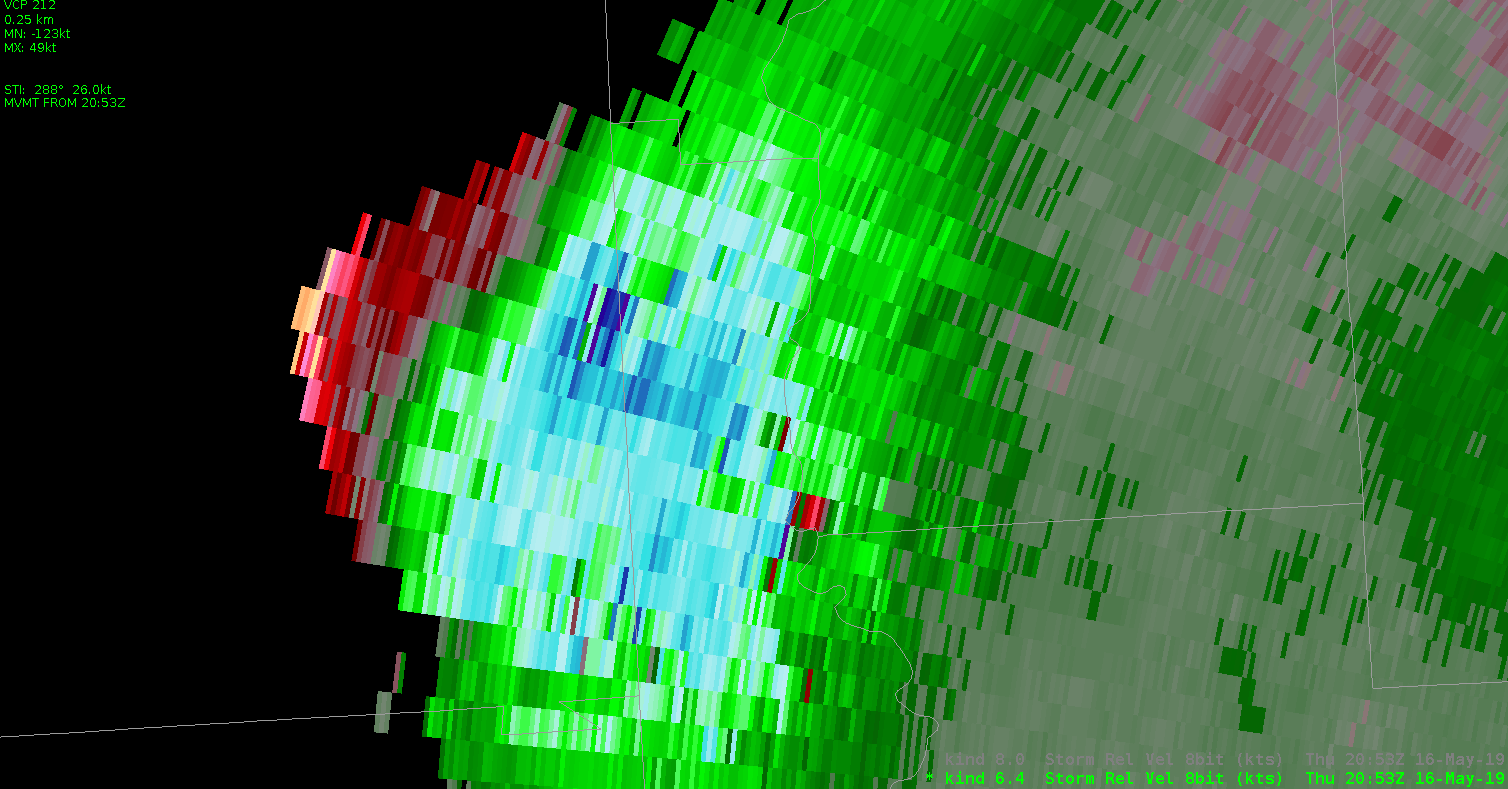
Of particular note is the evolution of a storm object in the mind of the ProbHail algorithm. The algorithm seems to handle merging and splitting remarkably well for both the northern-most storm and the line of storms that results at the end of the loop in the SE part of the CWA. This performance in a highly-complex radar display is promising for more isolated storms. Let’s zoom in on the southeastern storm near Wellington:

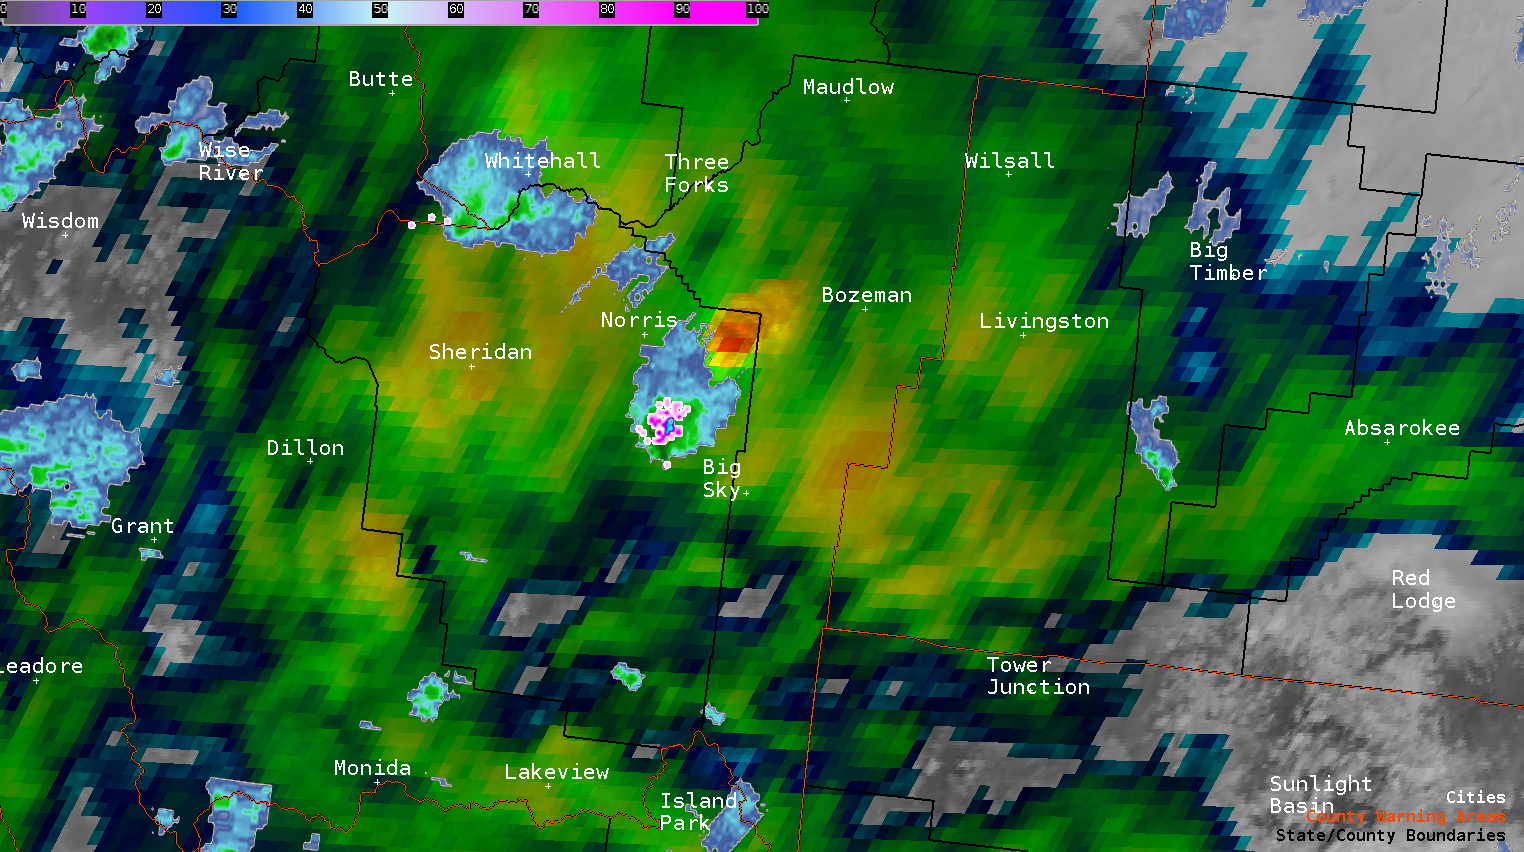
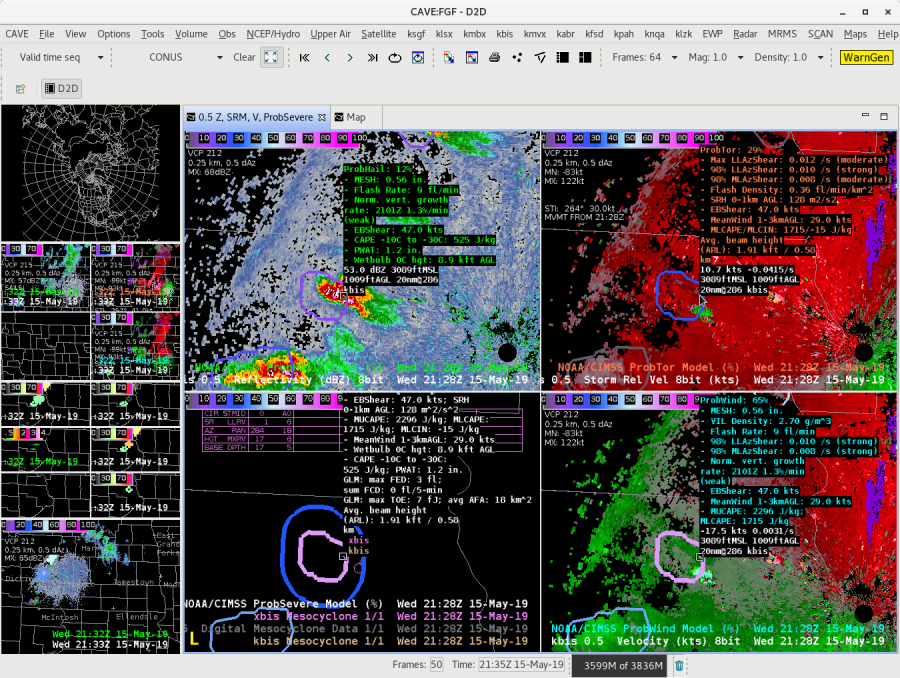
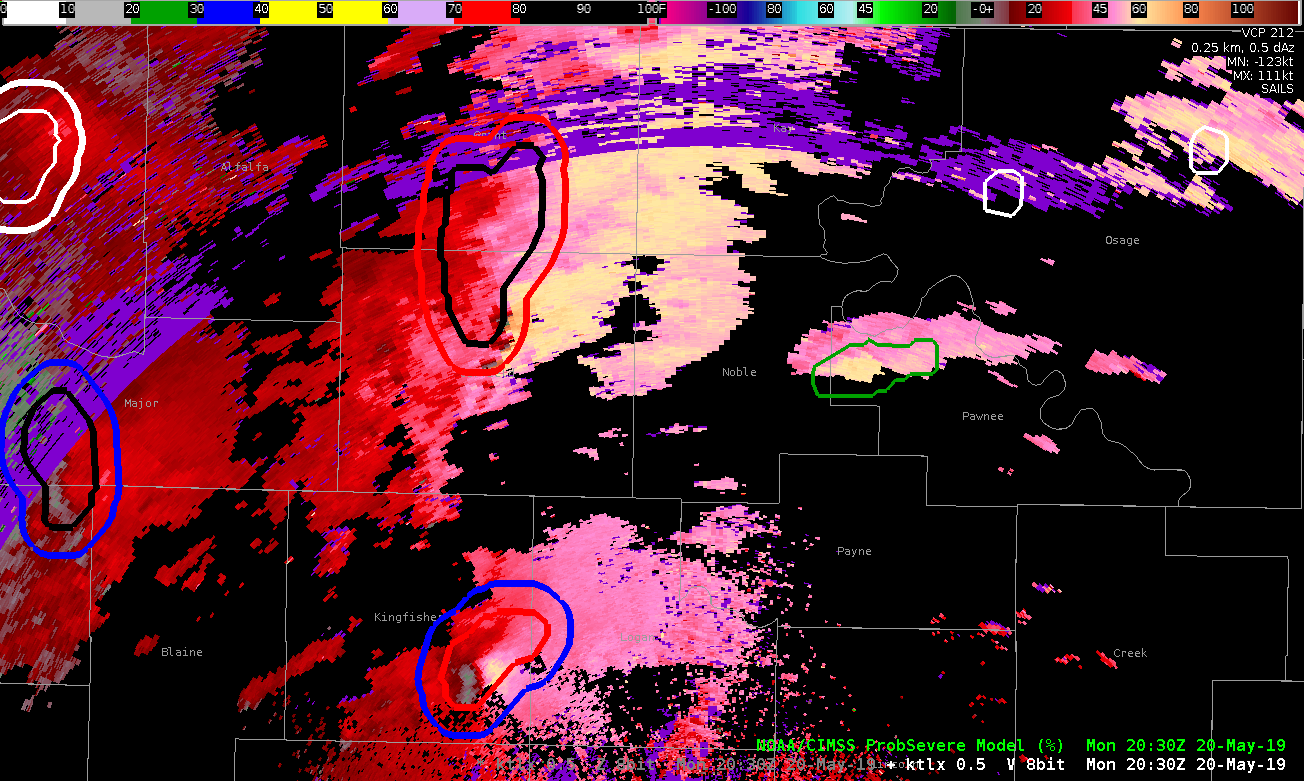
The reflectivity signal in the hail core is not particularly anomalous (~50 dBZ), but ZDR near zero and reduced CC indicate high confidence in hail production at the surface. The ProbHail shows a 98% chance of hail in that storm. We would expect high confidence and this algorithm performs well. Baseball size hail was reported with this storm! -Atlanta Braves


The good and bad of Prob Tor/AzShear/Meso Detection Algorithms

The image below looks at 2 cells in central Oklahoma. The northern cell has a prob tor of 77%, but is falsely lightning up a shear zone with little chance of a tornado. The southern cell shows all the characteristics of a tornadic supercell, but has a prob tor of 37%. However, the southern cell is closer to producing a tornado (via live media).

Here’s another image using KVNX instead of KTLX, and shows only the prob tor.

The two cells to the north have 90 and 91 percent, respectively, while the southern supercell has only 33 percent.

Not to pick on the prob severe product, the meso detection algorithms a similarly struggling. Below is a 4-panel showing the legacy mesocyclone alogrithm (upper left), the digital mesocylone algorithm (upper right), the low level AzShear (lower left), and the experimental meso algorithm (lower right).

All three detection algorithms are flagging the circulations as equally important, but an examination of the base data shows otherwise.

Thorcaster

IND TVS

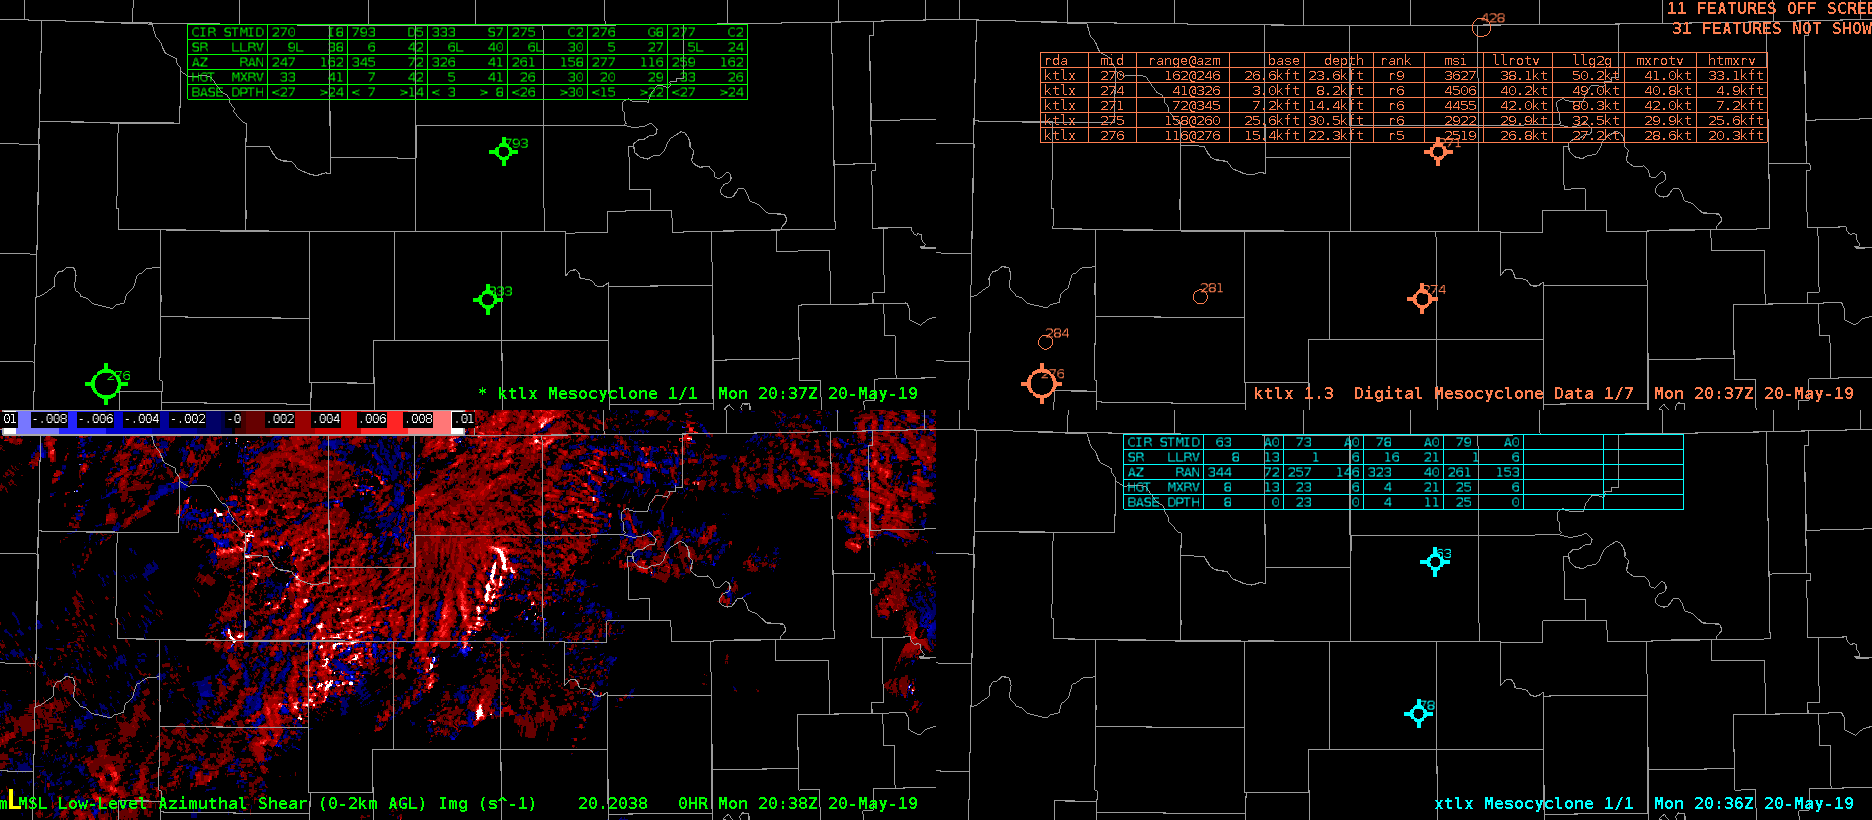
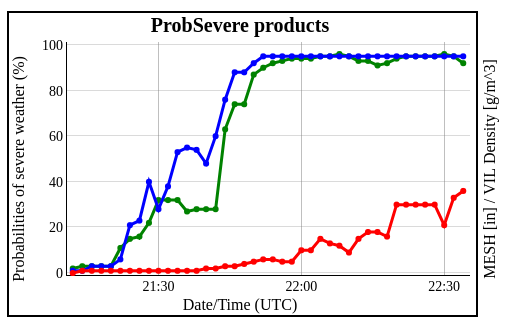
15 min prior to 1.75″ hail and 20 min prior to baseball-size hail, a supercell tracked NNW-SSE through Vermillion Co, IL …the Probsvr nailed the values for ProbHail at 96%, VILD 4.3, and a well defined TVS (100kt G-G) and strong MESO on NEXRAD ~ 7k’
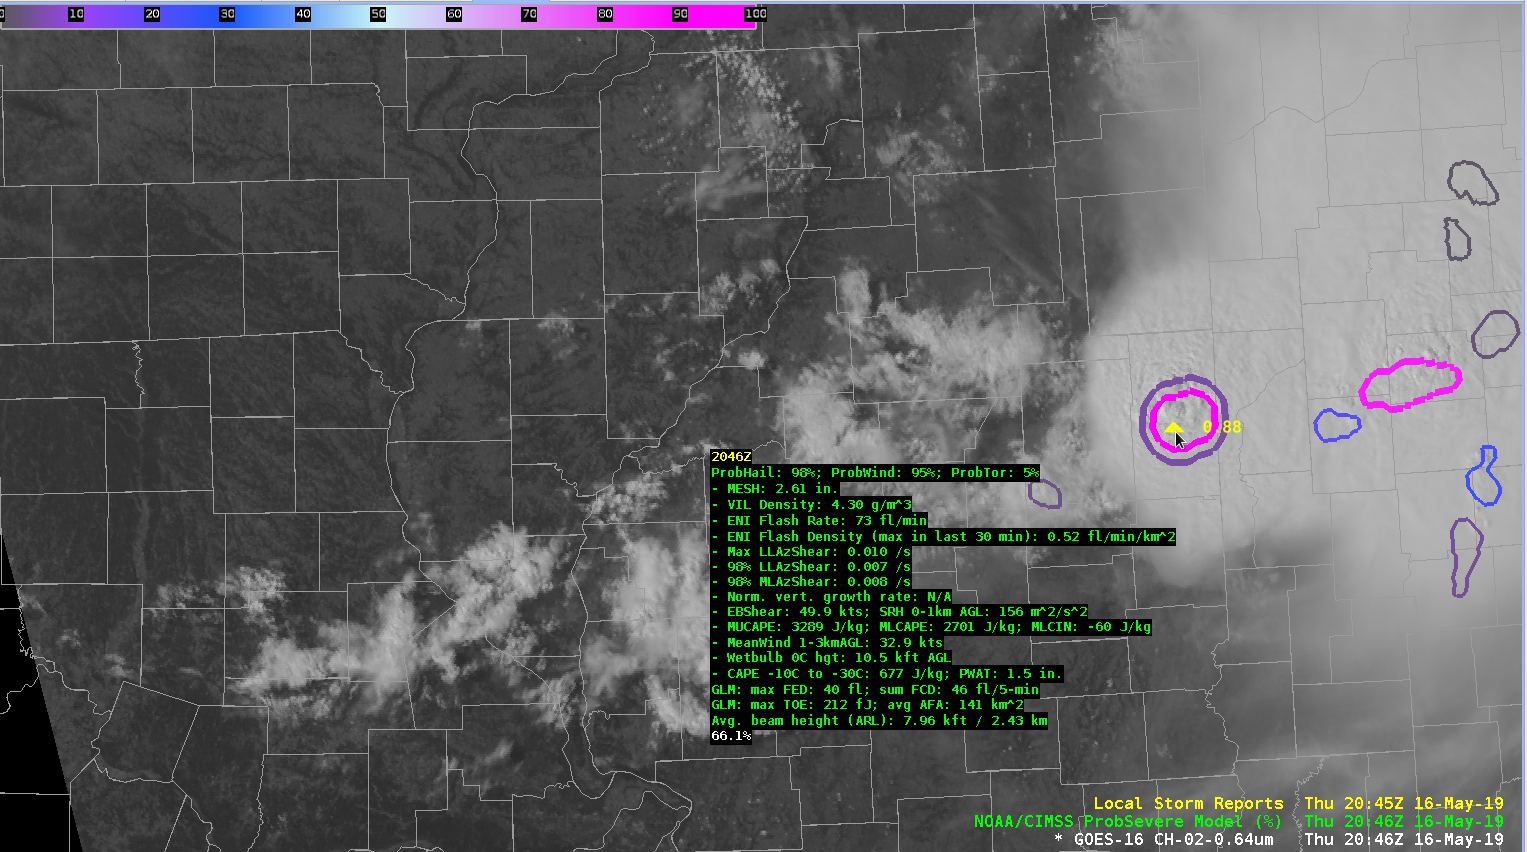
NUCAPS SVR TS values kinda nailed it in Ern IL :

East Central IL  (green dot) MU and FCST SFC CAPE were > 4000, LIs were > 12, DCAPE > 1000 (~50KT Gusts), SHIP > 1 and LR H8 – H5 ~8SRM showed Storm Top Div > 130kt 12 min prior to the Baseball Sized hail
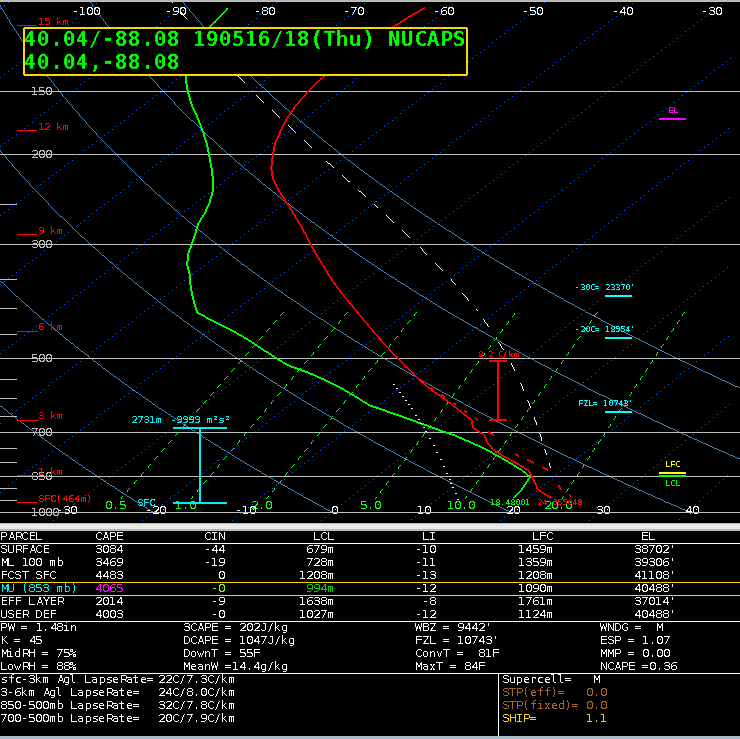
This storm is not diminishing, with Storm Top DIV remaining well over 100kt
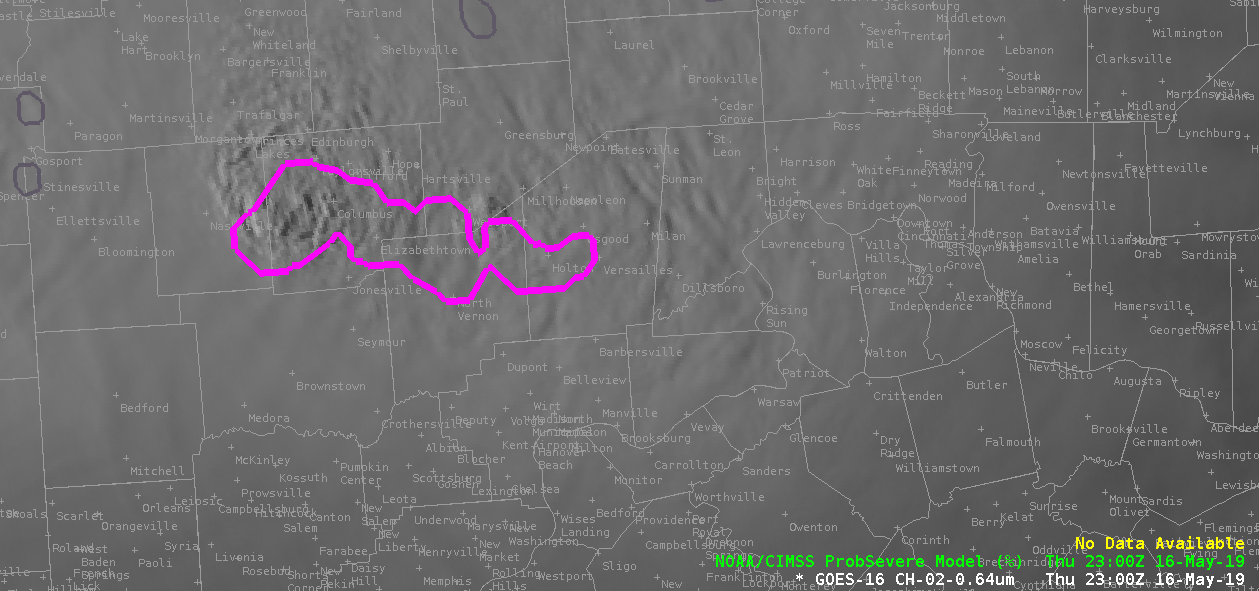
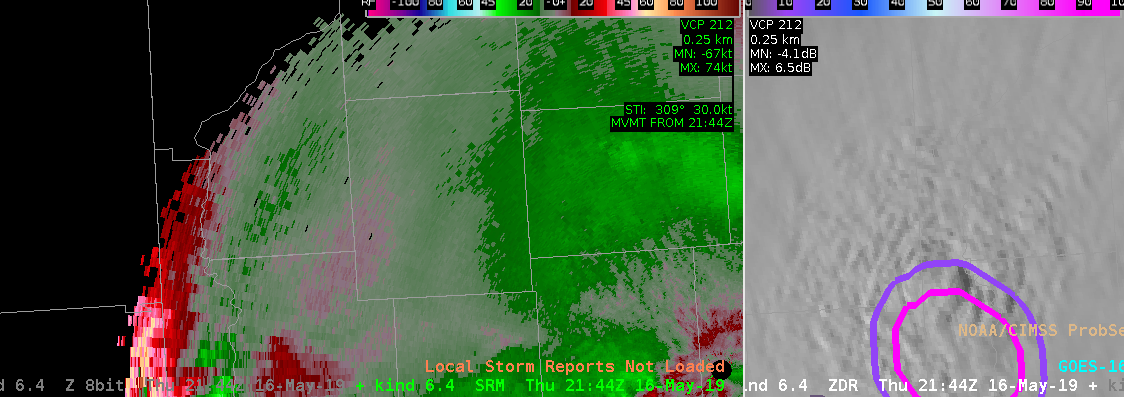
Eastern end of MCS continues to chug thru central IN (2130-2300z), 
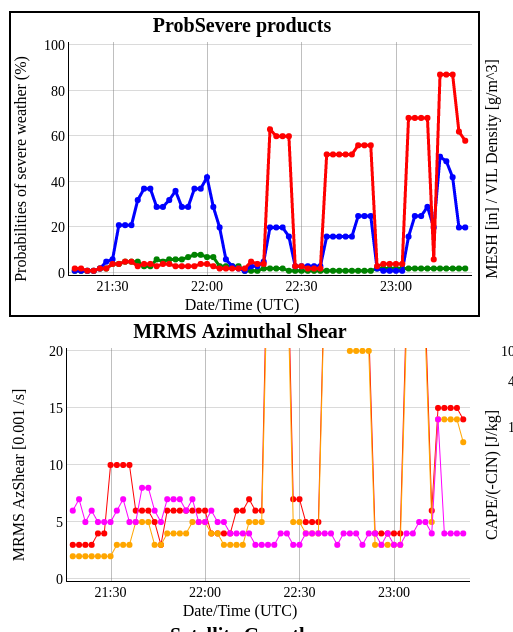
ProbSVR ~ 23z looking good, more warnings on the way

ProbSevere in MCS

Watching the MCS evolve over Indiana, ProbSevere became increasingly hard to use. The object continued to change in size and in number, so it was hard to trust the probabilistic values. Ideally, I would have liked to see one on the eastern flank where the strongest velocities were, another on the western flank where the reflectivity is higher, and perhaps one or two more in between.  However, since the orientation of the MCS continues to change, I’m not sure if that would continue to be the preferred object count and location.  Bottom line is to use ProbSevere with caution with lines, bows, MCS’s or anything with ill-identifiable cells.

-Tempest Sooner

Prob Severe Object Identification

Prob Severe failed to identify a strong storm developing in radar sparse coverage area near Bozeman, MT. The storm did show up on MRMS composite reflectivity, ENTLN, GLM Lighting and had rapidly cooling cloud tops, so not sure what was missing to have the storm identified by Prob Severe.

–warmbias–

Prob Severe – Unrealistically High ProbTor

ProbTor started giving unrealistically high values in northern ND, noting very high Az Shear Values. This appears to be a problem with data QC in the operational MRMS data, as it does not appear in the Testbed data.


Looking at the time series for one of these anomalous Prob Tor values, its clear the bad Az Shear data is contributing to the jump in Prob Tor:

ProbTor Too High

Watching a supercell near Bismarck…

It was clear from the hail core aloft that this was severe. However, it was obvious around 2152Z that the RFD gusted out as was seen on reflectivity initially, and then later on the velocity images as the winds became less perpendicular to the beam. However, ProbTor continued to carry high probabilities, and even increased when it was clear on the velocity images there was no tornado threat.  ProbTor was only keying on the outflow boundary.  MRMS Rotation Tracks were also showing a swath of higher values along the outflow boundary.

Reflectivity Loop
SRM Loop
ProbSevere Time Series

-Tempest Sooner

Lightning observed but no GLM

ProbSevere gives every indication of a severe storm over Morton County, ND (see ProbSevere read out below).  The Earth Networks lightning suggests there of 52 fl/min but GLM FED gives 0 fl, TOE 0 fJ, and AFA 0 km^2.  The two depictions below show those three GLM fields with the MRMS 1 km reflectivity.  Perhaps there is an issue with viewing angle at this northern latitude. – Jonathan Wynn Smith (ESSIC/UMD)

ProbHail: 93%; ProbWind: 95%; ProbTor: 5%
– MESH: 1.83 in.
– VIL Density: 3.20 g/m^3
– ENI Flash Rate: 52 fl/min
– ENI Flash Density (max in last 30 min): 0.89 fl/min/km^2
– Max LLAzShear: 0.007 /s
– 98% LLAzShear: 0.006 /s
– 98% MLAzShear: 0.008 /s
– Norm. vert. growth rate: 2101Z 1.3%/min (weak)
– EBShear: 38.0 kts; SRH 0-1km AGL: 155 m^2/s^2
– MUCAPE: 2925 J/kg; MLCAPE: 1657 J/kg; MLCIN: -36 J/kg
– MeanWind 1-3kmAGL: 26.4 kts
– Wetbulb 0C hgt: 9.0 kft AGL
– CAPE -10C to -30C: 546 J/kg; PWAT: 1.3 in.
GLM: max FED: 0 fl; sum FCD: 0 fl/5-min
GLM: max TOE: 0 fJ; avg AFA: 0 km^2
Avg. beam height (ARL): 1.28 kft / 0.39 km
Object ID: 273531
PS: 98

ProbSevere Potential Gotcha

A potential “gotcha” and/or training issue…

I initially loaded a 4-panel with 0.5 Reflectivity and ProbHail overlaid, 0.5 SRM and ProbTor overlaid, and 0.5 Vel and ProbWind overlaid, but I had not loaded the full ProbSevere Model in any of the 4 panels. I then noticed that there was a 29% ProbTor (which was erroneous with bad dealiasing), but my attention wasn’t called to it because the 2nd circle around the storm only appears on the full ProbSevere. It would seem like a good idea to either always have the full ProbSevere displayed or if folks prefer to load the threats separately, perhaps need to add a second circle around the ProbTor object.

ProbSevere 4 Panel – Upper Left: 0.5 Reflectivity + ProbHail, Upper Right: 0.5 SRM + ProbTor, Bottom Right: 0.5 Vel + ProbWind, Bottom Left: NMDA + ProbSevereModel

-Tempest Sooner

ProbTor reliable? Lightning says no, MRMS says maybe.

There is difficulty with having confidence of the ProbTor portion of the ProbSevere product due to an instance where it is estimating higher tor rates (8%) when a storm has no identified lightning (GLM, NLDN, and ENTI) along the coast of Florida. To be fair, the storm previously did indicate some lightning with it. I investigated the TOE, FED, and Min Flash Area in the vicinity of this storm, as well as usual point lightning data in 5 and 1 min updating intervals, and it has me confused as to what the ProbSevere is “seeing” for its lightning data (it is indicating ENTI lightning within its circle). Below is the image example of ProbSevere loaded alongside lightning data including GLM’s Min Flash Area:


I also pulled up the lowest level rotation tracks from MRMS data, and it did indicate a slightly higher maximum within the ProbTor circle, so I believe the ProbTor is locking on to that feature.   – shearluck