Springfield Storms

We’re currently analyzing storms developing in the Springfield Missouri WFO.  Right now I’m using various tools to monitor if these storms will become severe.

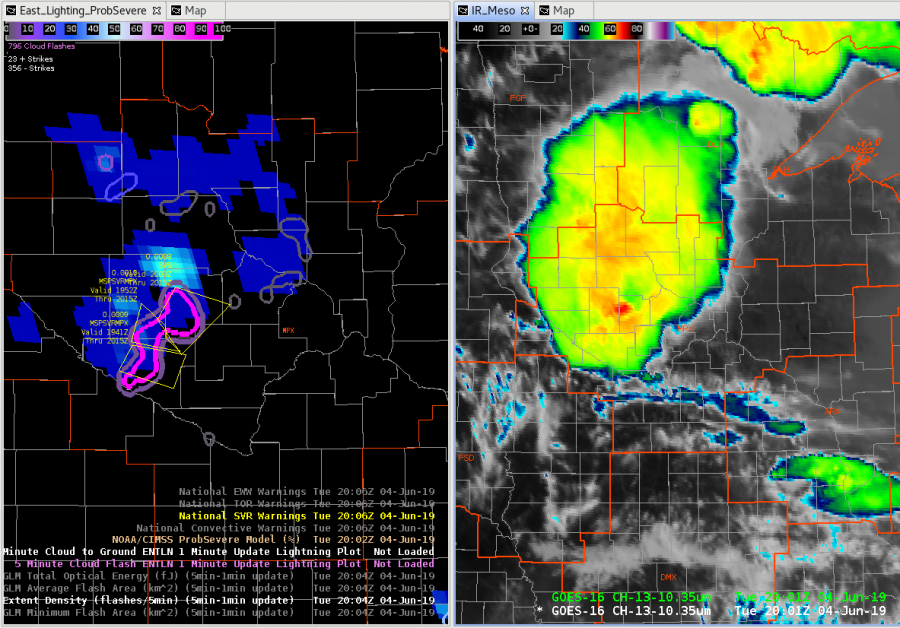
Right now I’m using a combination of radar, GLM, nucaps, and the All sky products. Currently the most helpful tools on top of what I normally use are allsky and the lightning products.

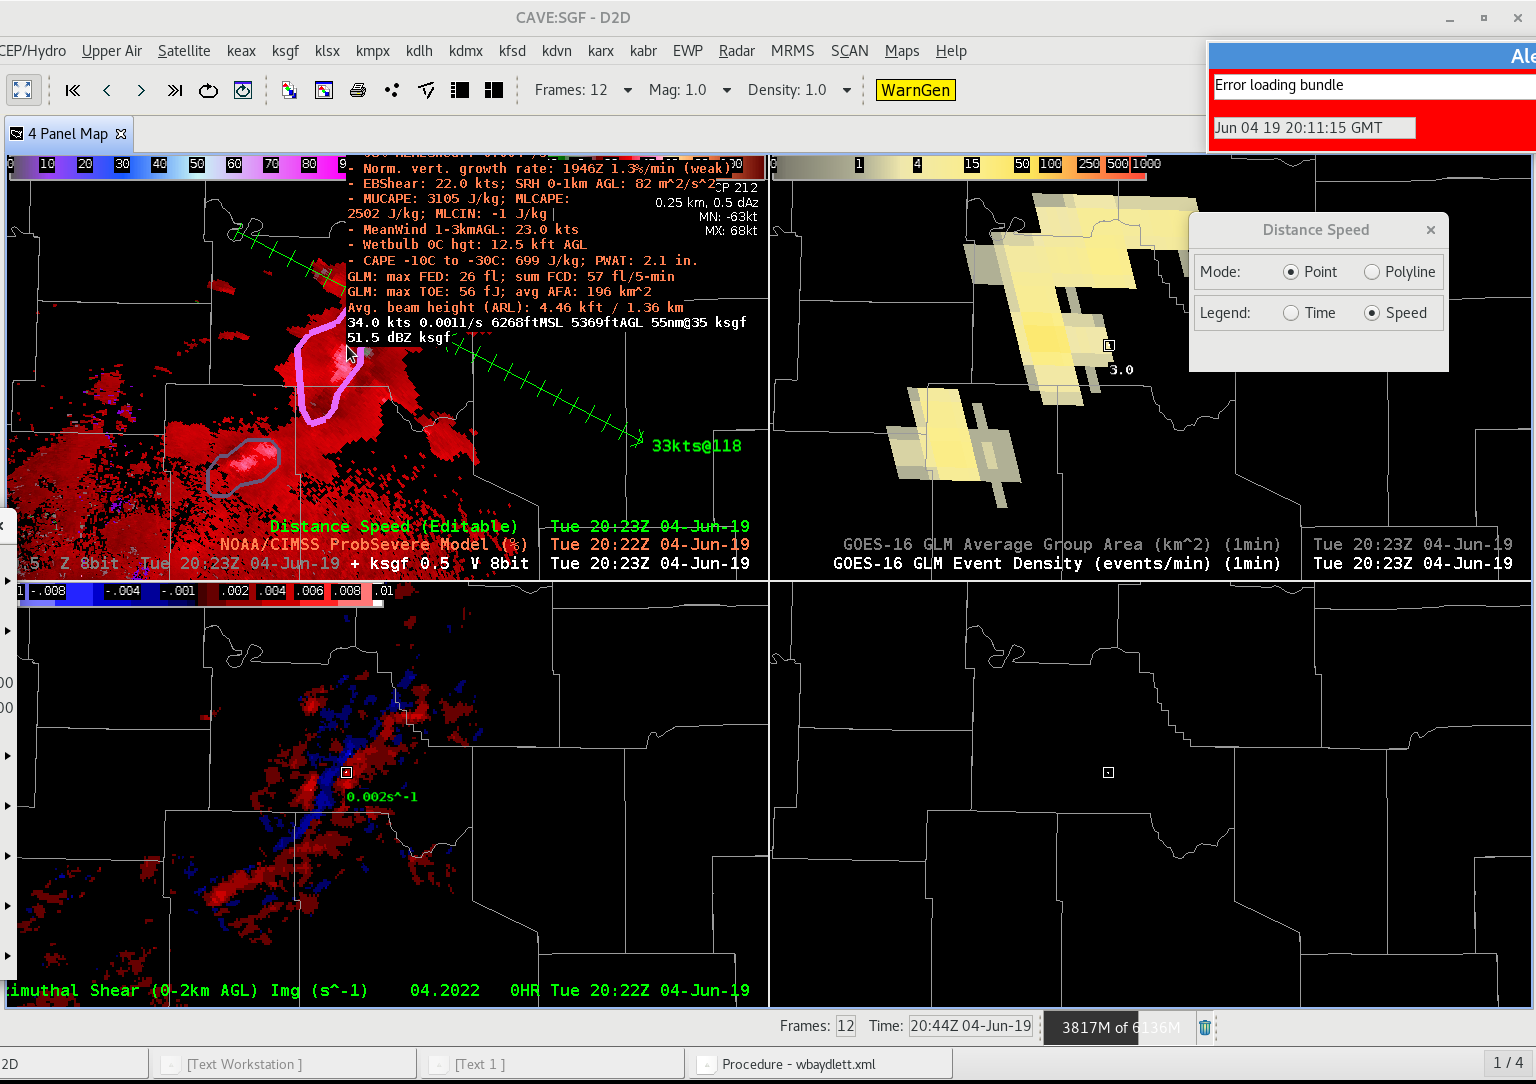
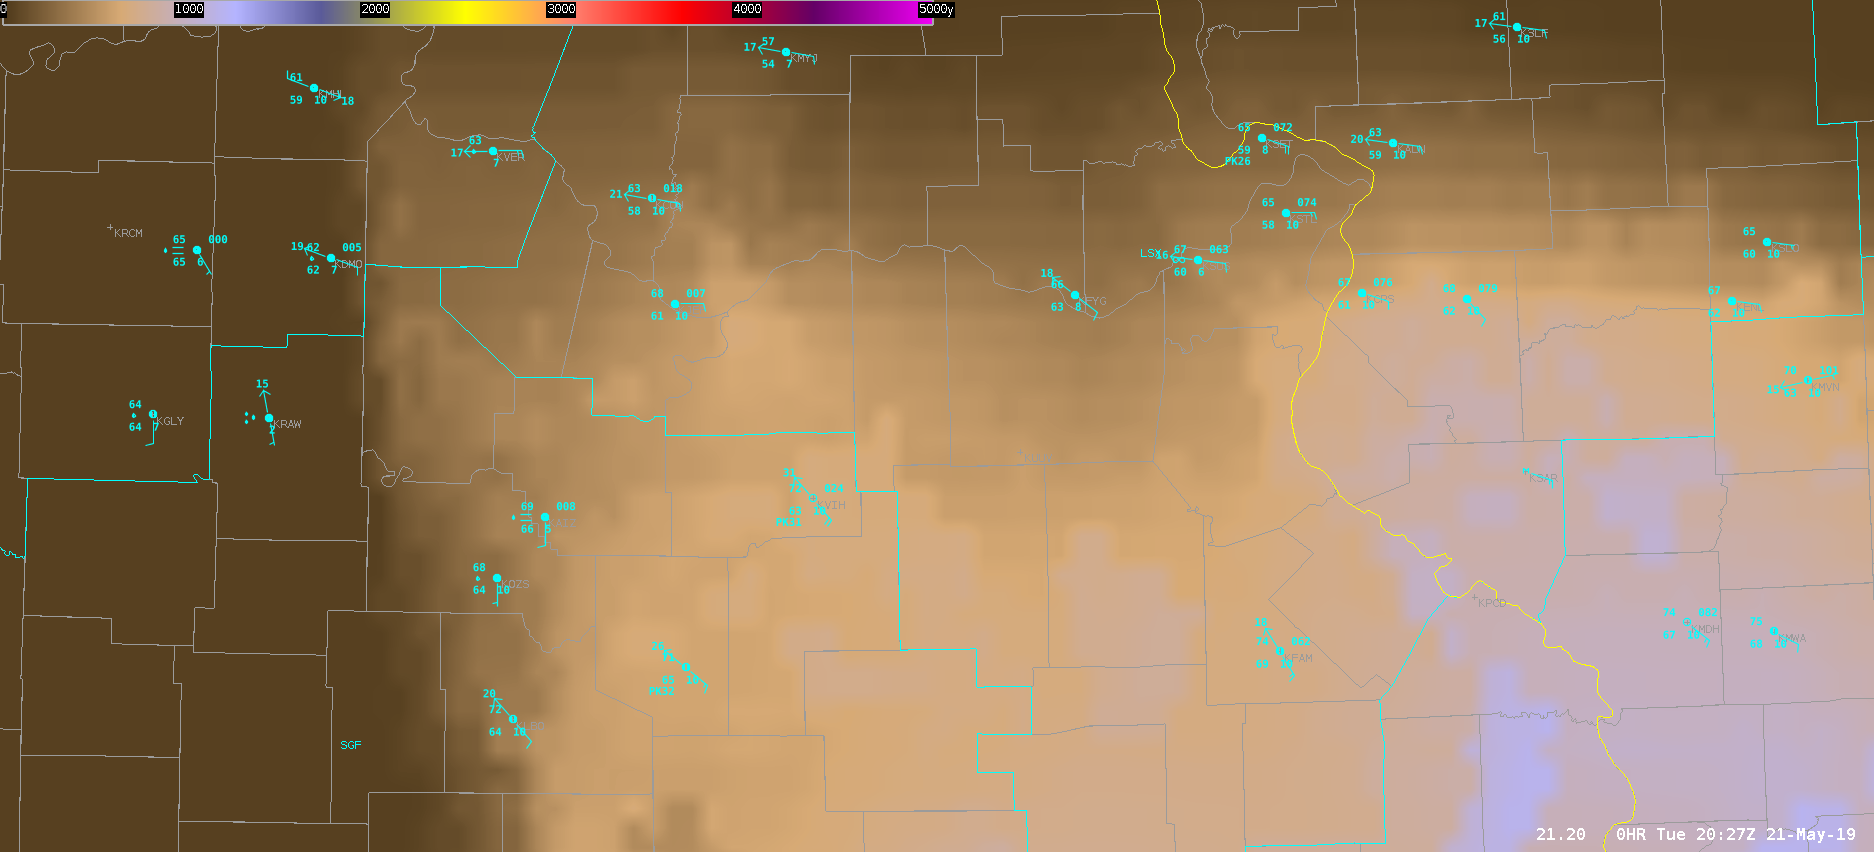
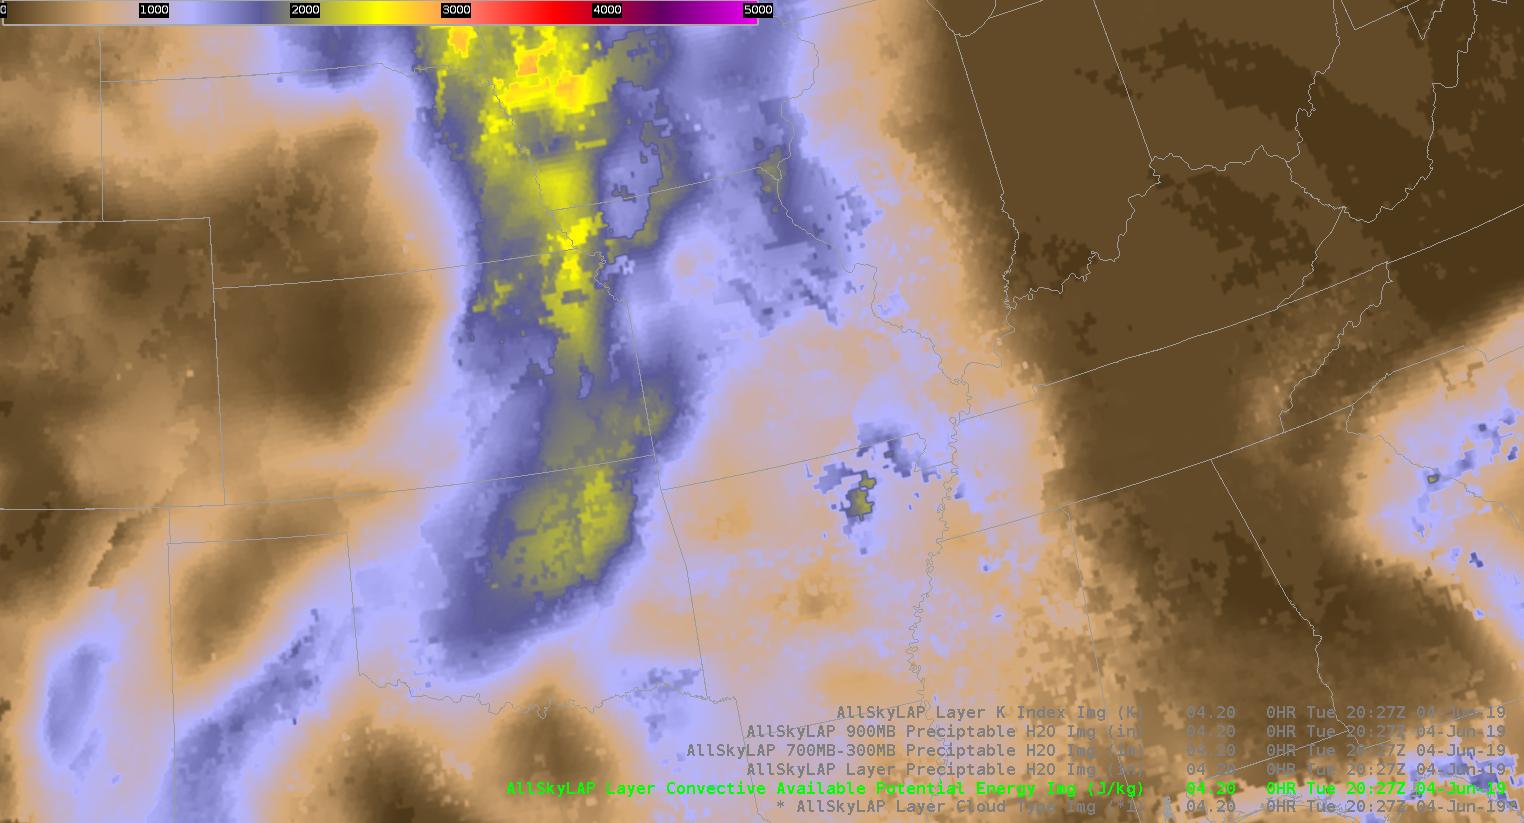
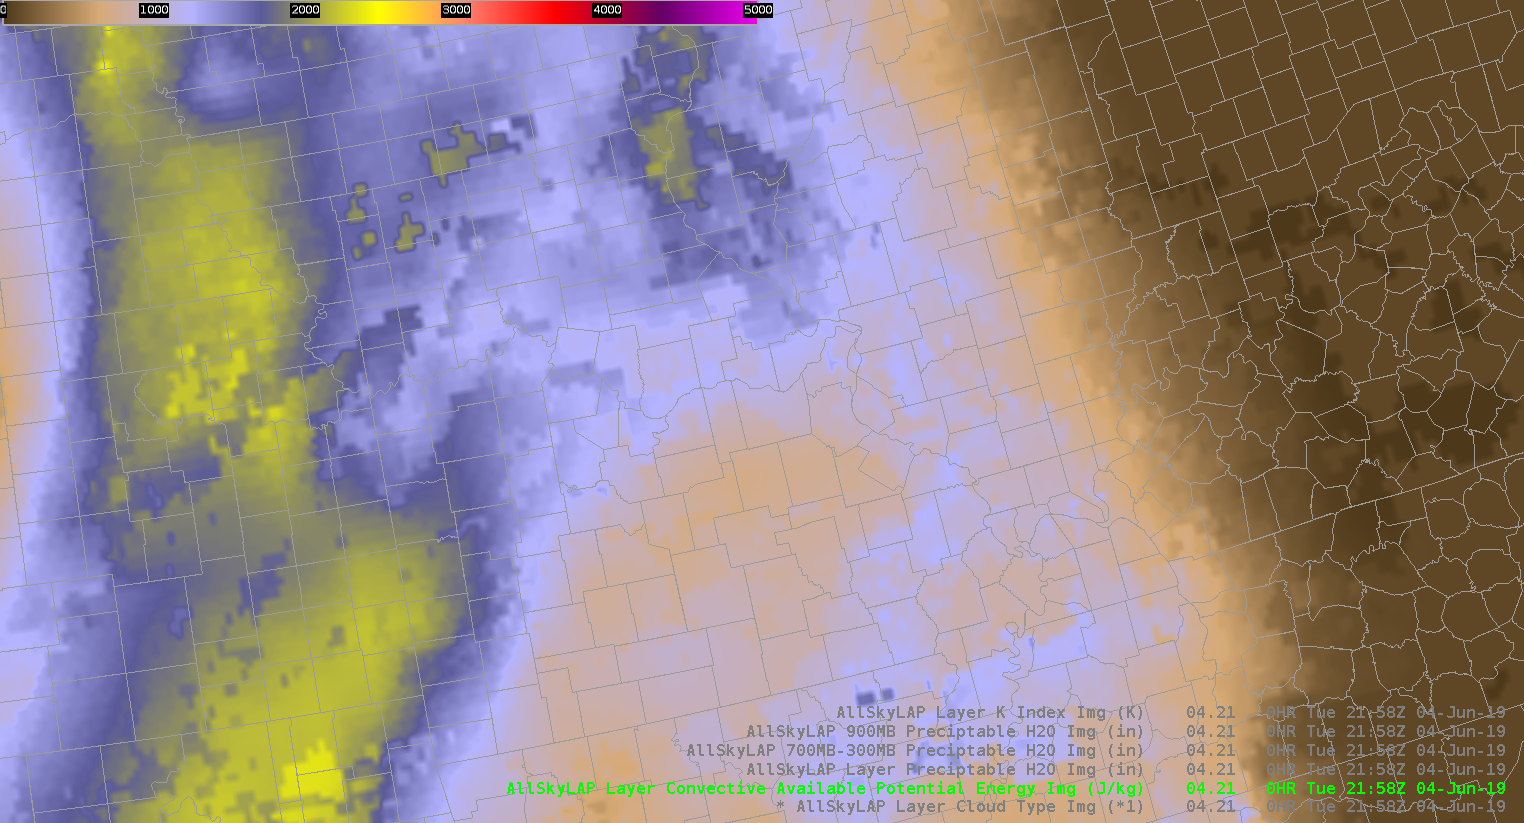
The allsky cape helped to find CAPE gradients and an increase in CAPE. The northern batch of storms were pushing into an area of increasing CAPE and in return they did intensify.

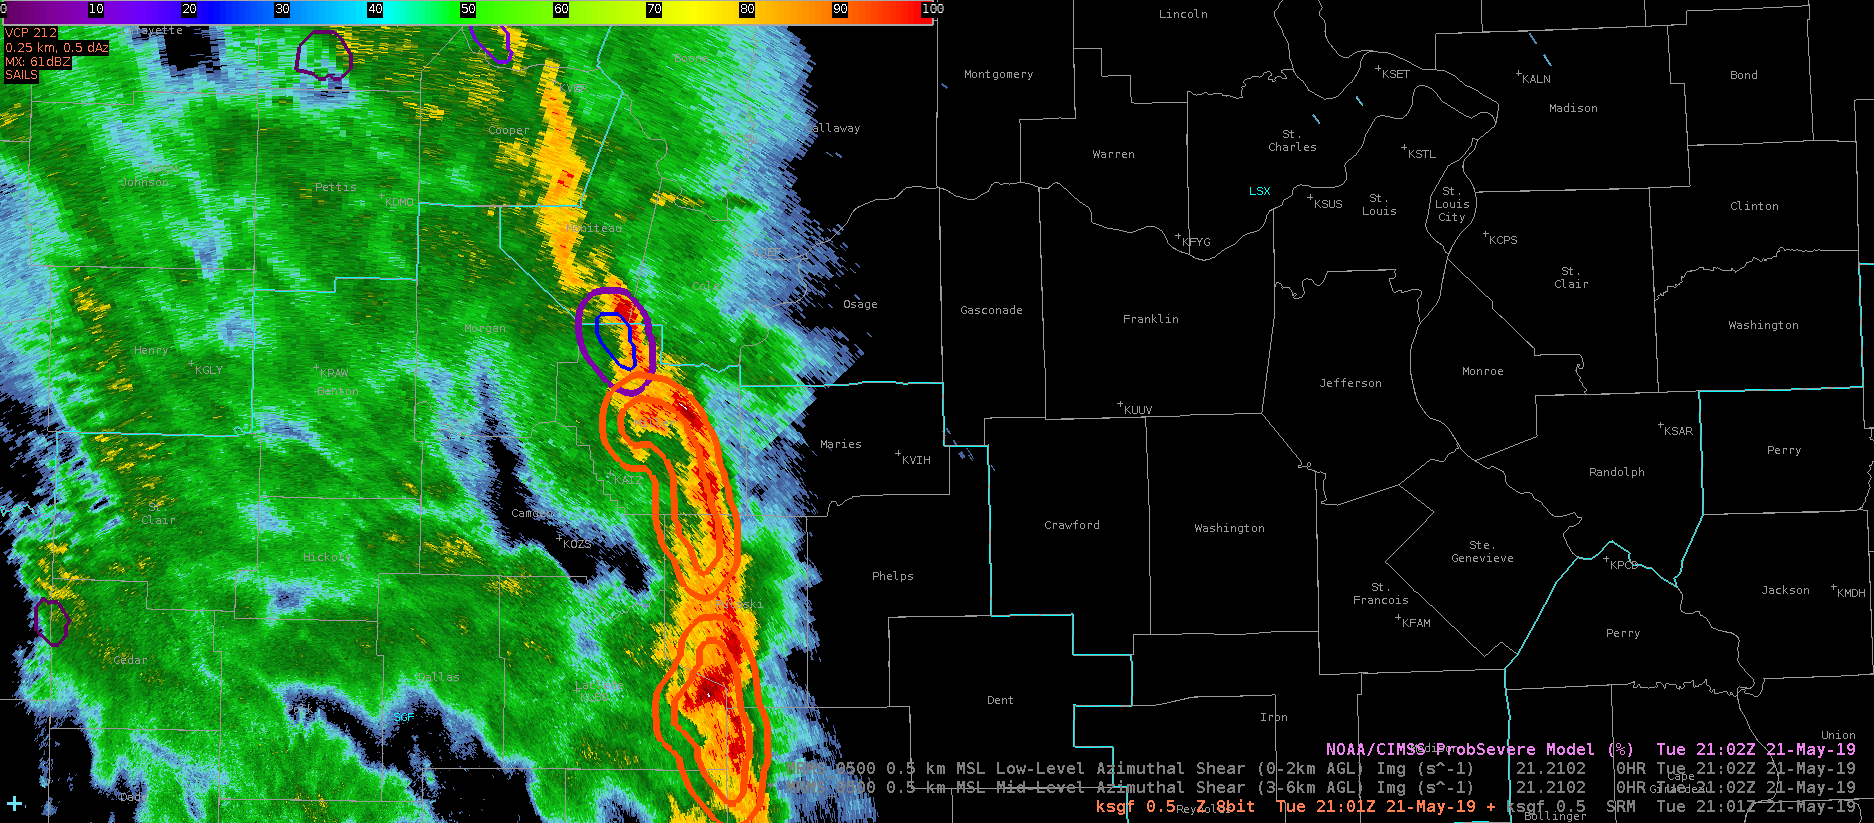
While deciding whether or not to issue a warning I also looked at AFA GLM data to see if there were new flashes developing which can be indicative of growing convection. That flashes aligned with radar and increased my confidence that storms would intensify.

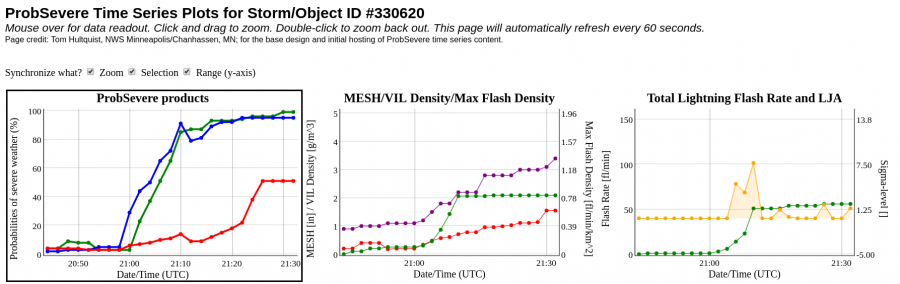
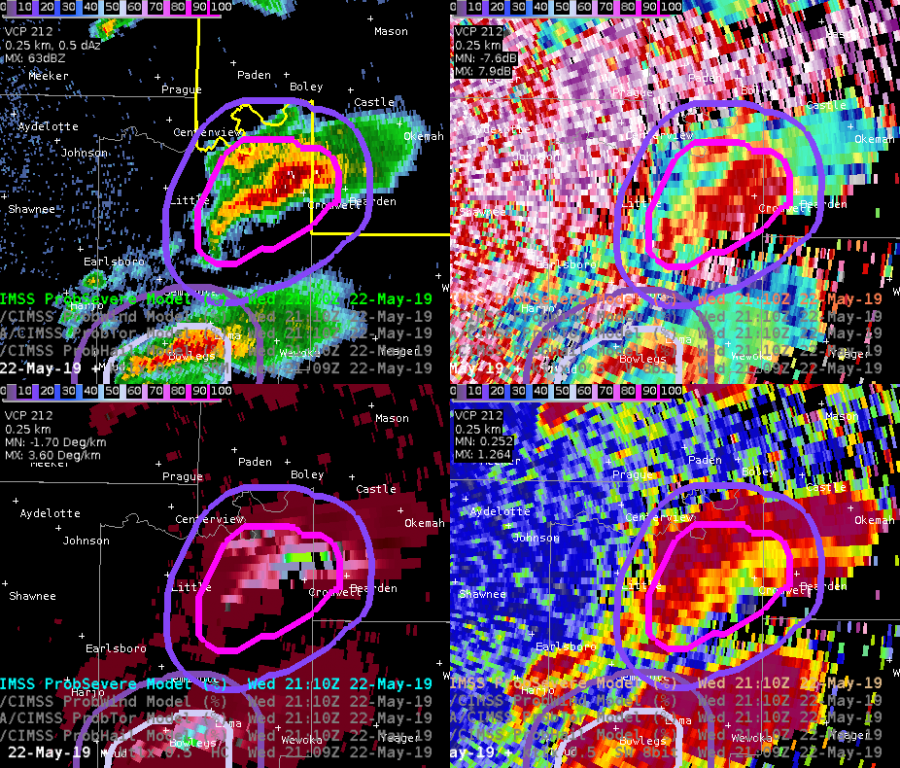
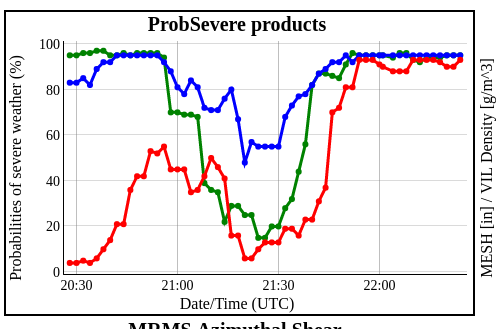
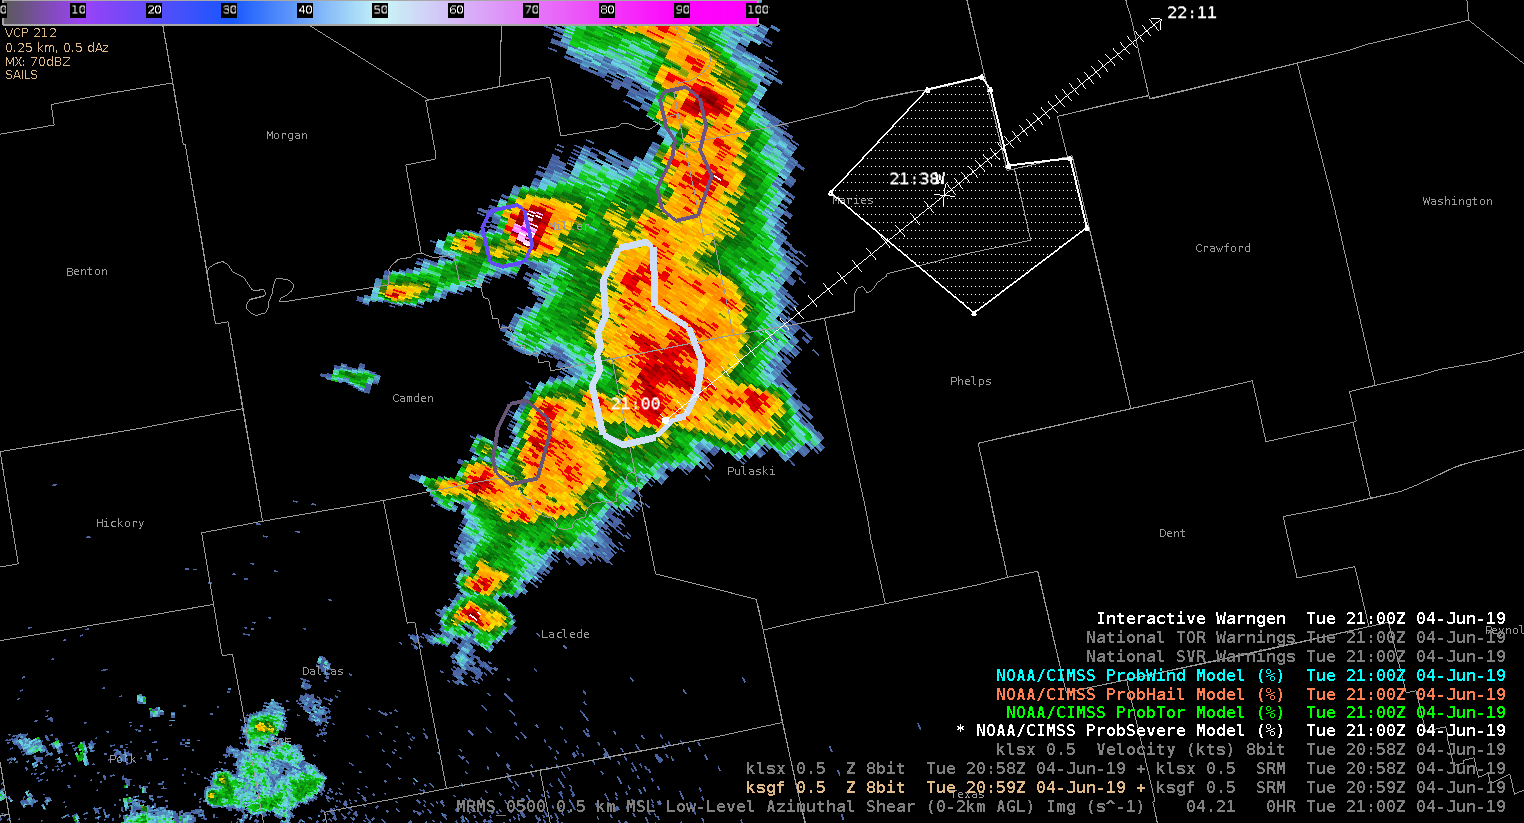
That lead to me issuing a severe thunderstorm warning. The prob severe data also ramped up. So I felt confident about my warning.

I also used NUCAPS sounding predictor to look at the cape during the rest of the afternoon.


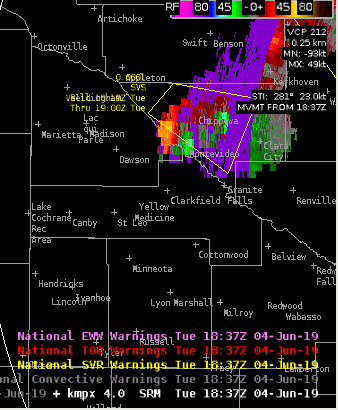
While watching storms in the Springfield area I tried using  NMDA. Even after magnifying the product it was still a bit hard to see. I’m note sure if there’s a way to make the circle bigger or more pronounced. It can get busy on an active day.

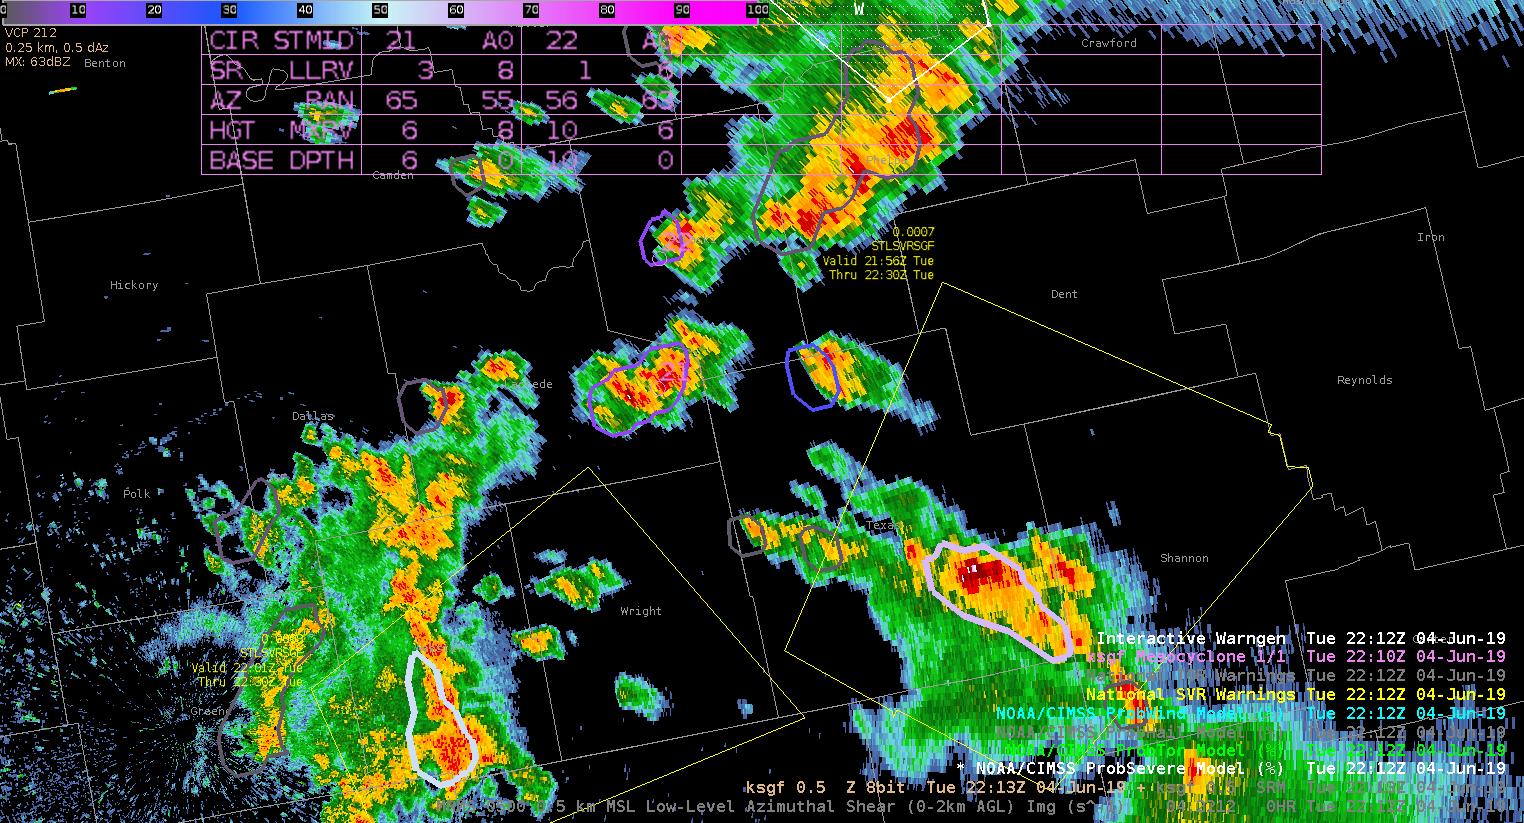
As I continue to track storms I’m using Allsky CAPE to see what type of environment they are moving into. The CAPE does increase farther east so that makes me anticipate convection wane over the next few hours. I will though pay close attention to the storm farther north since they will move along the cape gradient.

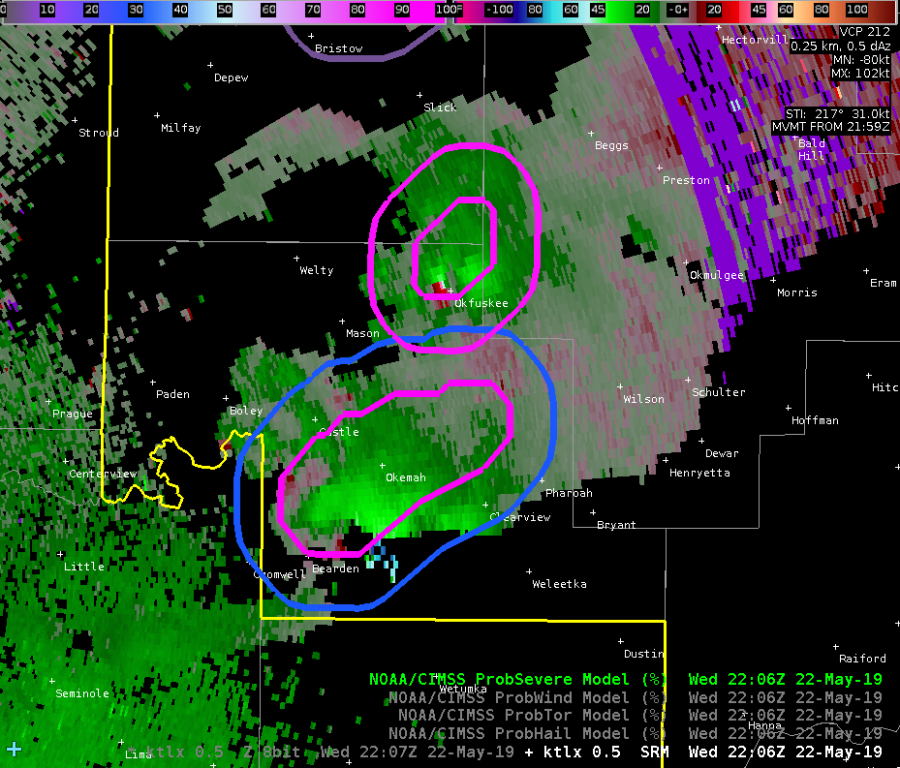
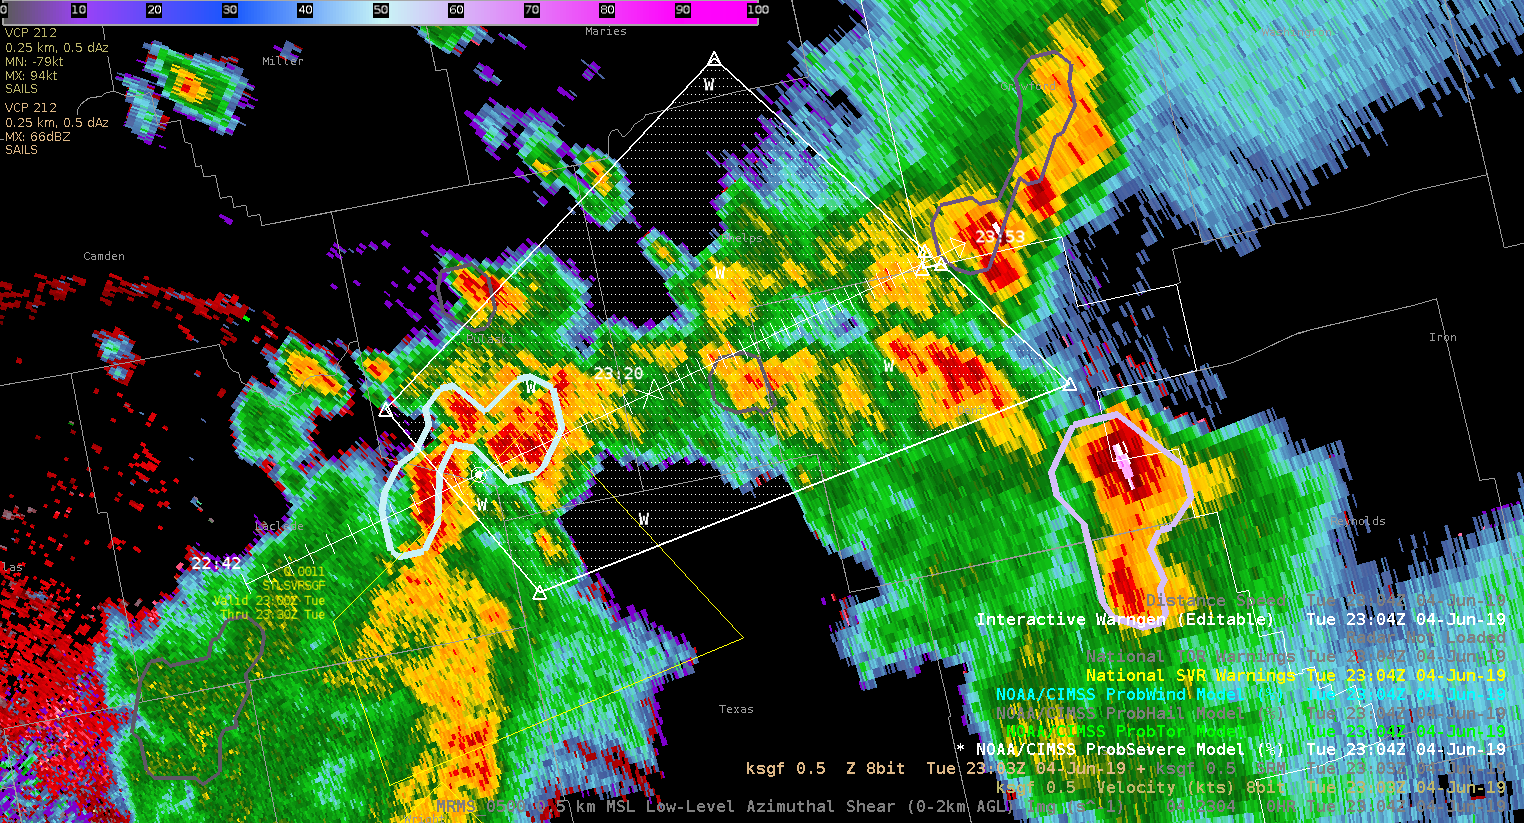
I also used probsevere to increase my confidence in warning for a cell in pulaski county. The velocity ramped up as well as vil values.


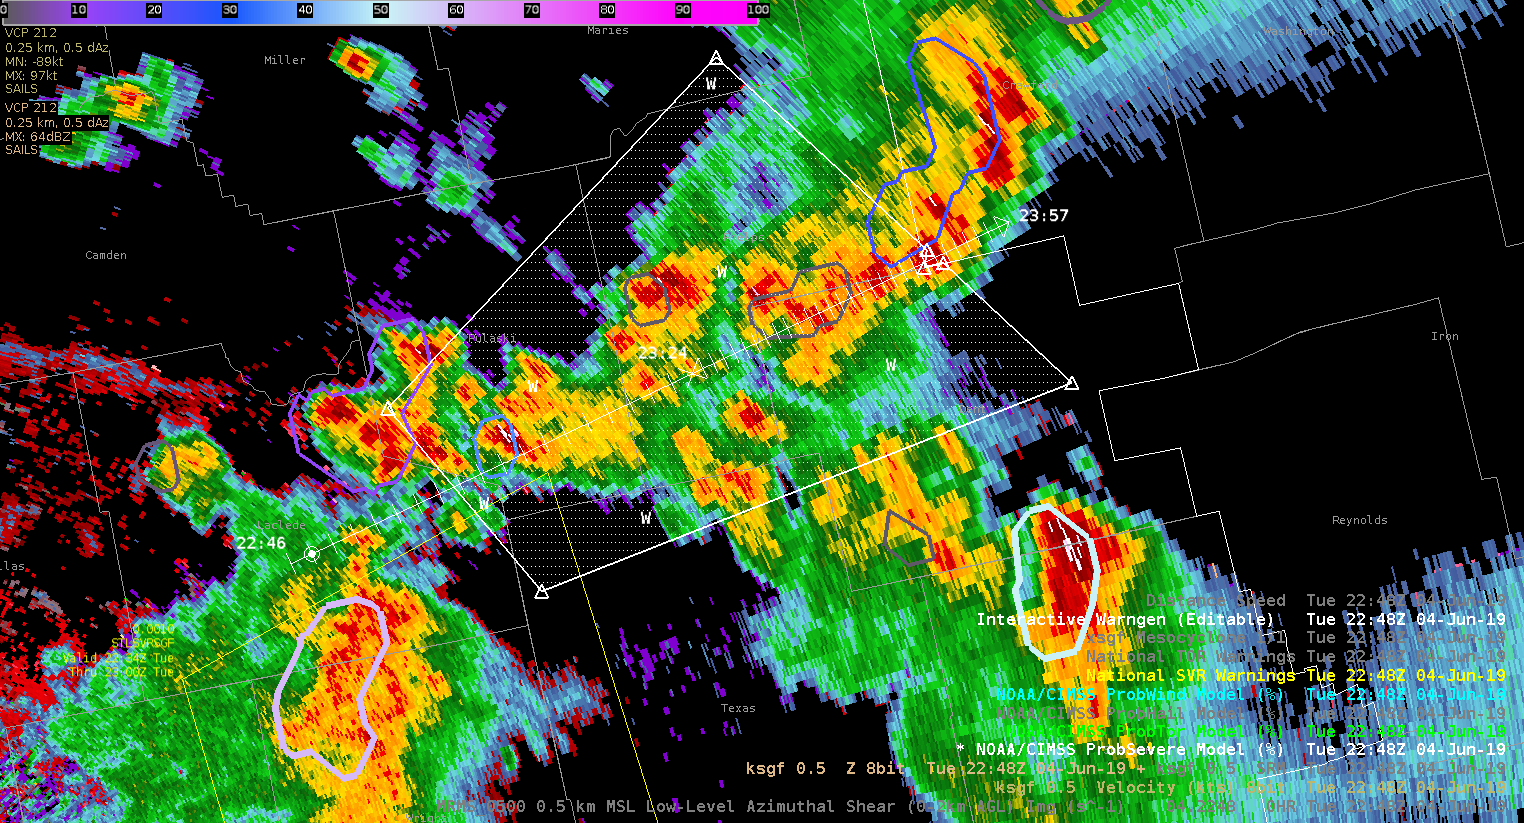
The increase in probsevere over a few scans prompted me to issue a severe thunderstorm warning.

Taylor Johnson

ProbTor/ProbSevere Impressive Performance

There were 2 adjacent supercells heading into the Tulsa CWA and ProbSevere kept them as  separate objects (correctly) despite their proximity. This is a great sign. Additionally, the ProbTor product effectively differentiated between a tight couplet (north, 70% ProbTor) and a weaker couplet (south, 34% ProbTor).

This case shows the ability of ProbSevere to differentiate storms with distinct features despite close proximity. It also shows that ProbTor is doing what we think it should based on velocity features. -Atlanta Braves

ProbTor Spikes to 72%, But is it Legit?

A semi-discrete cell tracked NNE of Little Rock, Arkansas. This storm developed a very tight reflectivity gradient on its southeast flank.  A few other notable features were an inflow notch and hook-like appendage.  Mitigating the severe potential with this storm was an outflow boundary displaced to the east of the updraft and low cloud flash counts (ground based) or cloud extent flash density (GLM).

The 0-2 km azimuthal shear generated what seemed to be a spurious bullseyes south of Searcy, Arkansas with values over 0.020 S-1. This data was input into the ProbTor algorithm, causing the spike to 72%.  The 0-2 km azimuthal shear derived with the new dealiasing technique never plotted values over 0.008 S-1. In fact, the bullseyes which were located slightly to the NW of the primary rotation track, never showed up in the new azimuthal shear product. -Roy


Difficult Warning Decision as Storms Enter LSX CWA

The northern extent of a line of storms that has produced sporadic wind damage is approaching the LSX CWA from the south. One of these storms has good reflectivity structure with a tight front reflectivity gradient and a rear inflow notch. However, these storms appear to be entering a more stable airmass. This is reflected in the ProbSevere probabilities of the storm in question compared with one just a bit further north:

The northernmost storm with the cool contours has only a 22% ProbWind and is in an environment of only 715 J/kg MLCAPE (per the sampling feature). Meanwhile the storm in question to the south in the warmer contours has a 90% ProbWind with 1220 J/kg MLCAPE. These storms are moving to the northeast toward the more stable air. Incidentally, the All-Sky LAP CAPE does not depict as sharp of a gradient in the CAPE compared with the RAP-derived ProbSevere values:

I am not sure which is more accurate but I suspect the model-derived values are more accurate in this situation.

Furthermore, a weakening trend in the Flash Extent Density is observed on the northern end of the line:

This storm still deserves a warning, but we will see how quickly it weakens.

Ron Dayne

ProbTor during Tornado Warning

The NWS office in Little Rock started issuing tornado warnings on storms along the line so I pulled up the ProbTor product to see how it performed. For the storm near Knoxville, I can’t figure out what’s going on but I’ll attempt to document it here. For each time, I plot CPTI top left, LZK SRM top right, low-level AzShear bottom left, and spectrum width bottom right.

At 1902, the algorithm has a 60% ProbTor based on high LLAzShear (0.021 /s). I don’t see any high values on the low-level AzShear product, but perhaps I’m missing something.

At 1904, a bullseye of high LLAzShear pops up just east of Knoxville. ProbTor is still 60%, which now makes sense to me. This identified shear region is not in the right place for a tornado and is just convergence along the line, but the ProbTor uses what it has and seems to generate an understandable ProbTor.

At 1906 the LLAzShear bullseye east of Knoxville persists,  but now the ProbTor drops to 19% with a LLAzShear max value of (0.009 /s). I still sample 0.020 /s in the bullseye. Spectrum width is not horrible (~7 kts) in the area of the AzShear bullseye. The AzShear detection is obviously misleading for a tornado, but the ProbTor product does not seem to be performing as we’d expect it.

At 1908 the bullseye in AzShear goes away and the ProbTor drops even further to 6% (as expected). The persistence of the bullseye in AzShear with an associated significant drop in ProbTor is perplexing for this case! -Atlanta Braves.


CPTI Increasing in Concert with an Observed Tornado

A tornado was observed via news footage near Mangum, OK.  The formation of this tornado was associated with an increase in CPTI for strong tornadoes to 46%:

The CPTI for violent tornadoes also increased to near 6% (not shown).

The ProbTor on this storm increased markedly between 2140-2155 UTC:

This increase was driven by an increase in AzShear:

Ron Dayne