AllSky vs. ProbSevere: Which MLCAPE is best and where?

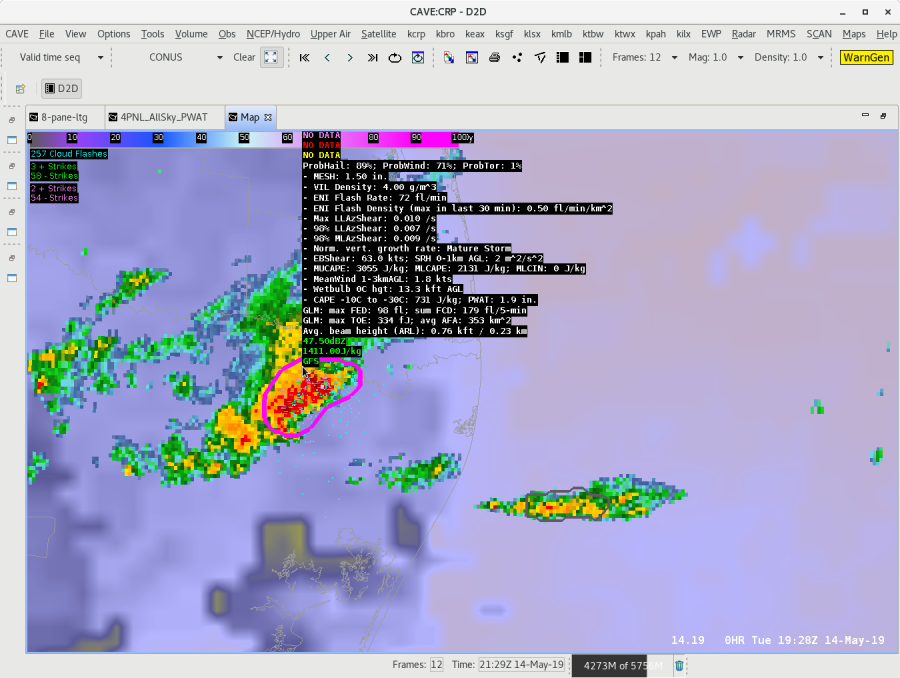
When utilizing the AllSky CAPE image product (MLCAPE), and comparing it to the ProbSevere MLCAPE values for reliability purposes of both tools, it is noticeable the differences between the two when there’s precip. This is due to the fact that most rain areas will not be able to be sampled by the satellite (clear/cloudy), and will be utilizing the GFS data in these areas where ProbSevere is located.

One way around this difference reliability issue is to scan the surrounding areas that are utilizing satellite data (preferably a “clear” spot), and in those cases, the MLCAPE values sampled seemed more comparable to the ProbSevere MLCAPE (RAP) of the storm than that of the GFS sampled MLCAPE data. The GFS sampled locations almost always show a lower MLCAPE value than the ProbSevere MLCAPE. The downside of sampling farther away from the storms/precip areas is that you are sampling rather far away from the storm environment. It’s also difficult to say that the ProbSevere MLCAPE is more accurate or not and what the reliability factors may be.

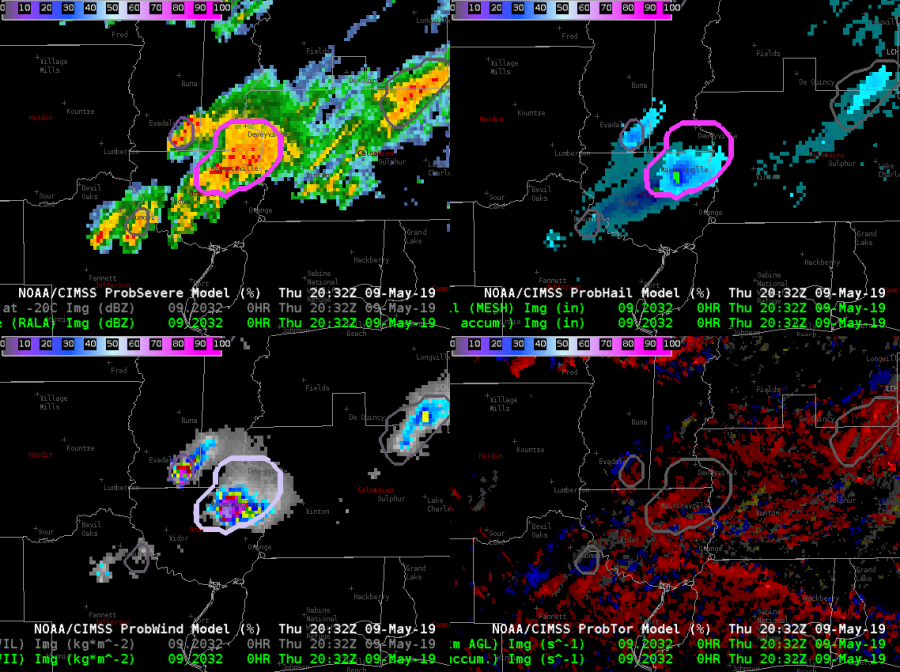
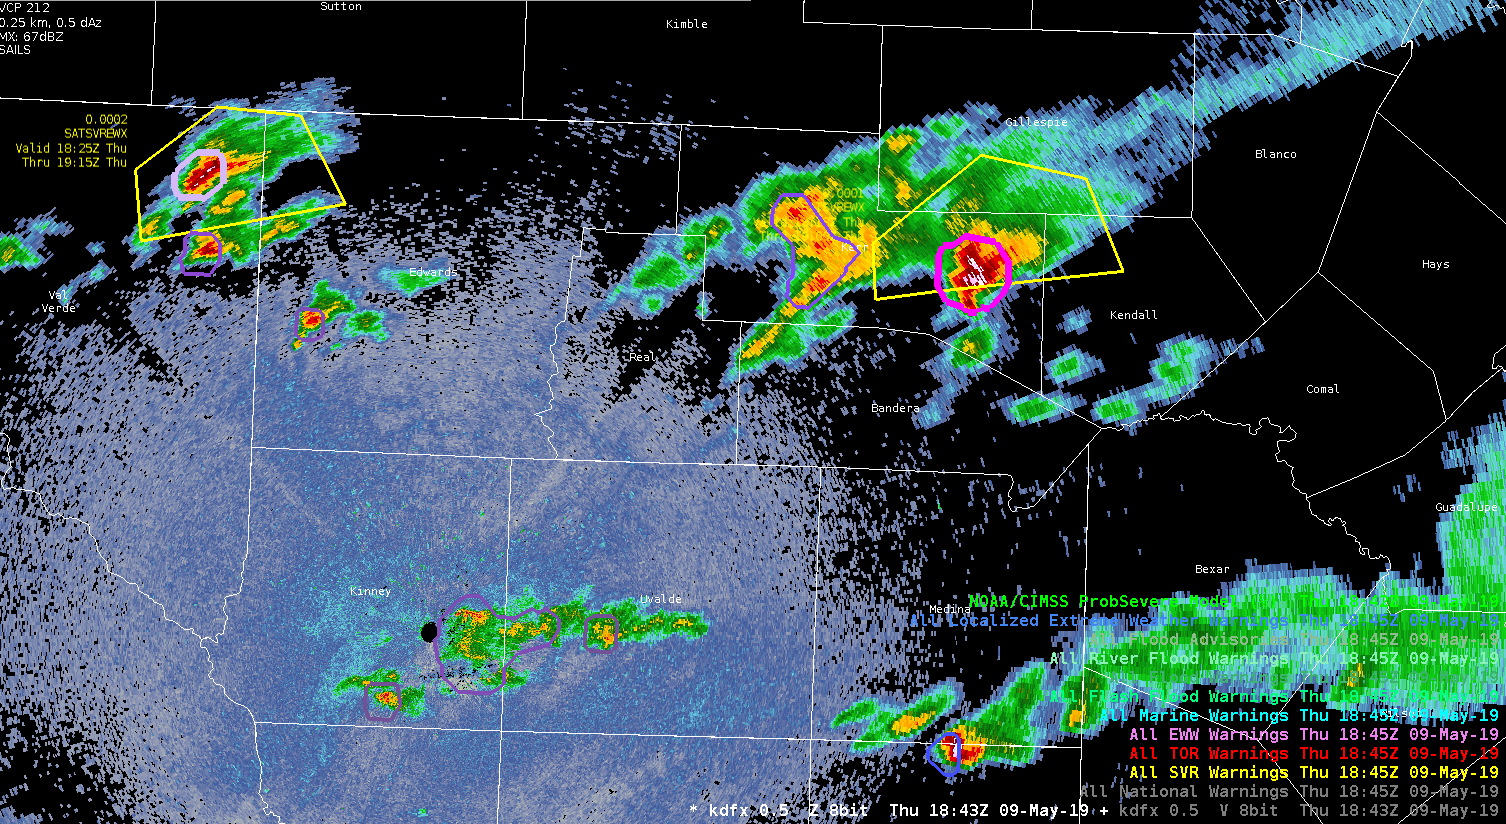
Below is an example of a storm over TX that is sampling the MLCAPE of the GFS (green text) and of the ProbSevere RAP (white text). -shearluck

ProbSevere Helped to Hold Off On TOR Warning

Here is an example of a long lived supercell where the trends are very important to monitor. Notice the uptick in Prob TOR but then backed off.  AZShear has been impressive for several volume scans.  Prob TOR trends kept me from issuing a TOR warning, and provides some security in not issuing a warning along with other products.  As a side note,  it would be nice to sample some sort of maximum wind gust product, much like we get from MESH with the estimated max hail size.

ZDR_Arcophile

Warning Decision Influenced by ProbSevere

Since our shields have been engaged all afternoon I decided to look at a storm to our east. Below are a series of reflectivity images from the three lowest scans (0.5, 0.9, and 1.3)…

I won’t lie to you, if I were back in my home CWA I would have probably issued a SVR based on these scans, but I decided to hold off on issuing one today until we got close to 90% probabilities to see how ProbSevere did.  So what did ProbSevere show? Here is a sample of various MRMS products overlaid with ProbSevere contours…

And here is a time series for this storm looked like…

These trends looked pretty impressive, with ProbHail peaking around 86%. The increase in probabilities make sense, with MESH peaking around 1.4 in (below in purple).

We will have to wait and see if my decision to not issue a SVR based on a ProbHail is justified, but based on the lack of any reports, I think it may have been a good call.

UPDATE…The storm in question got one severe hail report.

Prob Severe New Cell Detection

Here’s an example where Prob Severe was slow to detect a new cell on the southwest flank, which is a fairly typical severe scenario.  And when it finally does detect the cell, it is combined with the already large conglomeration of convection.

ZDR_Arcophile

Prob Severe Combines Discrete Cells

Here is a prime example of two warned storms with distinct updrafts that were combined due to their close proximity to each other. As opposed to being slow to recognize splitting cells, ProbSevere actually took two established discrete cells with separate updrafts and combined them.

ZDR_Arcophile


MRMS and ProbSevere – SAD Match made in the EWP

Wanting a good way to keep up on the environment while also monitoring for storm development?  Give this combo a tryout (and note, I totally stole this from another EWP participant this week.  Why?  Because it works!)

Top left: MRMS Reflectivity at Lowest Altitude (RALA), Reflectivity at -20C, ProbSevere All
Top right: MRMS Maximum EstimatedSize of Hail (MESH), MRMS 60 Minute Hail Tracks (50%             Alpha), ProbHail
Bottom left: MRMS Vertically Integrated Liquid (VIL), MRMS Vertically Integrated Ice (VII,                    100%), ProbWind
Bottom Right: MRMS 0-2km Merged Azimuth Shear, MRMS 0-2km Rotation Tracks 60-minute          accumulation (35% Alpha), ProbTor

The nice thing with this display is that you can quickly sample any of the objects to get details on what is going on with any given storm to keep situational awareness.

Yeah, that’s a lot of text on the 4-panel but each one is specific to the threat in the pane and the ProbSevere (top left) is a bit of everything mixed in.  So far, it has worked with all convective modes we’ve seen so far in the Testbed.

-Dusty


Downward Trend in ProbSevere Time Series & GLM Results in Warning Cancellation

A noted downward trend in the ProbSevere Time series along with a downward trend in the GLM products (not pictured) resulted in this warning forecaster to cancel a SVR for Kerr County early. This early cancellation may not have occurred had these products not been available, potentially leading to areas being unnecessarily warned for a longer amount of time.


HWT Issues SVR 3-Min Before Field Office Does Due to GLM & ProbSevere Data

A strengthening thunderstorm in Val Verde County was noted by Prob Severe and GLM data. The Average Flash Area and Minimum Flash Area values quickly increased in the area of a strengthening updraft across Val Verde County. The combination of these factors, along with a noted uptick in ProbSevere  data, prompted the HWT warning forecaster to issue a SVR for Val Verde County at 1:25pm CDT with WFO EWX issuing a SVR for Val Verde at 1:28pm CDT.

Increasing trend in Prob Severe products

Between 1840Z and 1844Z, the ProbWind increased from an already high level of 85% to 84% as a bowing segment developed and moved into northern Brazos and Madison Counties.  Also of small note, ProbHail increased from 15% to 29%, and ProbTor increased from 17% to 20%.


ZDR_Arcophile