

Loop from KAMA of legacy MDA (top left), DMDA (top right), NMDA (bottom left) with ProbSevere overlaid on the velocity data. 
Category: ProbSevere
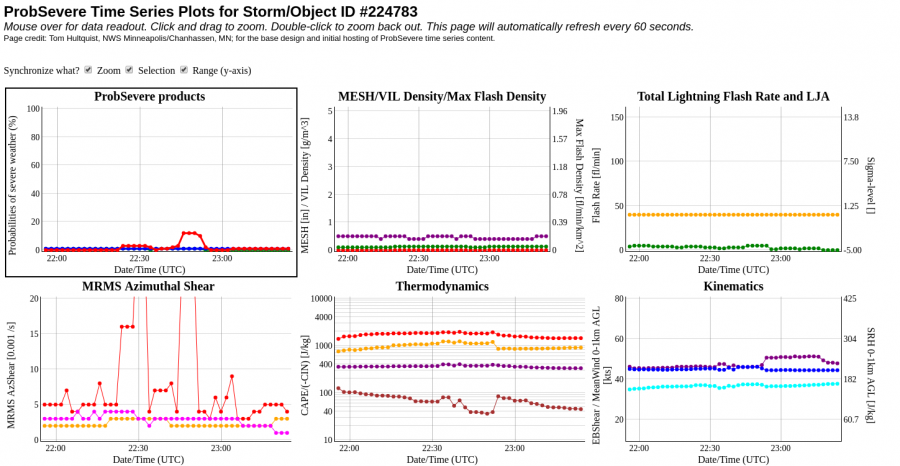
Using ProbSevere Time Series for Situational Awareness
A particular storm in the CWA, which had previously been quite strong, had weakened and I diverted my attention elsewhere. However, I kept the ProbSevere Time Series displayed on another monitor. Later, I noticed that the Time Series indicated that the storm was potentially re-intensifying (top left image) and it caused me to direct my attention back to the thunderstorm.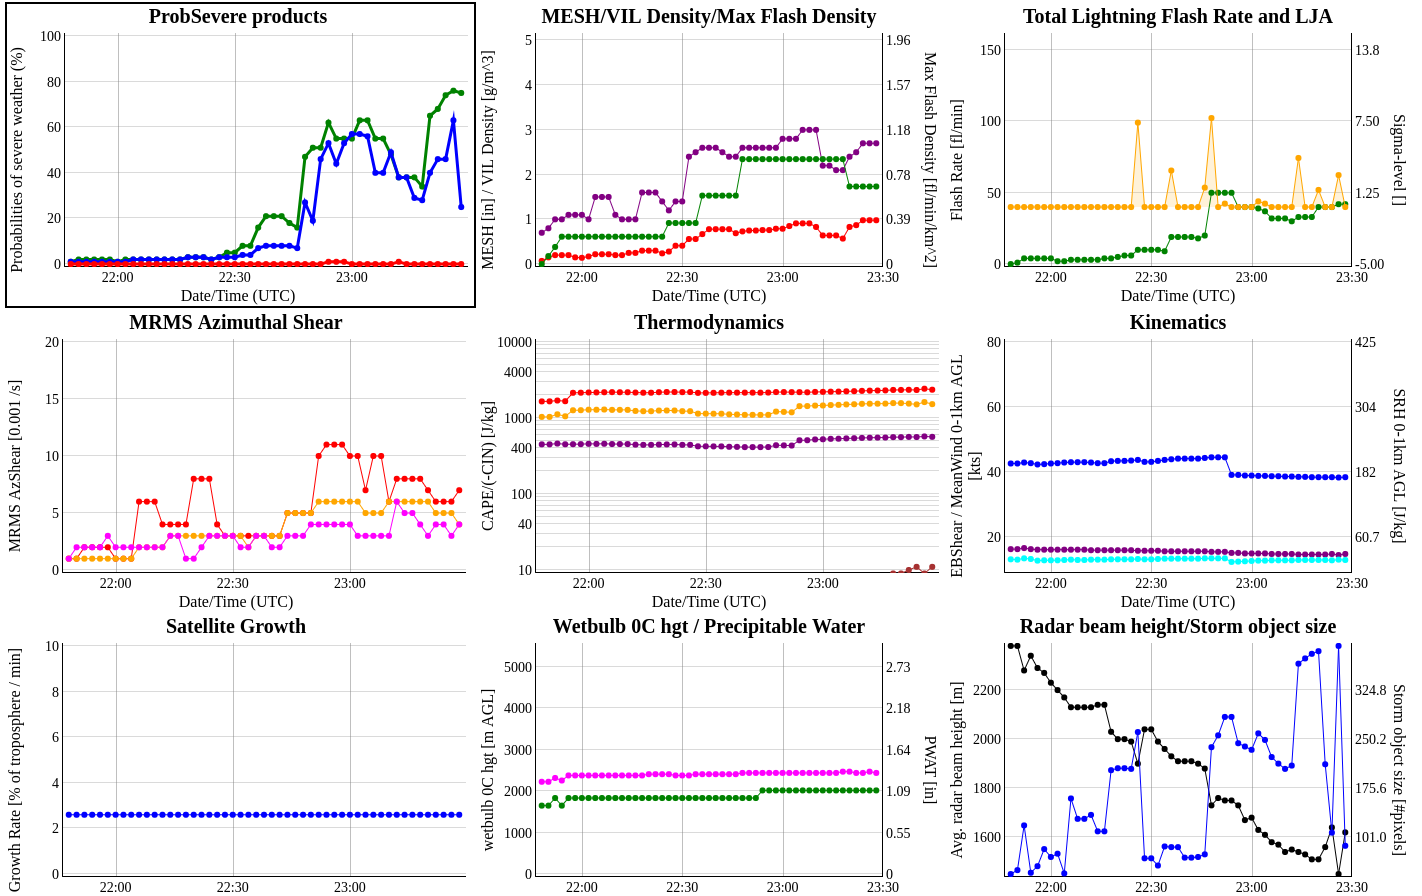
ProbTOR in Stratiform Rain???
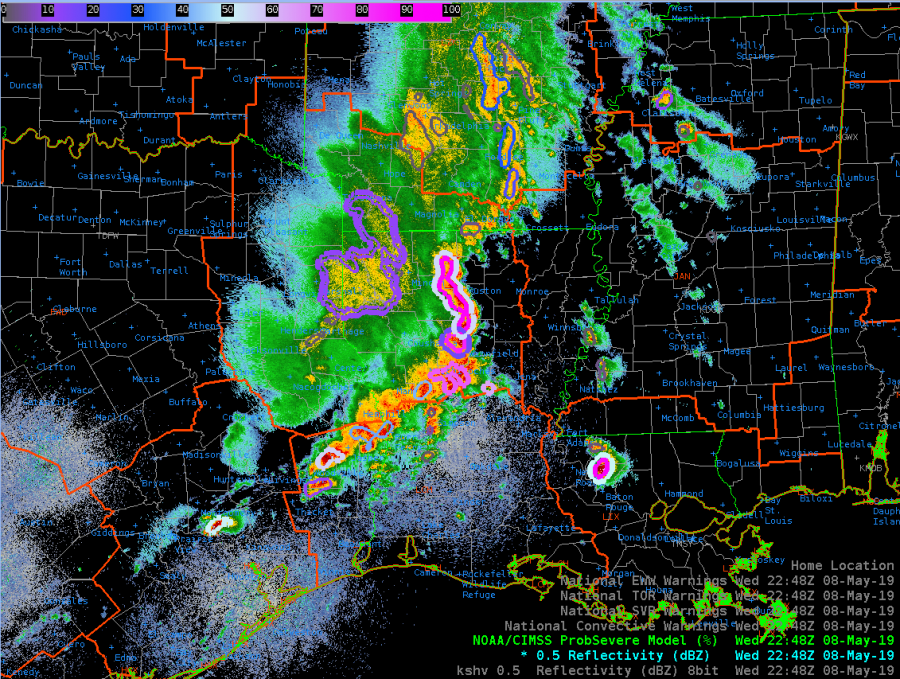
Here is an example where the ProbSevere algorithm identified an area of concern in heavier stratiform rain. ProbTOR values peaked around 12% in this area. This is a good reminder that YMMV when using ProbSevere.
ProbSevere & Satellite Imagery
Although ProbSevere products are typically used coincident with radar data, but can also be applied to satellite imagery. Using ProbSevere with satellite imagery can provide a visualization as to where the strongest parts of a thunderstorm may be located .
This loop shows developing & strengthening convection across the Texas Panhandle and far western Oklahoma, via Day Cloud Phase imagery with ProbSevere overlaid. 
Jumping TORprob
Fluctuating TORprob occurring within small group of weak updrafts. Nothing of note to show on AzShear.
ZDR_Arcophile
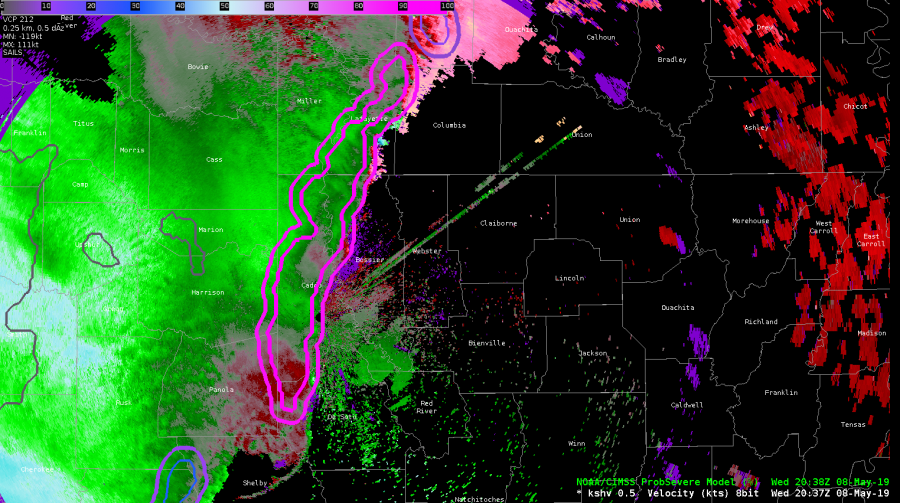
ProbTor 97% / Is It Useful For a Line?
The Prob Tor is 97% for this long line in the SHV CWA. Is that useful as a forecaster? It might seem like it isn’t, but let’s discuss. We’ve been watching circulations along the line through the shift. Early on, we issued several TORs, but in a number of cases, the circulations have been short lived along the segment.
So, as a forecaster or a WFO, you’ve got two ways you can go here in the current environment….
1) You can issue a SVR for straightline wind for the whole segment for a longer length of time (45-60min) given that the environment the line is moving into isn’t changing, and try to keep up with shorter lived, individual TOR warnings for the circulations
-or-
2) You can issue a severe thunderstorm warning for a shorter period of time for straightline wind (30 min) and tag that “lines can produce tornadoes) and see if that characteristics of the leading edge show clearer tornadic signs at some point.
At least the ProbTor alerts you to a decision to be made. It goes both ways in WFO offices in this situation.
NMDA and ProbTor Helping Along Line

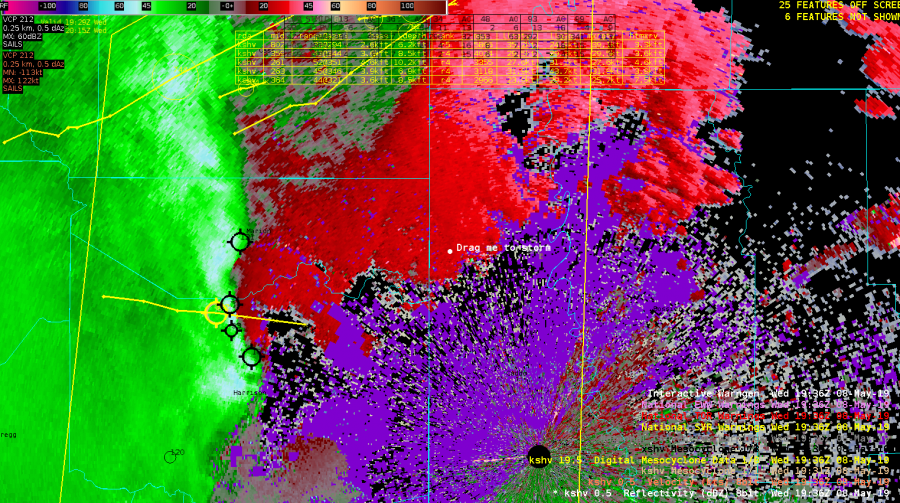
ProbTor and NMDA helping forecaster confidence for issuing TOR warnings along bowing segment in SHV CWA. This is a situation that I don’t deal with much and in consultation with my partner for today we issued another TOR within the line we have a SVR out for.
-icafunnel
ProbSevere Split It
Quick update to a previous post. Like before, the first image shows GLM Event Density and the second shows base reflectivity with ProbSevere. It took ProbSevere’s tracking algorithm around 15-20 minutes to splitting the storms into multiple ones. I would have been awesome if it happened earlier, but I’m not complaining. It happened quicker than I thought it would.
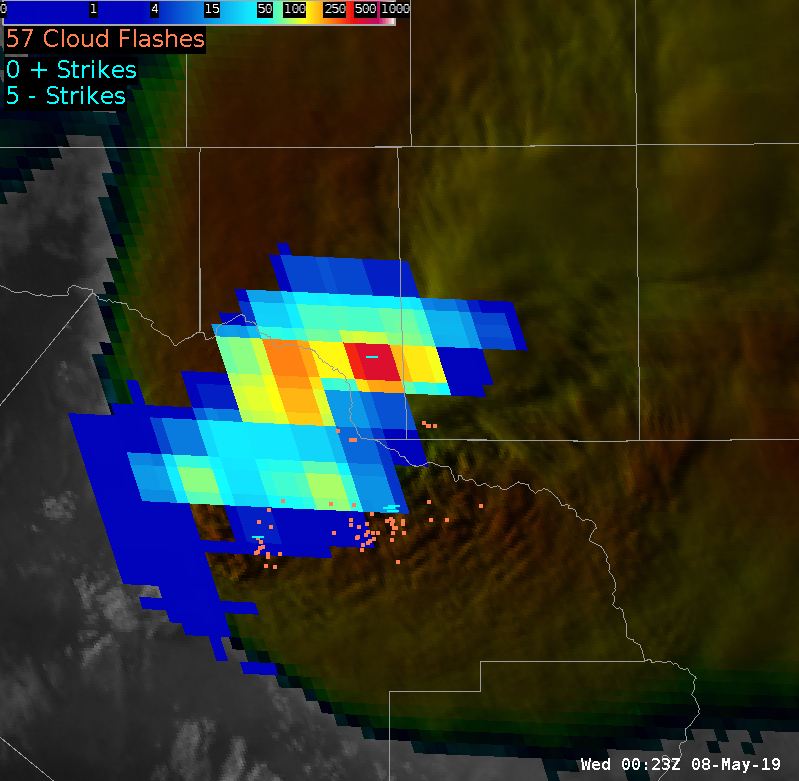
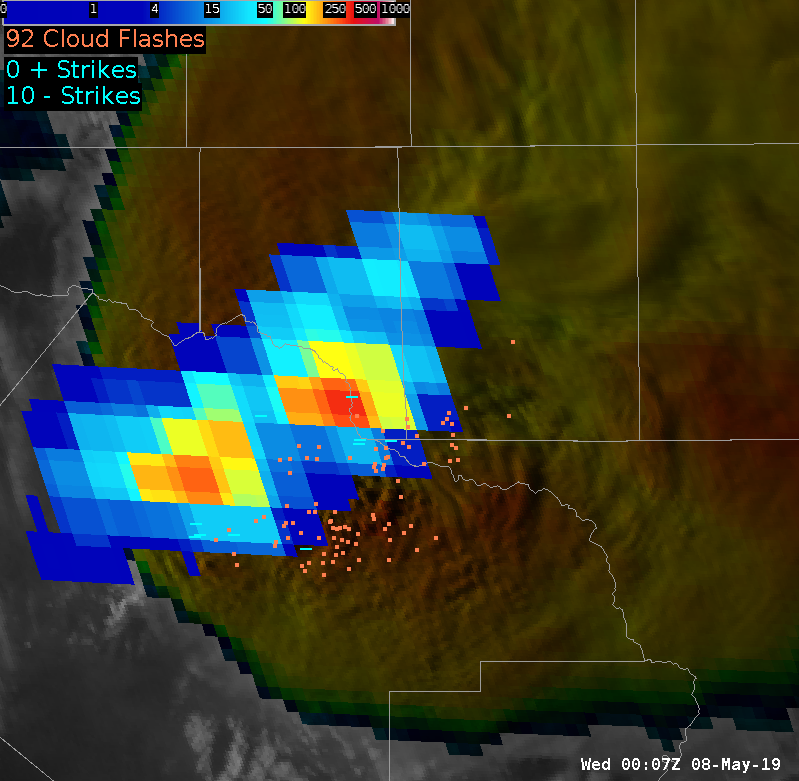
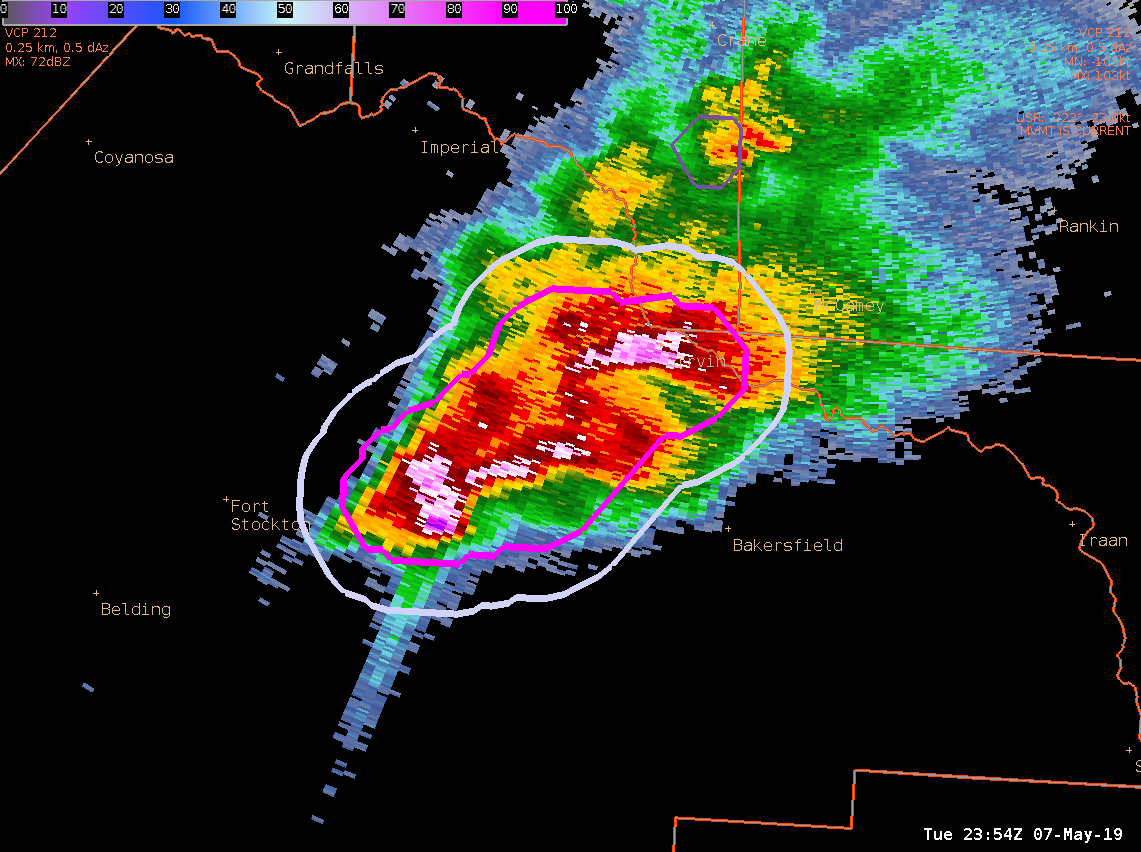
Will these storms split finally in ProbSevere?
Below are a few images for a long-lived storm in Pecos County that is starting to split. The first image shows GLM Event Density with two separate hot spots while the second image shows base reflectivity with ProbSevere contours. It will be interesting to see if/when the ProbSevere tracking algorithm will splits the storm into two storms rather than one merged storm.
GLM Helped Situational Awareness
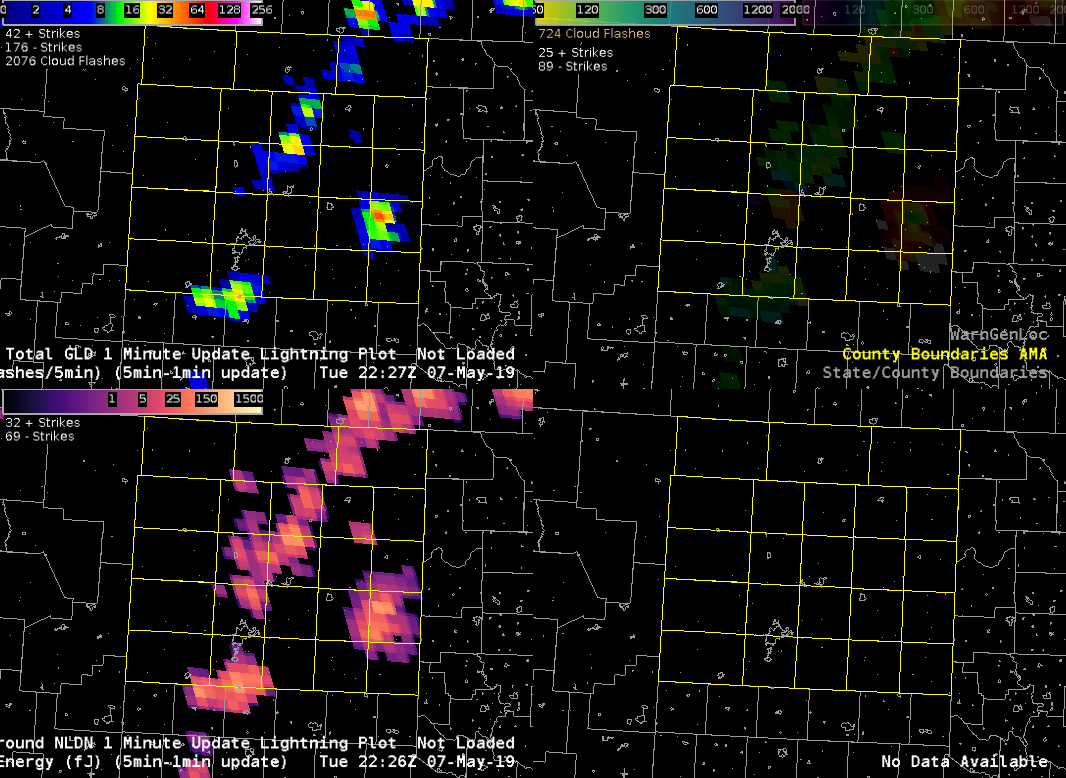
GLM data helped me stay situationally aware as new updrafts quickly strengthen on eastern edge of CWA.
Issued a warning on this cell about ten minutes after upon continued strengthening in the radar fields and prob severe (hail/wind) values rapidly increasing (I find the time series plots very valuable). Given storm environment I expect the storm to continue to strengthen to severe levels.
-icafunnel