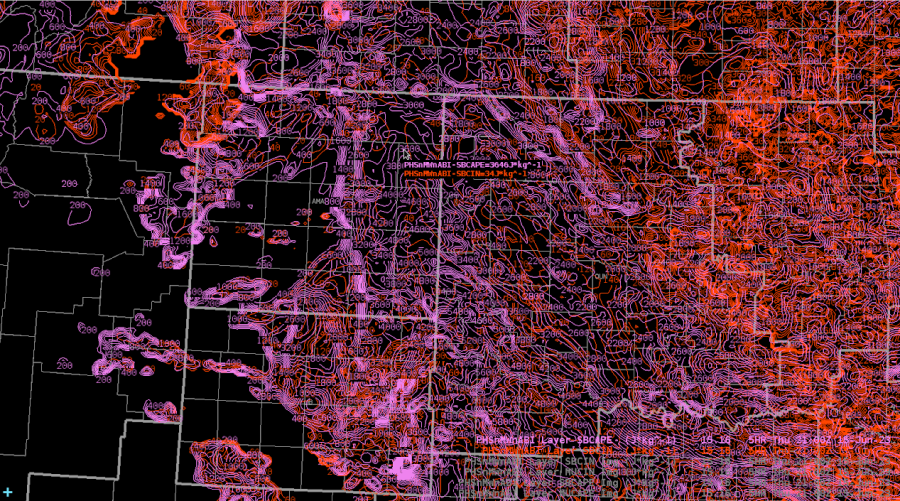
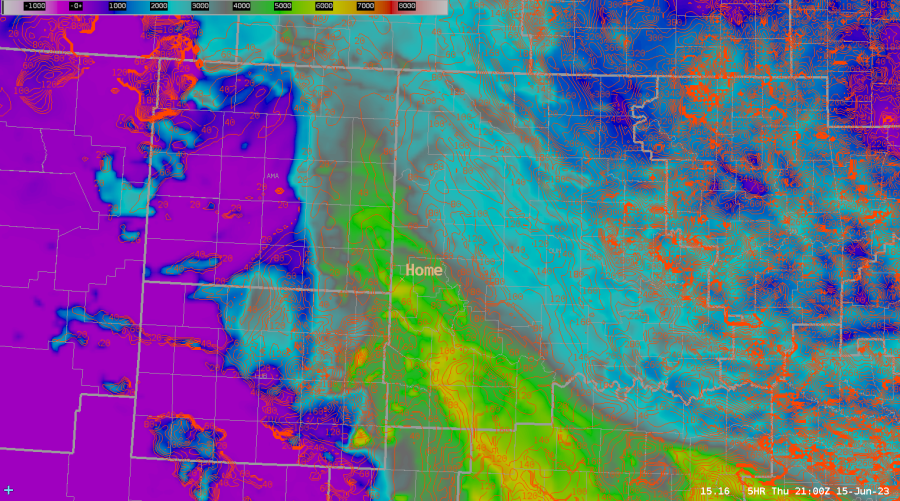
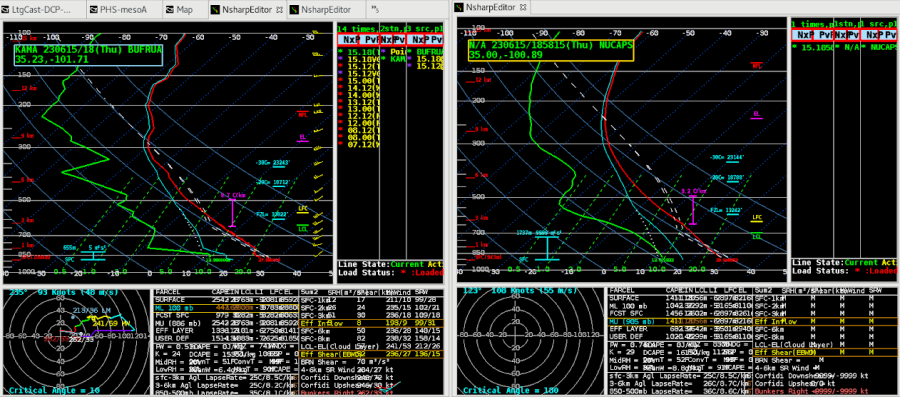
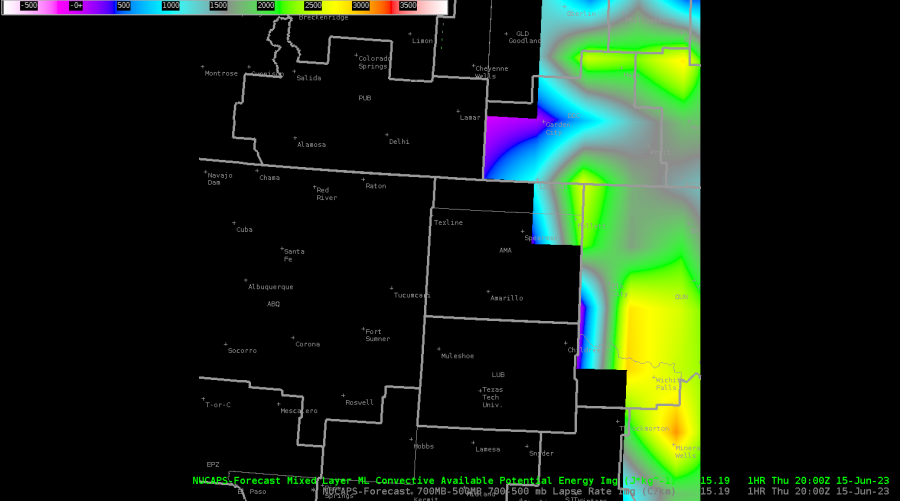
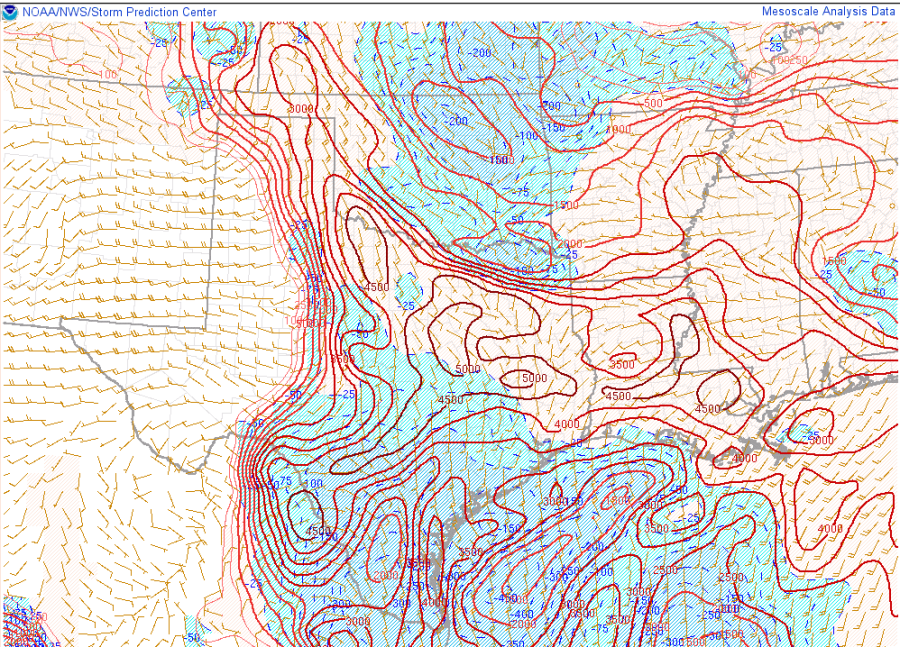
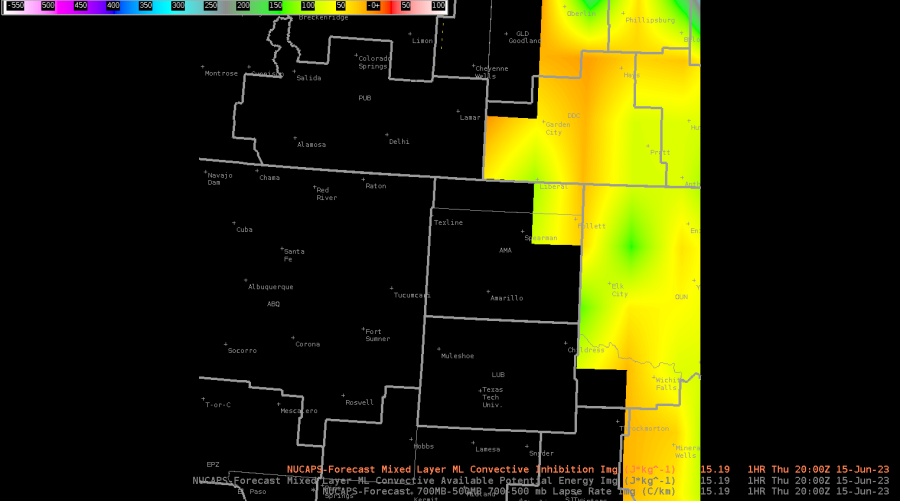
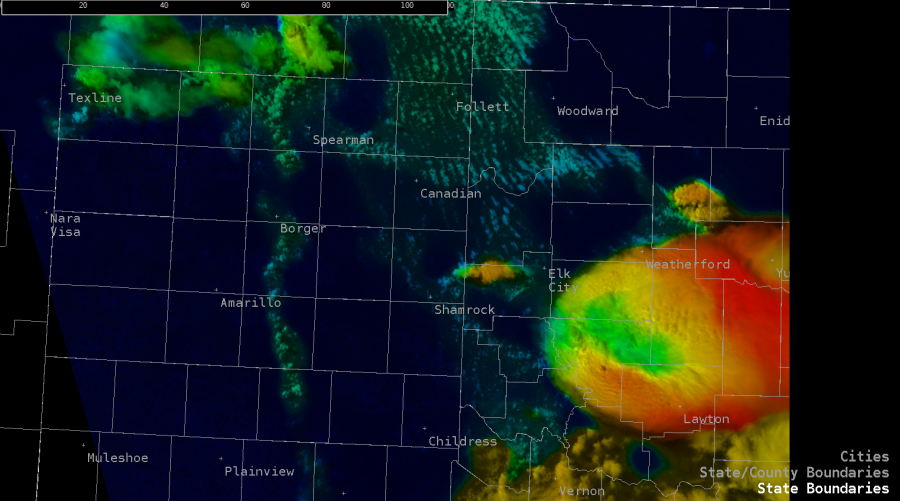
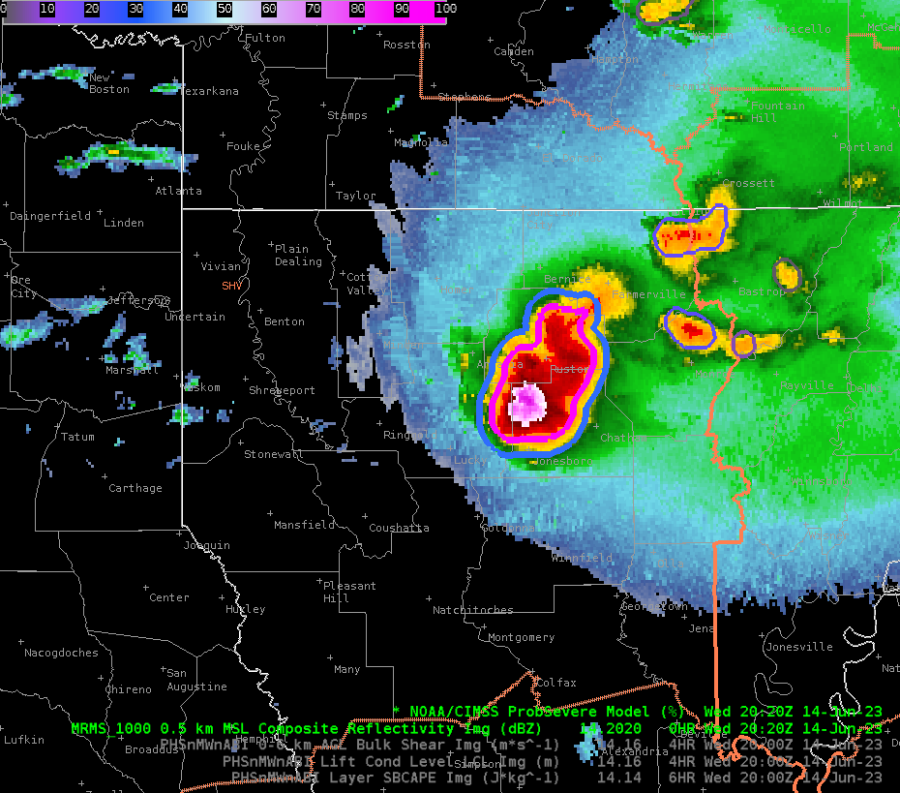
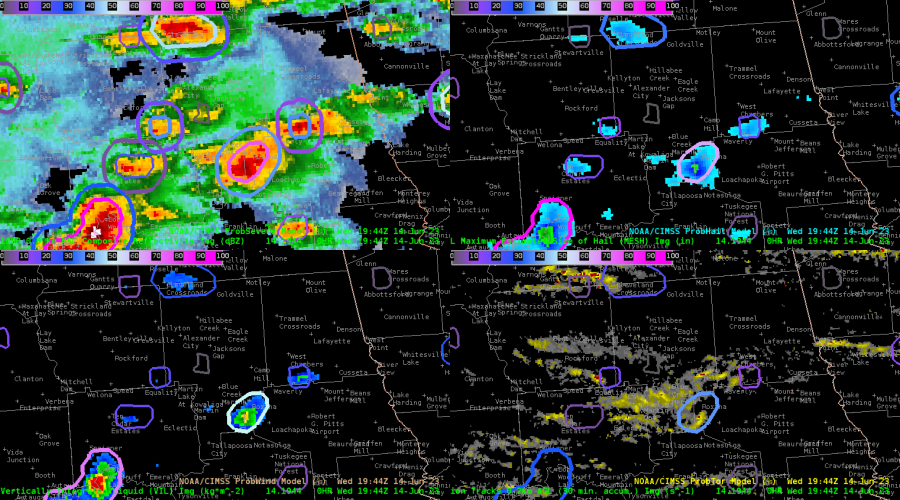
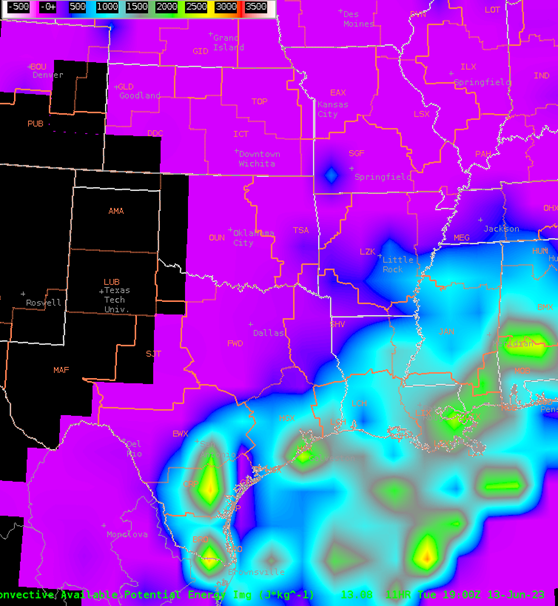
A very intense supercell formed across western portions of OUN CWA. This cell underwent many transformations including splitting and merging at other times. Octane was very interesting to watch as this cell went through the various processes before eventually producing a tornado. Octane was able to show the storm splitting before it occurred on radar. PHS was also showing corridors of stronger 0-3 and 0-1 SRH; SPC Mesoanalysis was showing this as well but I did like how the PHS was able to highlight exactly where these occurred. Seeing that and a near stationary boundary did increase my confidence that if a storm was able to latch on it would become tornadic. Probsevere/MESH did struggle to catch on to how large the hail actually was initially before finally picking up on the hail size.
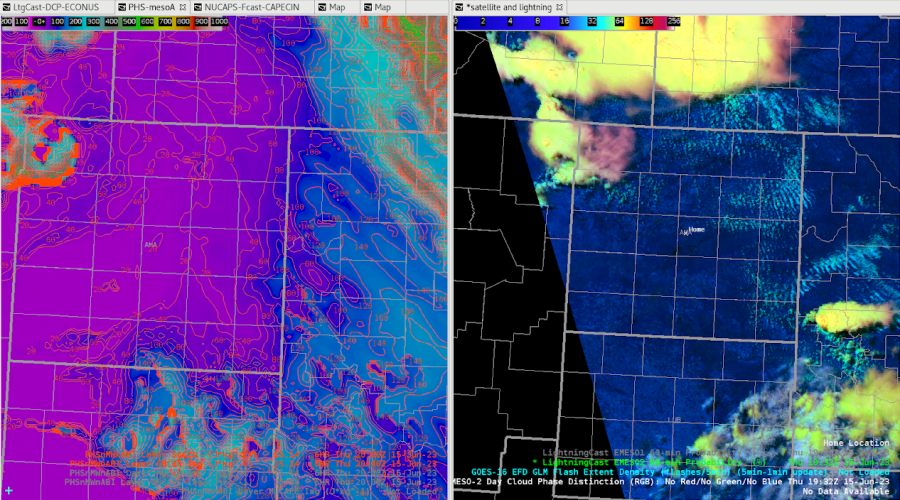
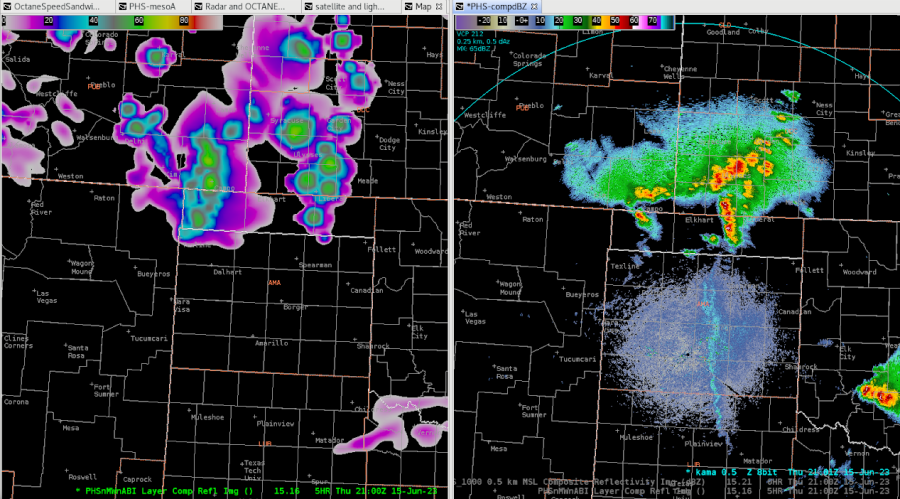
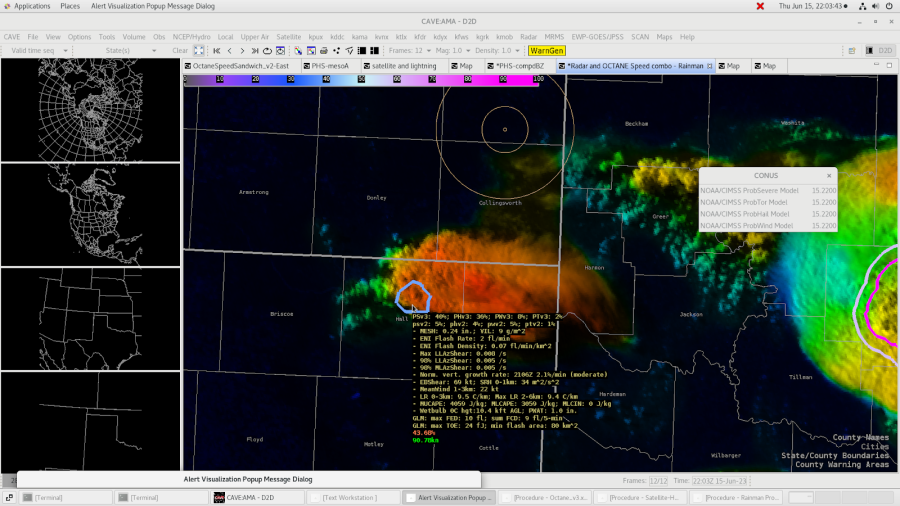
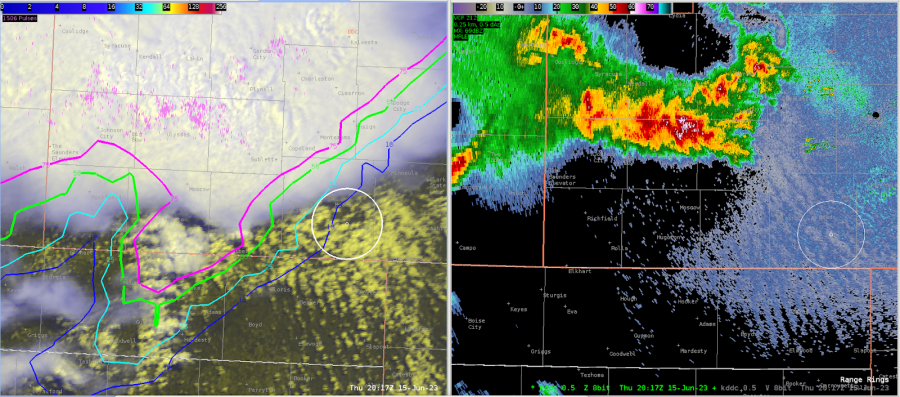
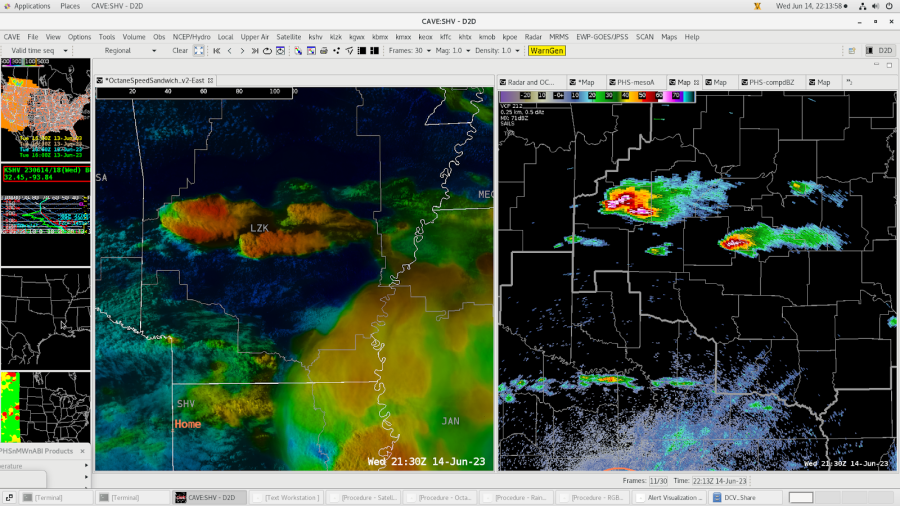
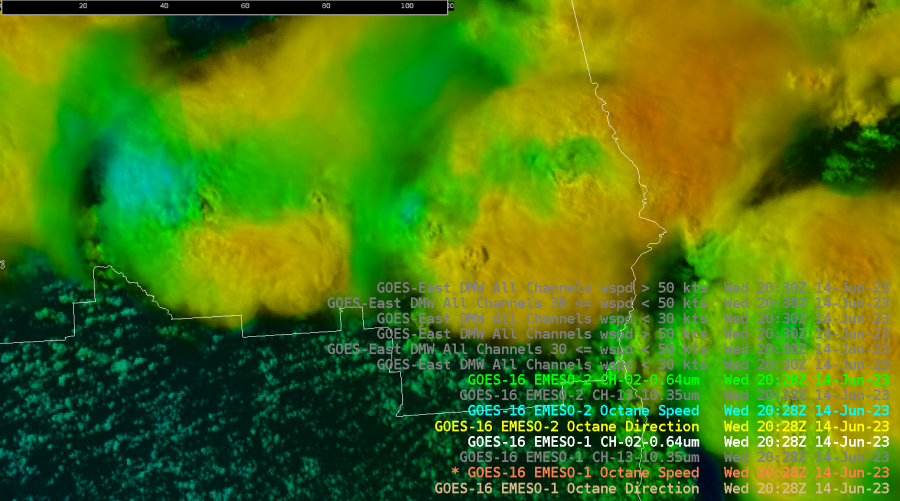
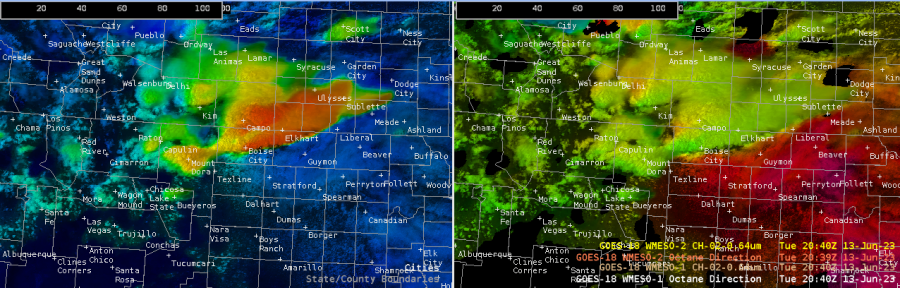
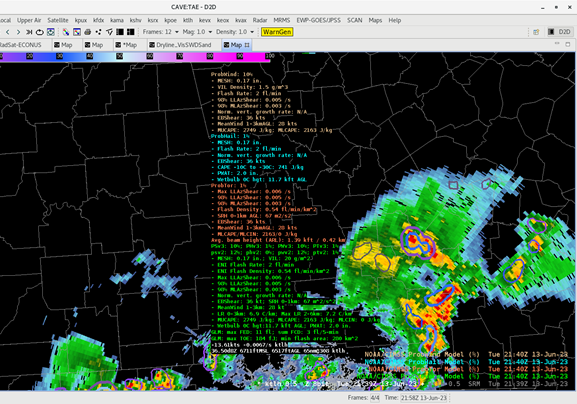
4 Panel with Octane on the top row; appears to be two distinct divergence signatures occurring
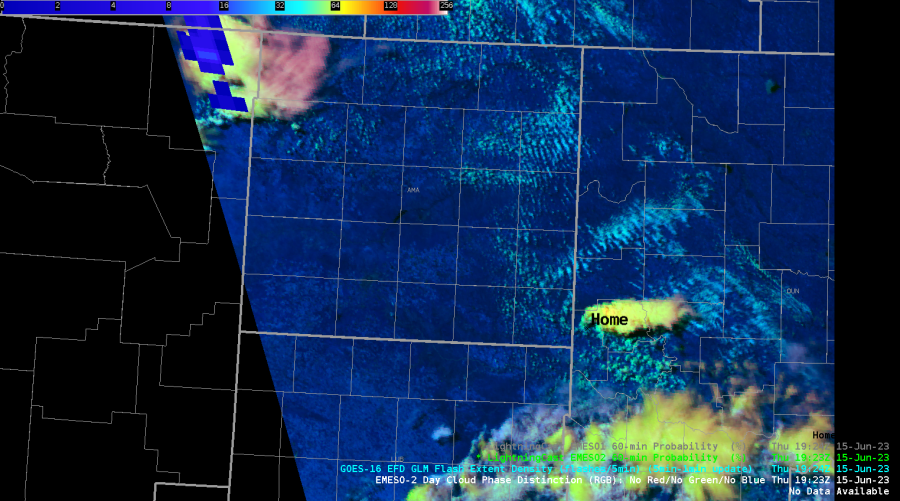
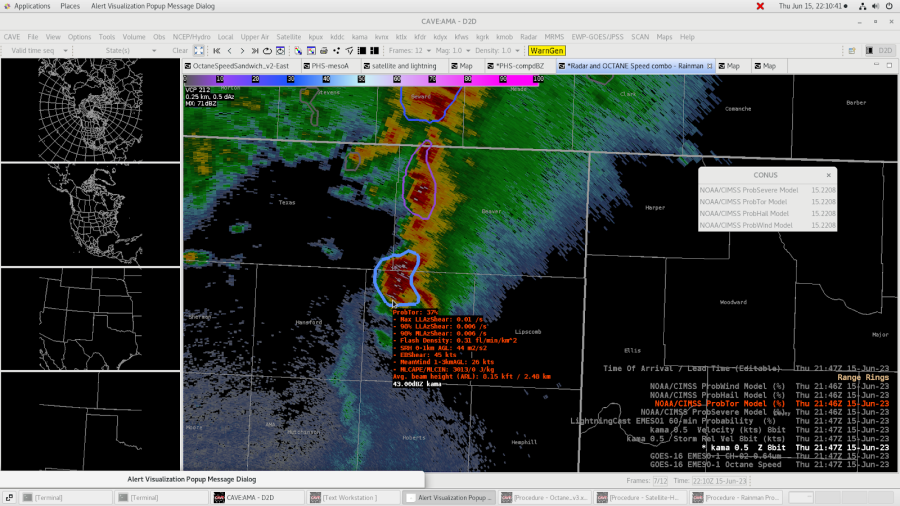
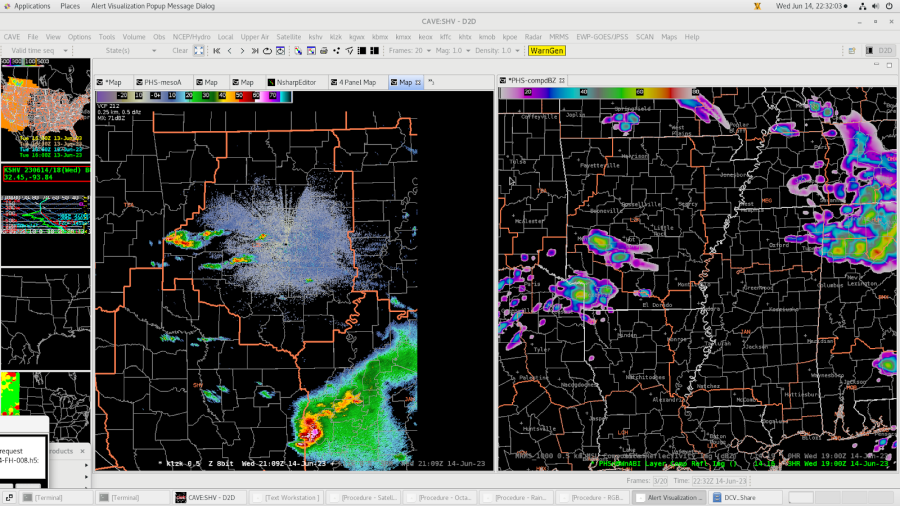
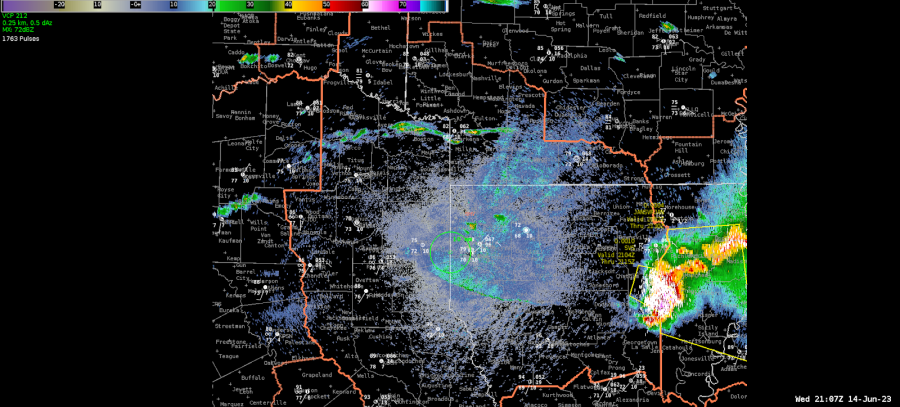
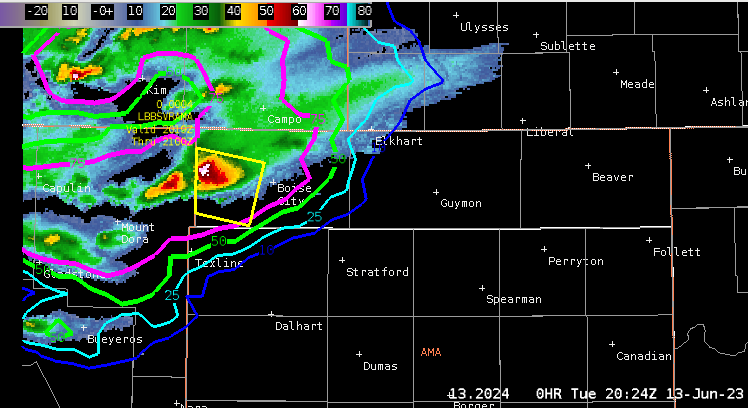
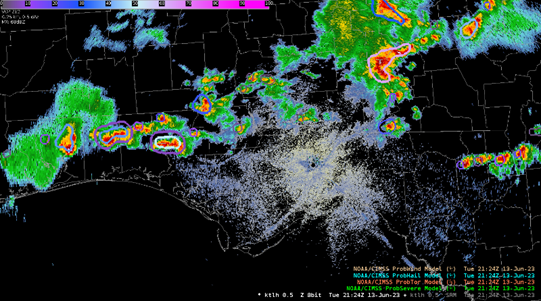
Radar Loop of storm splitting shortly after Octane signature…. Notice how the left mover dissipates.
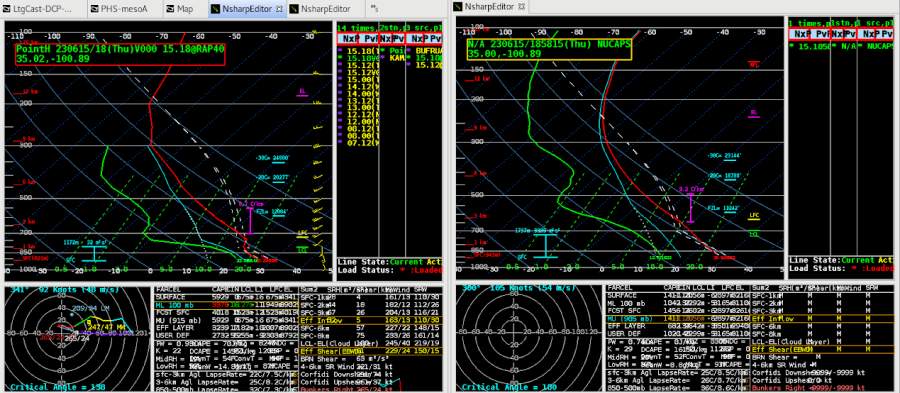
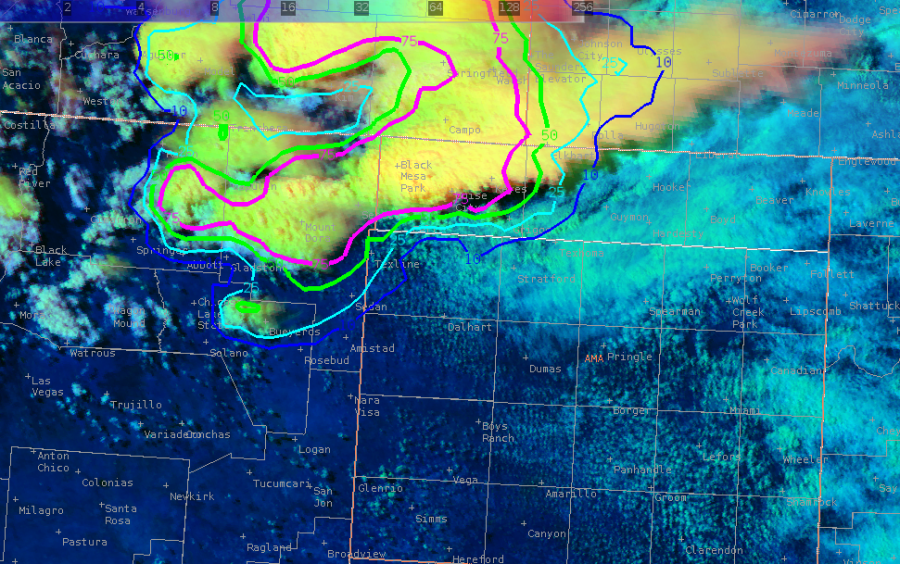
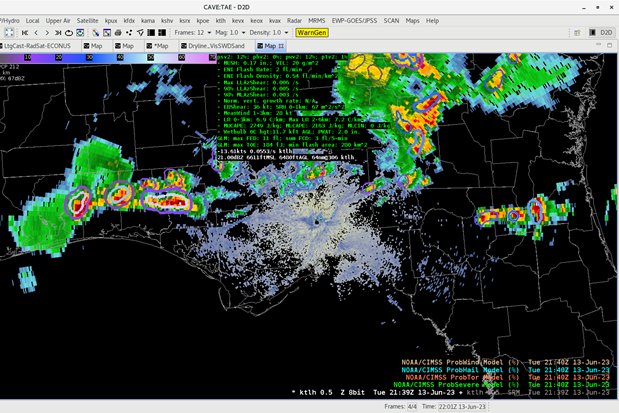
Using the 4 panel with Octane, IR and Day Cloud Phase it was also beneficial to see the upper divergence signature on Octane correlate with the cooling cloud tops of IR and Day Cloud Phase. Although it didn’t seem to create any additional lead time with that aspect; at least that I was able to notice. It was overall a very interesting storm to watch for this experiment.

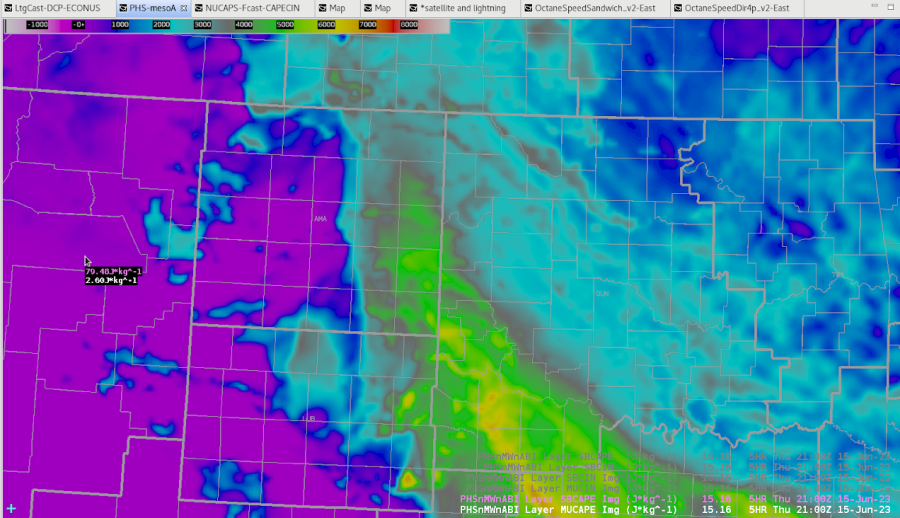
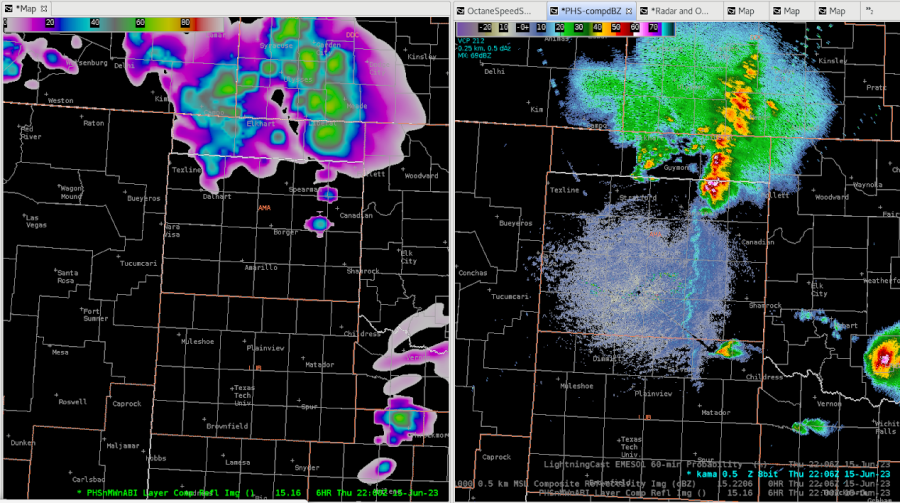
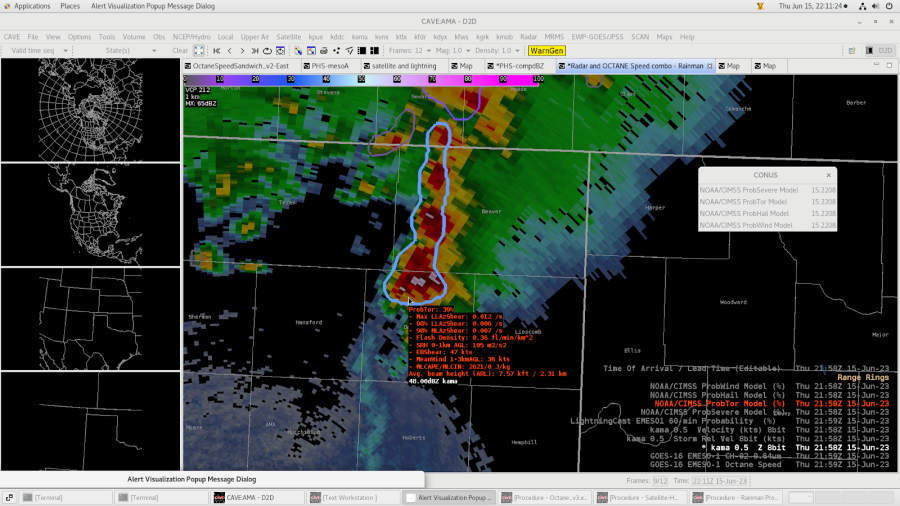
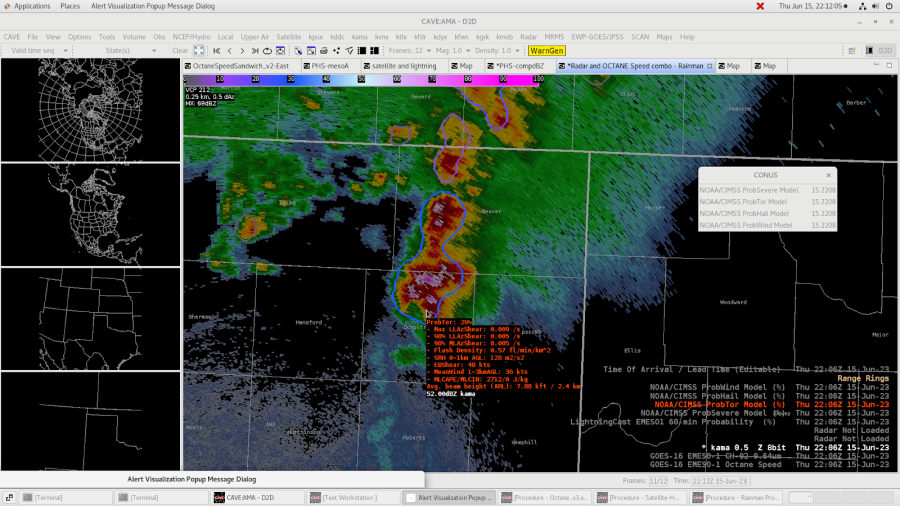
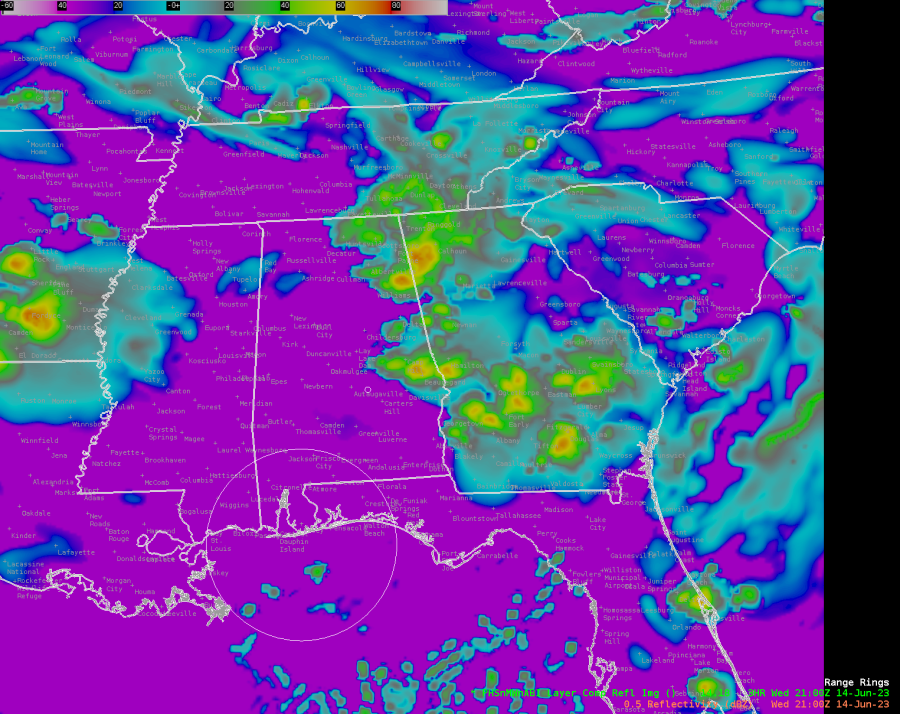
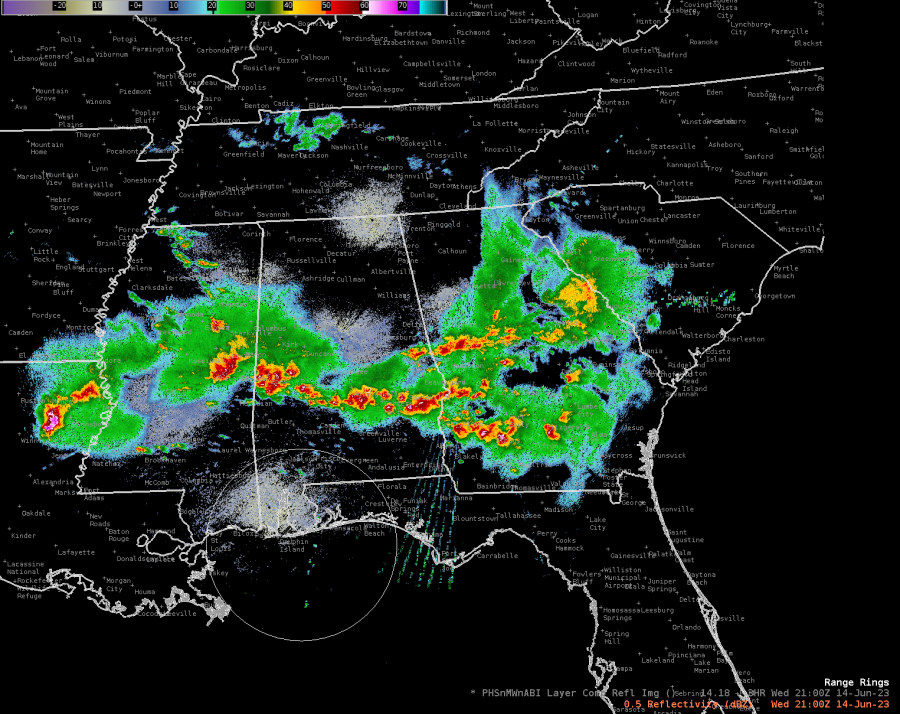
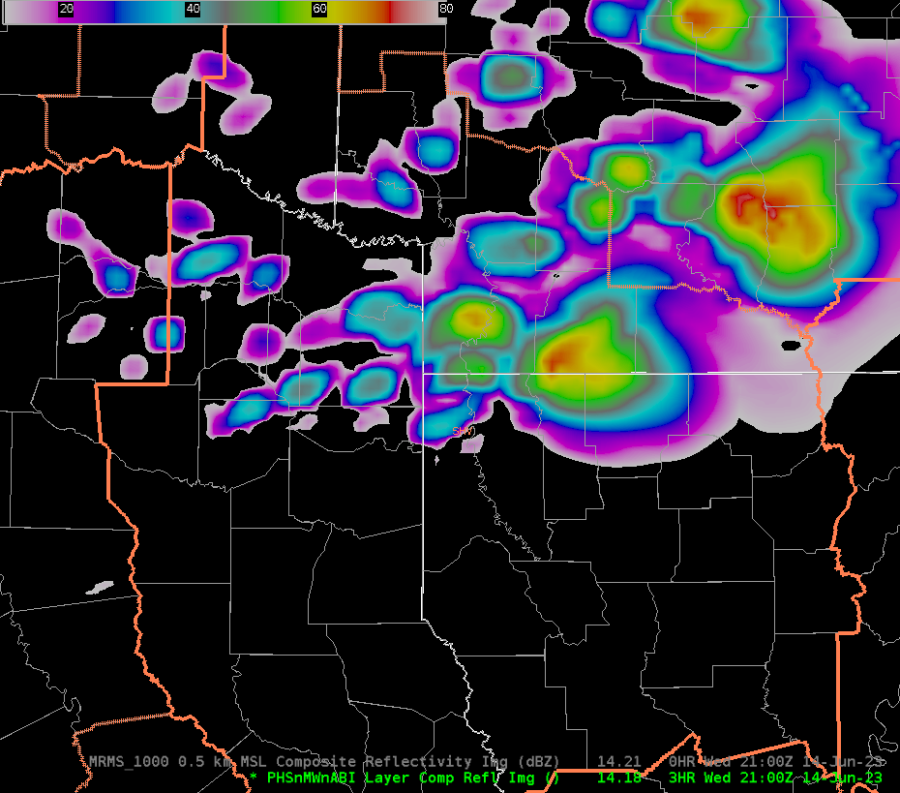
4 Panel Intensification of storm. Note the rapid color gradient to blue (upper level divergence)on Octane towards the end of the loop.
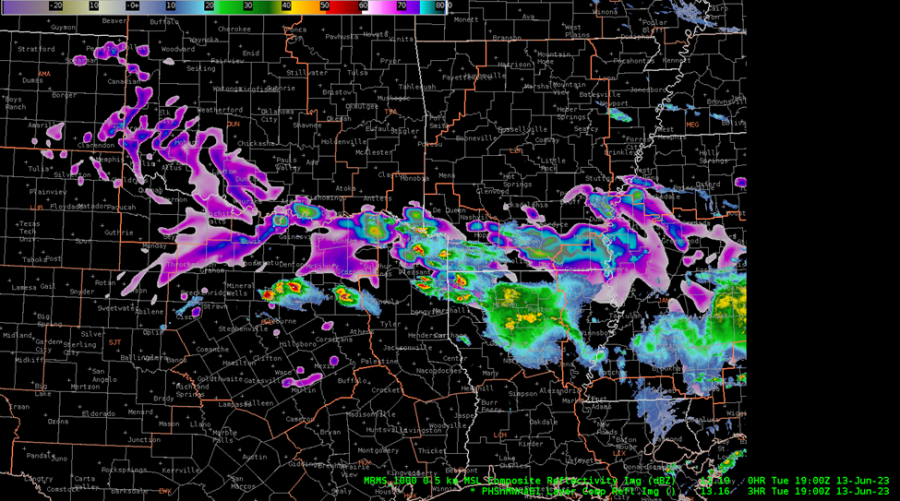
Radar loop around the same time as the 4 panel above
– Tor Nader