

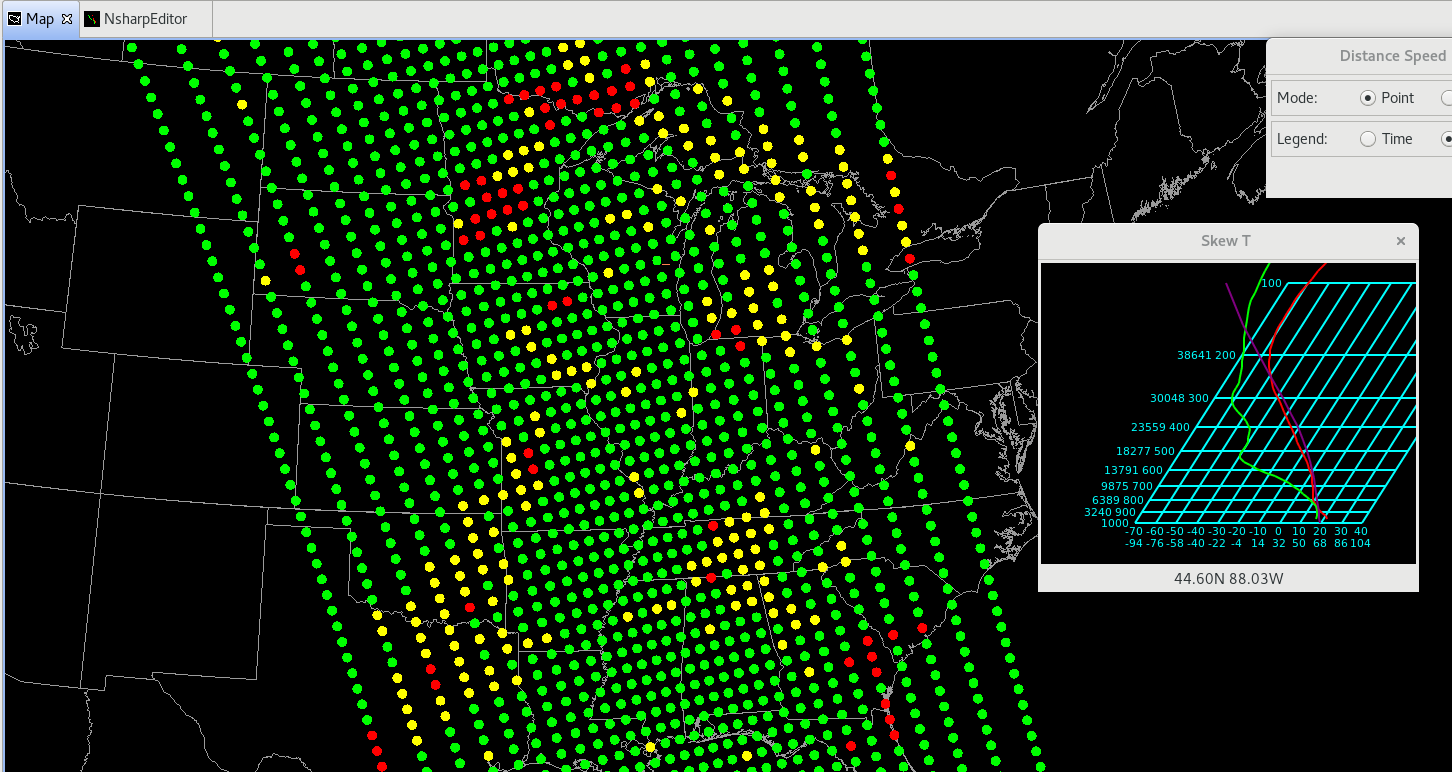
The pop-up skew-T is useful for a quick cursory look at sounding profiles, but I noticed that when clicking on the data points, when the NsharpEditor opened up it never updated for the new data at subsequent points. For a new skew-T in the NsharpEditor, one has to close the original NsharpEditor before clicking on a new one.
Category: NUCAPS
Springfield Storms
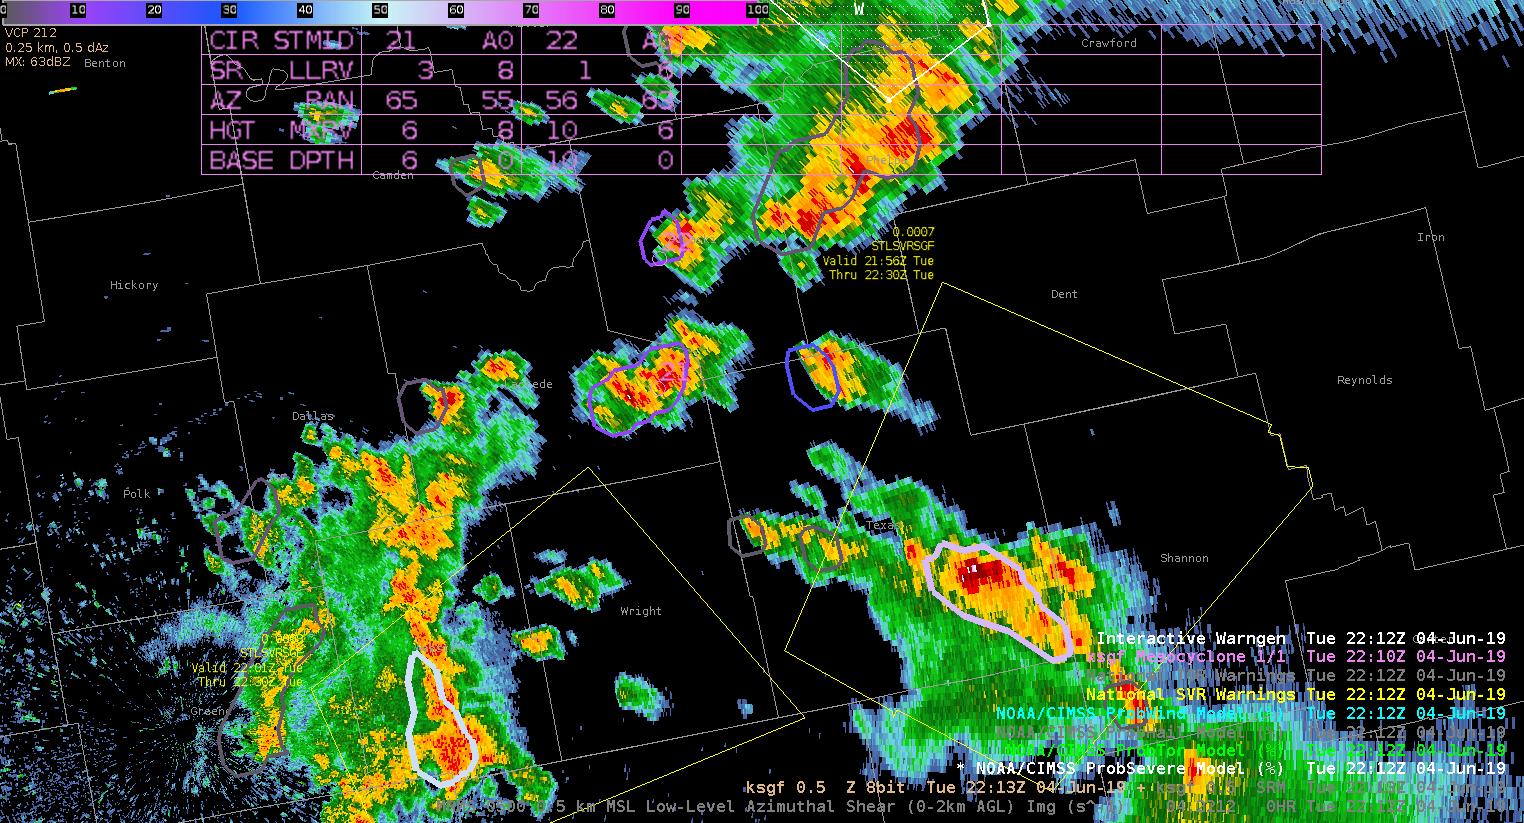
We’re currently analyzing storms developing in the Springfield Missouri WFO. Right now I’m using various tools to monitor if these storms will become severe.
Right now I’m using a combination of radar, GLM, nucaps, and the All sky products. Currently the most helpful tools on top of what I normally use are allsky and the lightning products.
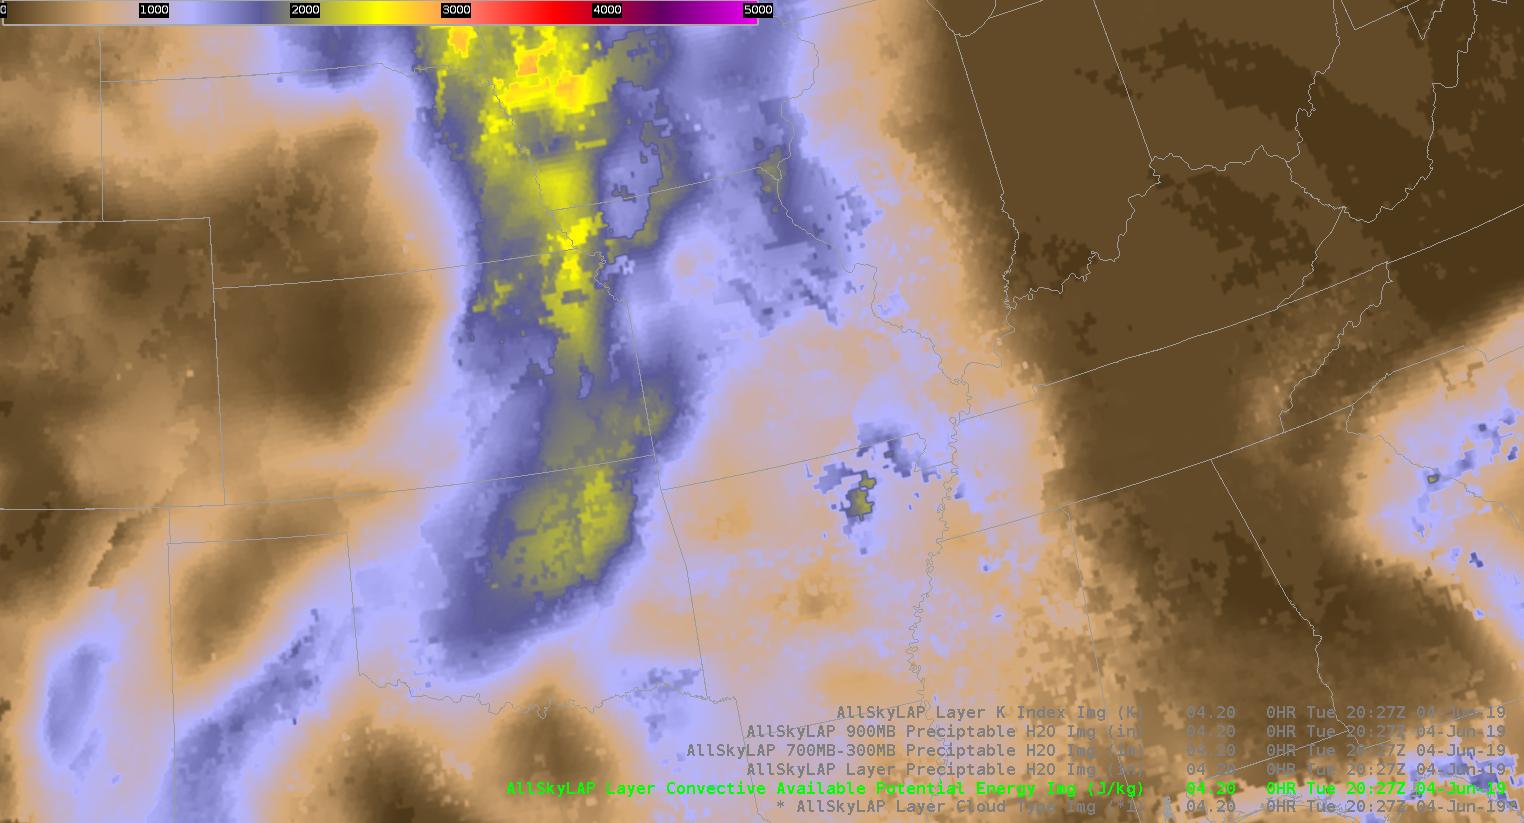
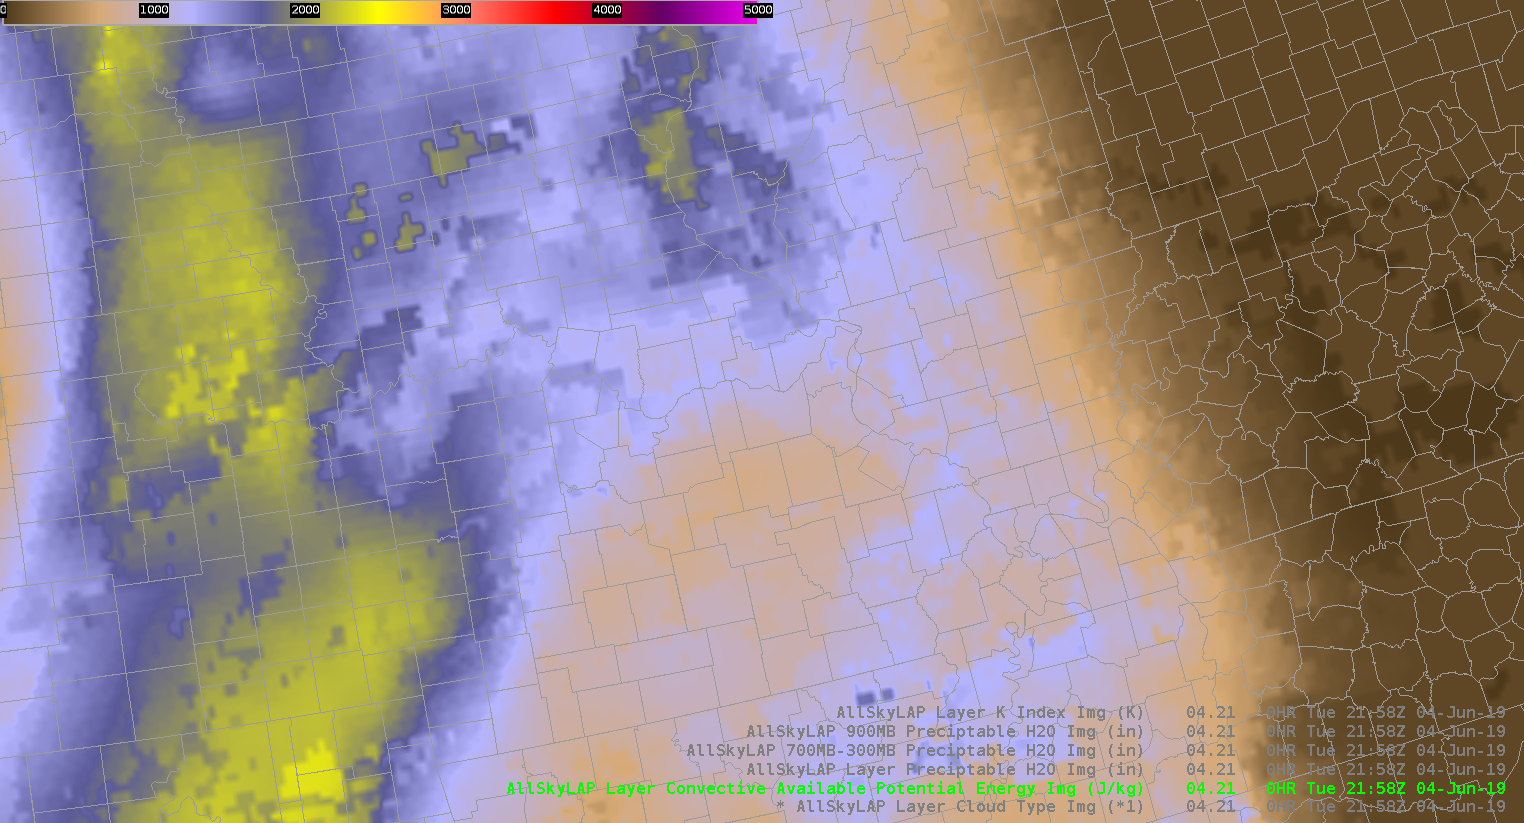
The allsky cape helped to find CAPE gradients and an increase in CAPE. The northern batch of storms were pushing into an area of increasing CAPE and in return they did intensify.
While deciding whether or not to issue a warning I also looked at AFA GLM data to see if there were new flashes developing which can be indicative of growing convection. That flashes aligned with radar and increased my confidence that storms would intensify.
That lead to me issuing a severe thunderstorm warning. The prob severe data also ramped up. So I felt confident about my warning.
I also used NUCAPS sounding predictor to look at the cape during the rest of the afternoon.
While watching storms in the Springfield area I tried using NMDA. Even after magnifying the product it was still a bit hard to see. I’m note sure if there’s a way to make the circle bigger or more pronounced. It can get busy on an active day.
As I continue to track storms I’m using Allsky CAPE to see what type of environment they are moving into. The CAPE does increase farther east so that makes me anticipate convection wane over the next few hours. I will though pay close attention to the storm farther north since they will move along the cape gradient.
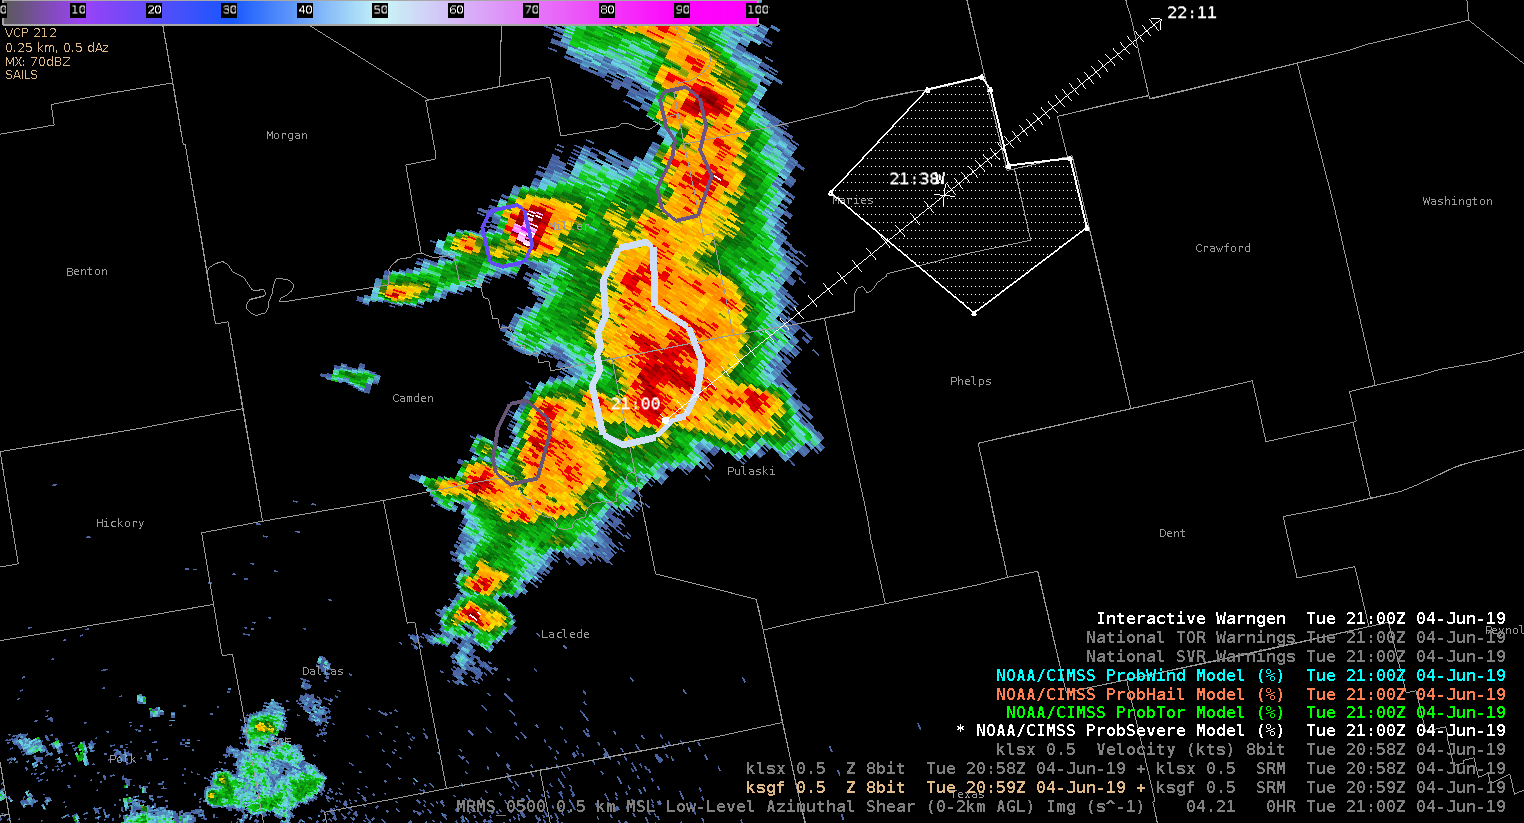
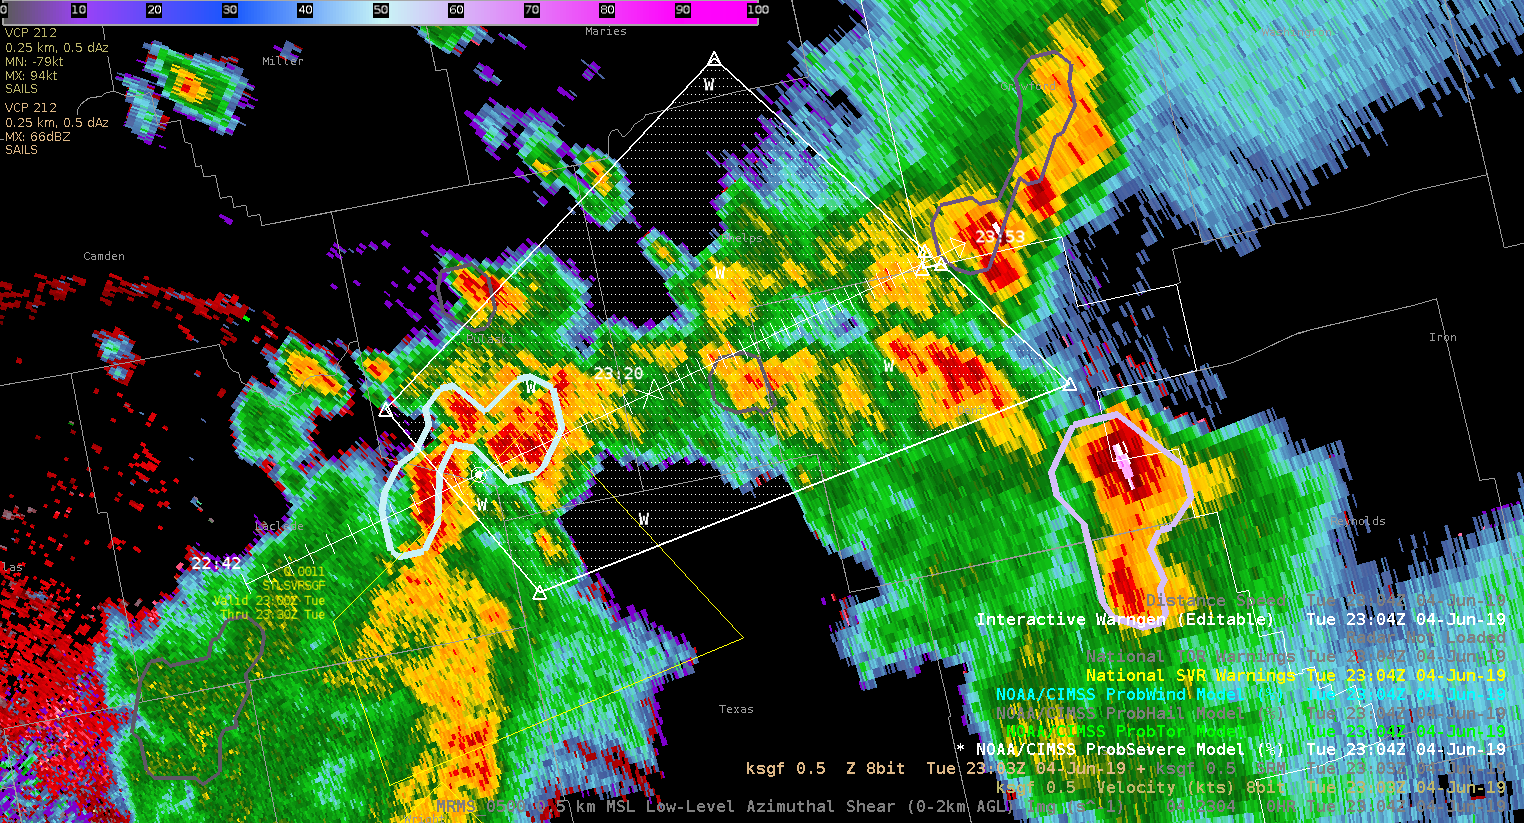
I also used probsevere to increase my confidence in warning for a cell in pulaski county. The velocity ramped up as well as vil values. 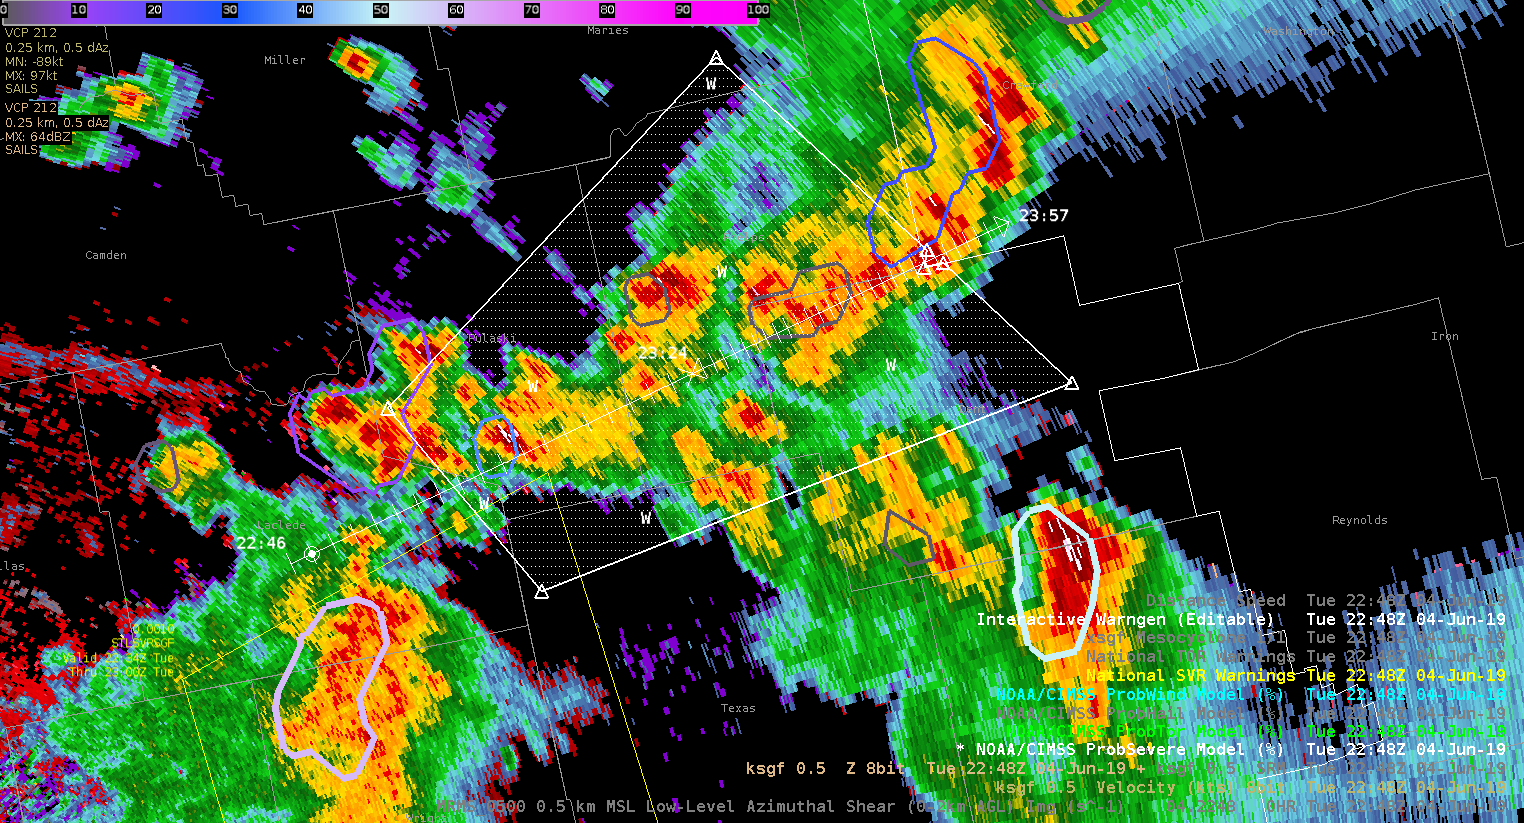
The increase in probsevere over a few scans prompted me to issue a severe thunderstorm warning.
Taylor Johnson
NUCAPS Procedures Usefulness
The NUCAPS Quick Guide from JPSS includes a few procedures. Here I show the utility of a few of those procedures for combining GOES Satellite data and NUCAPS data.
This procedure plots 400-200mb relative humidity and GOES-16 water vapor. You can see the representation of the dry air across the northern US and the systems in the Plains & southeast. 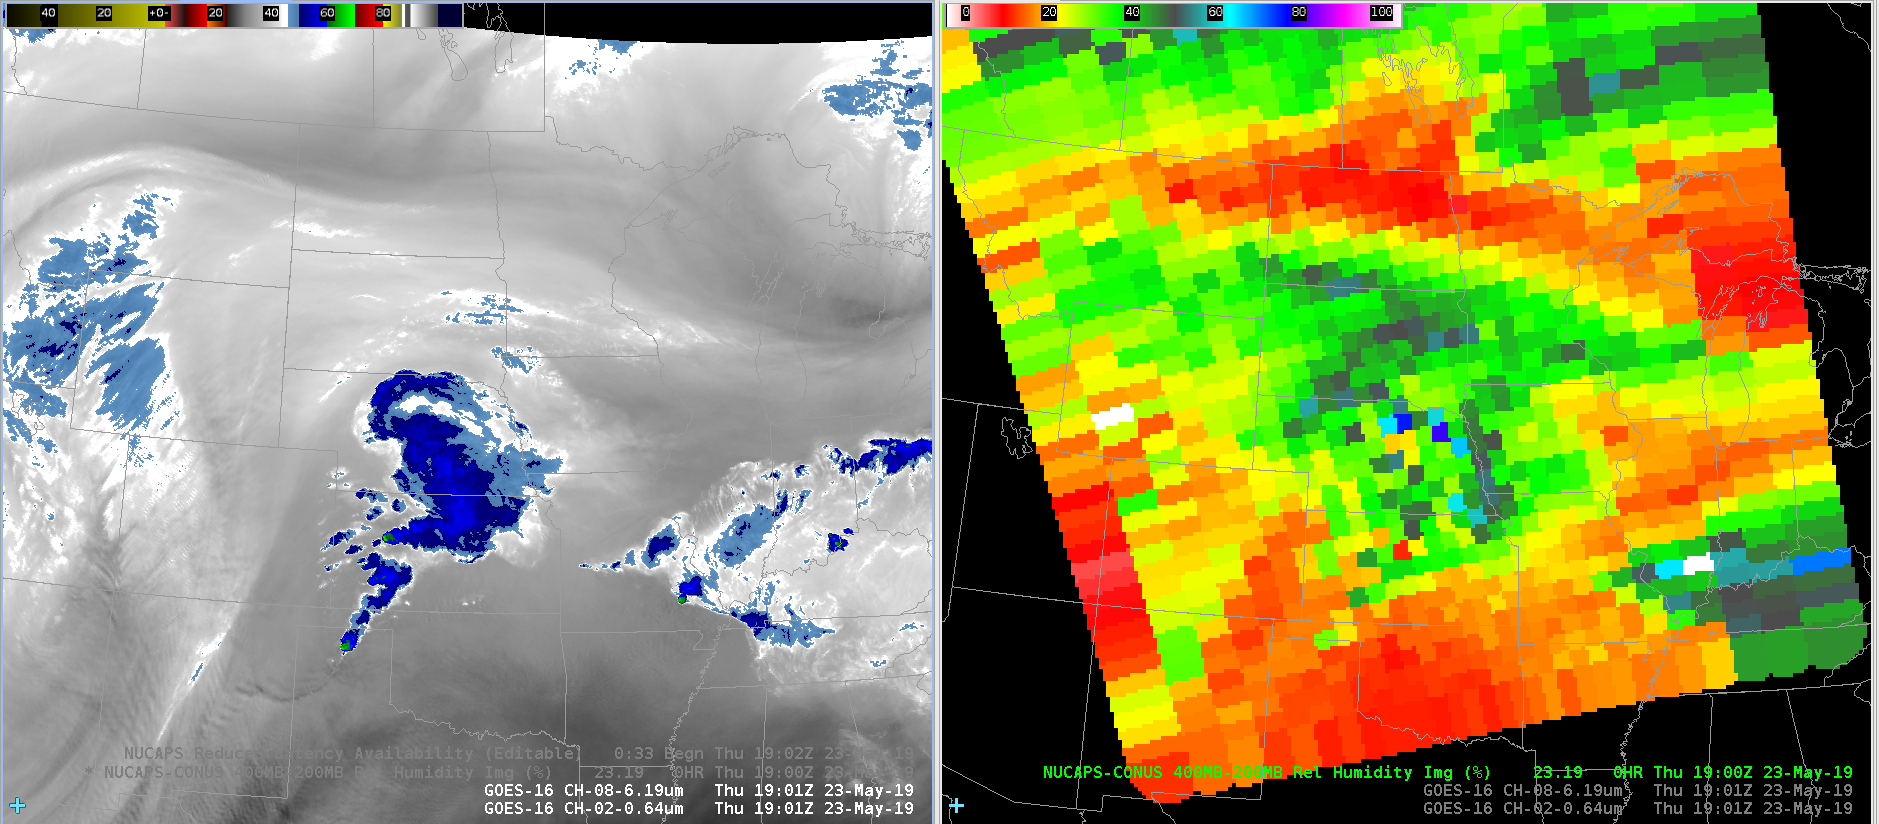
Another procedure compares GFS, HRRR, and NAM lapse rates with the NUCAPS lapse rate info. This is a good check to see if model lapse rates are performing well or where they need to be taken with a grain of salt.

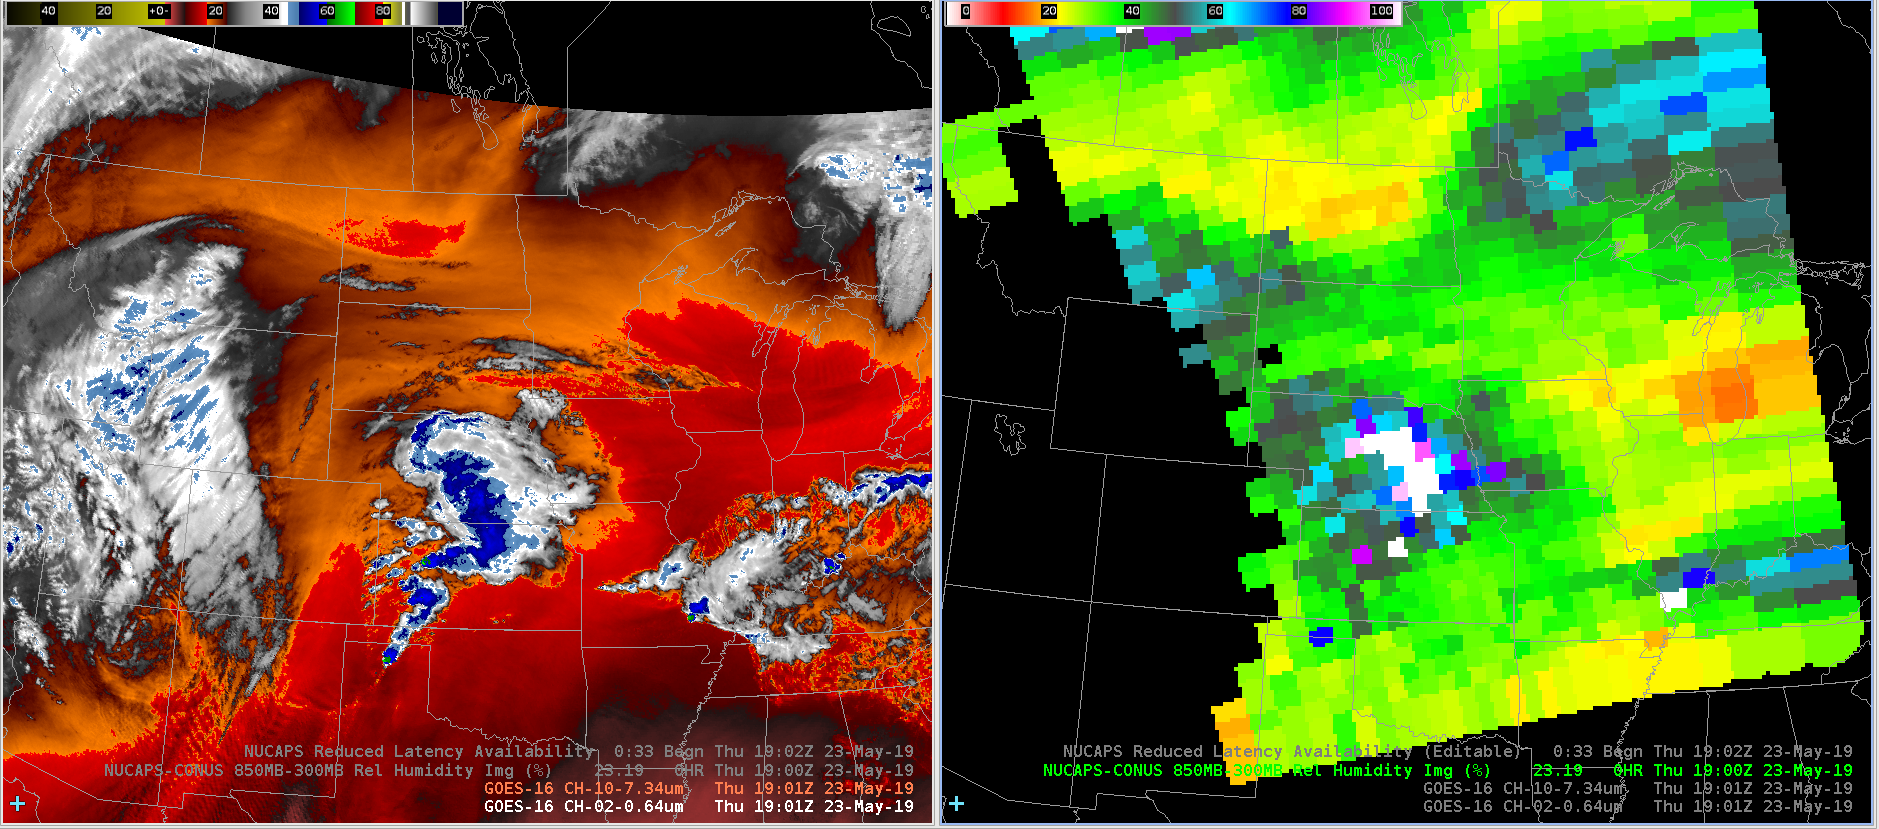
Another procedure plots 850-300mb RH and low-level water vapor. The product shows the system in the Plains and the system in the Ohio Valley. Drying is also obvious in the southern Great Lake and North Dakota.
I like the procedures provided in the JPSS Quick Guide. I am starting to understand the applicability of the NUCAPS data little bit more. These procedures are helpful in contextualizing the provided data fields.
-Atlanta Braves
Comparisons of NUCAPS and Model Data Lapse Rates…
So, it can be refreshing to see when NUCAPS data agree with model data, but I’m often more interested in those cases where there are differences, and potentially important differences. Notice in the images below the comparisons between NUCAPS 850-500 mb lapse rates and various model data.
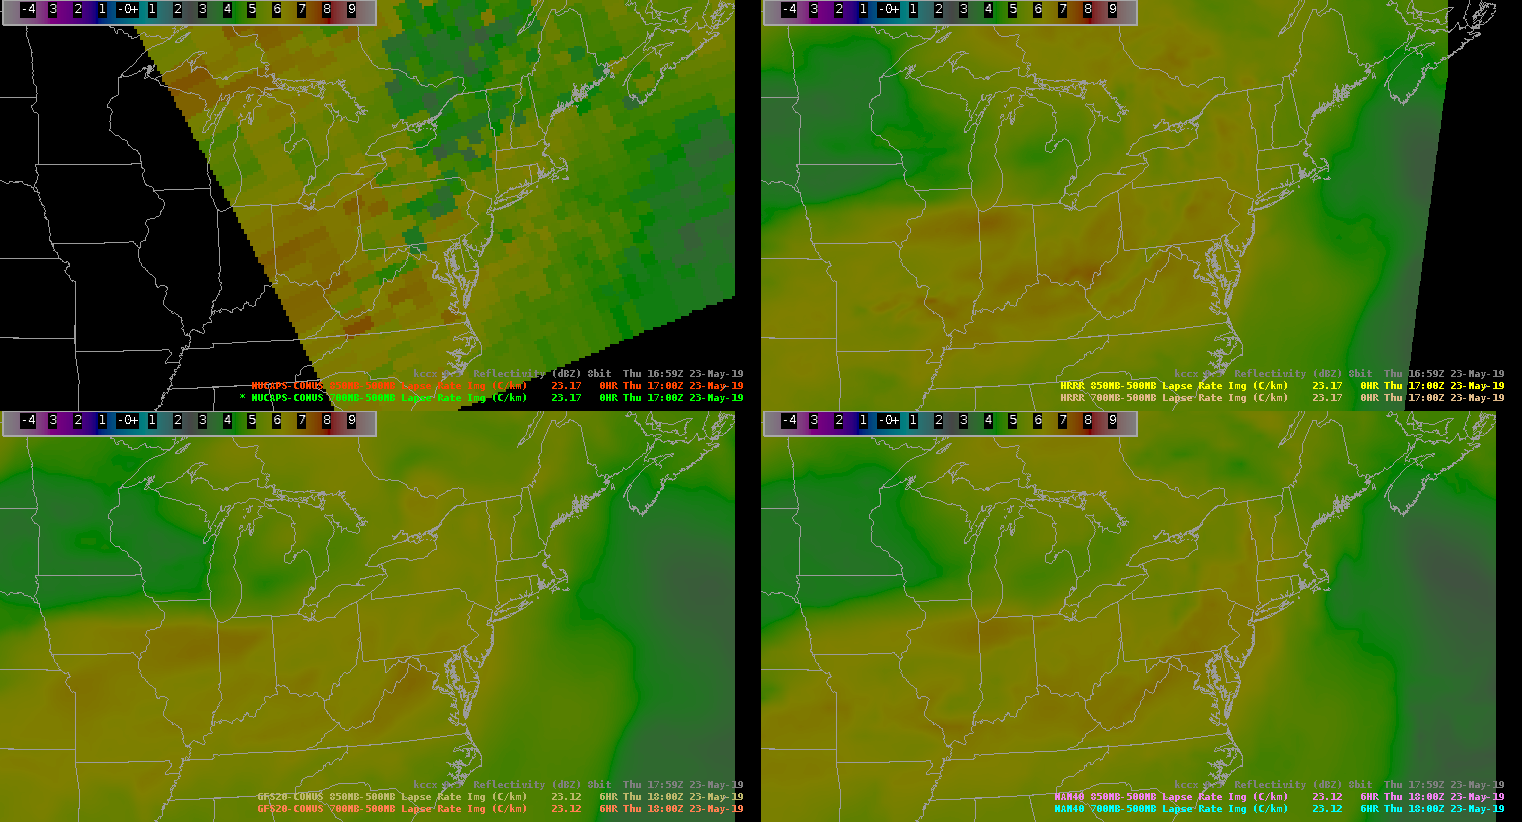
Notice the relatively large differences that stretch SW to NE from central W VA into New England. Taking a look at nearby radar imagery, it’s clear why this area had significantly lower lapse rate values in the NUCAPS data than the models; a line of showers and thunderstorms were present along this path of lower values that was displayed in the NUCAPS gridded data (Image 2).

Of course, the NUCAPS retrievals certainly would have been affected by this area of denser clouds and precipitation. Nevertheless, lapse rates would be affected (lowered) by the convection in those locations, which is depicted in the NUCAPS data only. So, the lack of this feature in the models would then affect their forecast in this region going forward. It will be interesting to see the NUCAP-Forecast data in this type of scenario. In fact, one of the forecasters here is taking a look. Anyway, let’s imagine a scenario where this convection had dissipated and left behind a boundary or gradient in temperature/moisture. The detection of these types of boundaries, that often occur in pulse type convective events especially, can be important for predicting where convection will take place subsequently.
Oh…one more thing, it was interesting to notice the quick air mass recovery and advection of steep lapse rates and instability behind the area of convection in the OH Valley. So, given ample forcing, further convective development is possible even behind this line. In fact, the NUCAPS indicates lapse rates ~7 C/km across a broad area on the edge of the swath in the OH Valley.
-Kris W
Using Modified NUCAPS to help examine air mass downstream
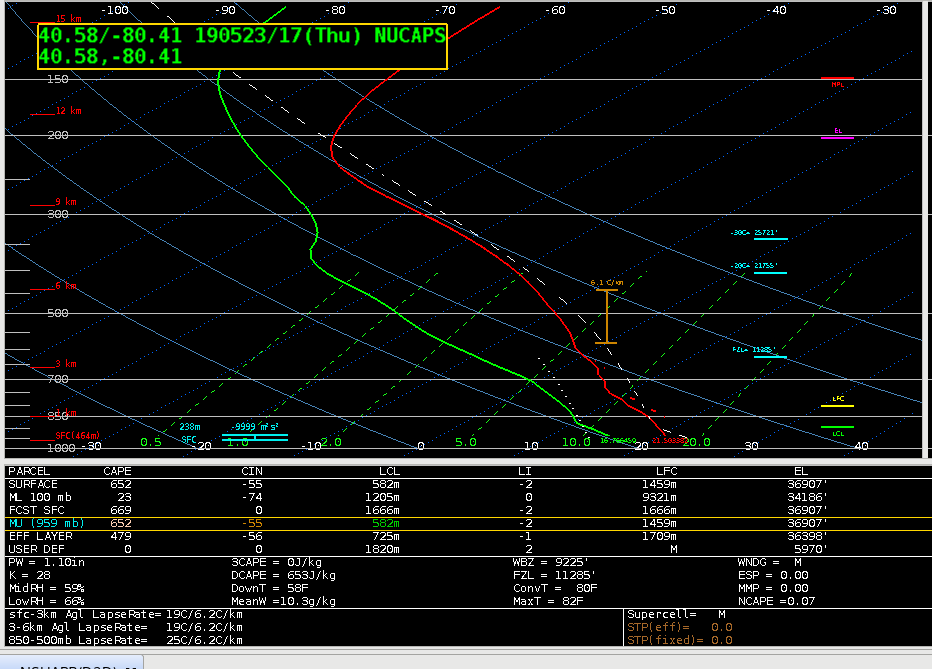
The air mass in the CTP CWA has been modified somewhat based on earlier convection. Here’s a NUCAPS sounding from central PA (note that it was yellow, meaning it IR retrieval failed due to clouds, but the microwave was successful).
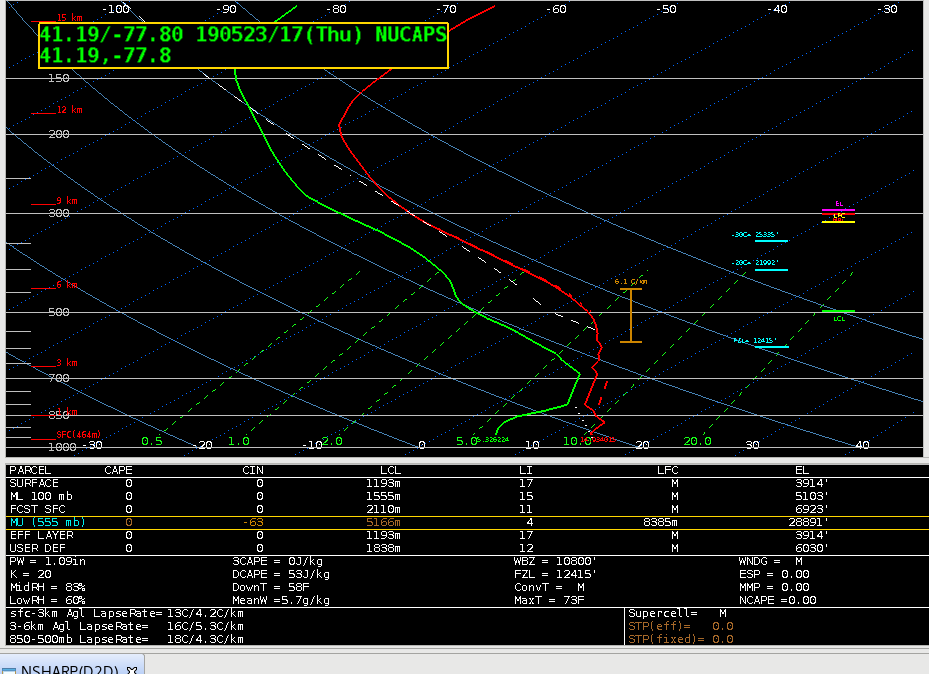
Notice the low level CAP, as well as the modest mid level lapse rates of 6.1 C/km. To get an idea of the air mass characteristics, I looked at a couple of NUCAPS soundings further to the west. The first was west of Pittsburgh along the PA/OH border.
The mid level lapse rates were the same as further east, but the warmer temps and higher dew points were supporting non-zero SBCAPE values. There was still some CIN, however, and the MLCAPE was a paltry 23 J/kg.
Moving further west, I examined a NUCAPS soudning in central Ohio, potentially indicative of the air mass that would move into the CWA later in the day due to the mean westerly flow at mid and upper levels.
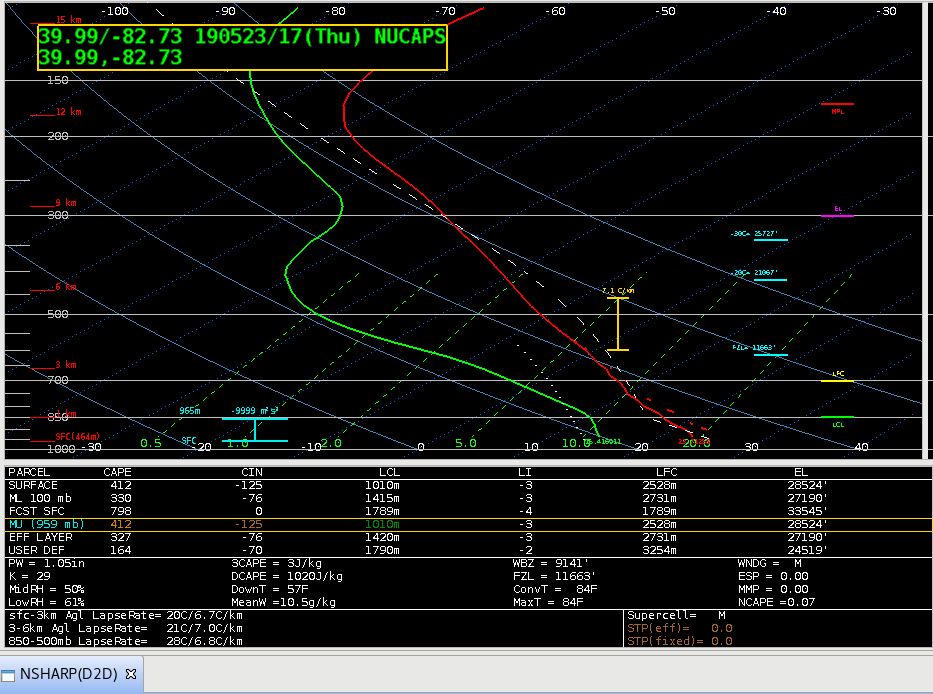 There was a noticeable difference in the mid level lapse rates, with a more significant value of 7.1 C/km. Also notice the DCAPE was in excess of 1000 J/kg, compared to values of 500-600 J/kg further east. This would indicate that there will be at least a threat of severe winds with convection that develops later in the day in the CTP CWA despite the early in the day convection that modified the air mass during.
Thorcaster
Day Three and a first NUCAPS pass over the East CONUS…
Just taking a quick look at the first NUCAPS swath over the CONUS. I did want to point out the dropout in the swath, that unfortunately occurred along part of the SPC risk axis that stretched SW-NE from Illinois into the lower Great Lakes. Although, the swath did obtain some soundings in the Marginal Risk area that encompasses much of Ohio. Clicking on the soundings in and around the Marginal Risk area indicated a regional location of higher instability. Although soundings in the SW part of this risk area showed markedly higher instability values.
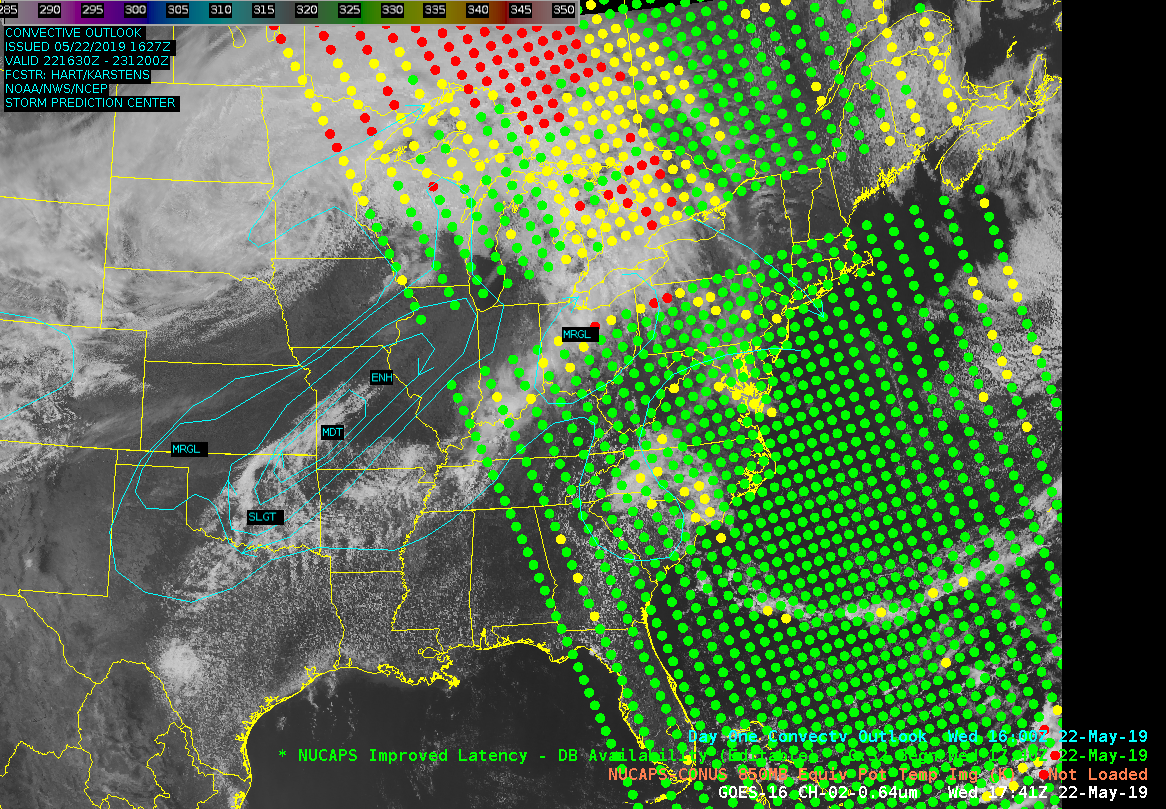
Notice the are significant differences across this area with overall larger lapse rates and instability in the SW corner of the Marginal Risk Area. So, it will be interesting to see what unfolds in this area. As the NUCAPS data indicate, are some areas within the singular Marginal Risk Area more favored for stronger activity, and thus further partitioning is needed?
So, I just wanted to point out some quick features and soundings with the initial NUCAPS swath, although we’re focused to the west today, over the southern Plains again. We’ll be watching intently for the next NUCAPS swath.
NUCAPS Data from Yesterday’s (May 20th) Event…
So, at the map briefing this morning there was a LOT of discussion about yesterday’s event, and the fact that despite the tornadoes that did occur, this was a “bust” of sorts. That is, there wasn’t near the widespread development of supercells that was anticipated. There may be multiple reasons for this, but I thought I’d take an initial look at some data and soundings again from yesterday to see if anything stands out that I happened to miss.
Here’s a sounding (radiosonde) taken from Norman (KOUN) yesterday at 18 UTC 20 May 2019.
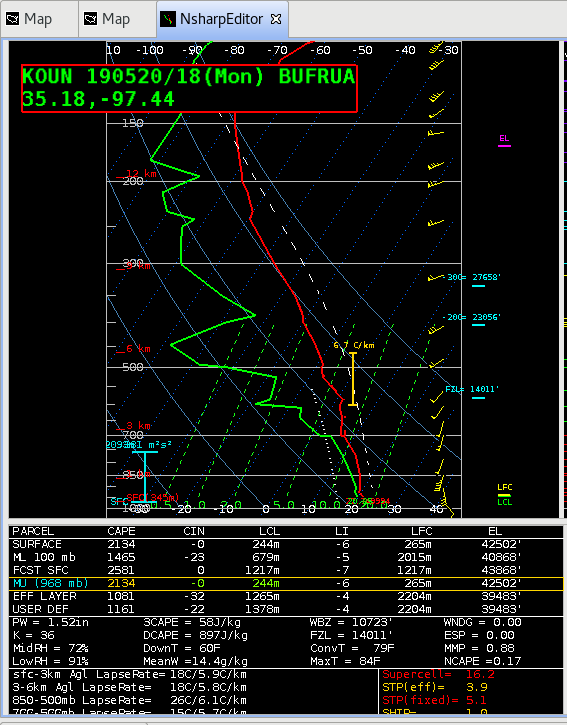
Notice that lapse rates were not particularly steep through the sounding, with 850-500 lapse rates around 6 C/km. Also, notice the deep moist layer from the surface up through ~700 mb, which I’m told that this is rather unusual for this area.
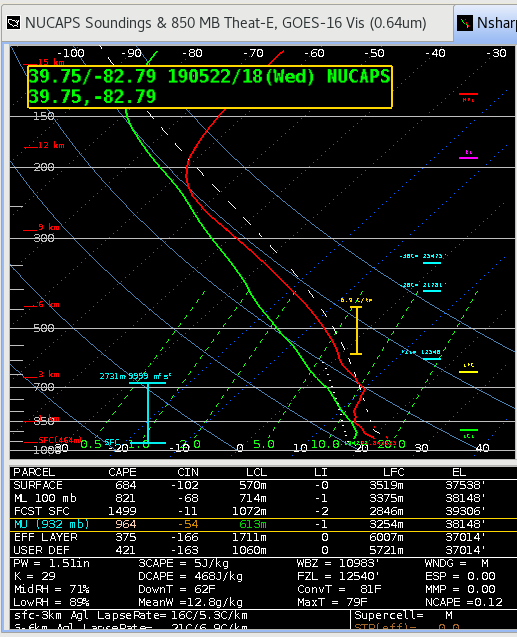
Ok, let’s take a look at a NUCAPS sounding in this proximity taken from the ~20 UTC swath.
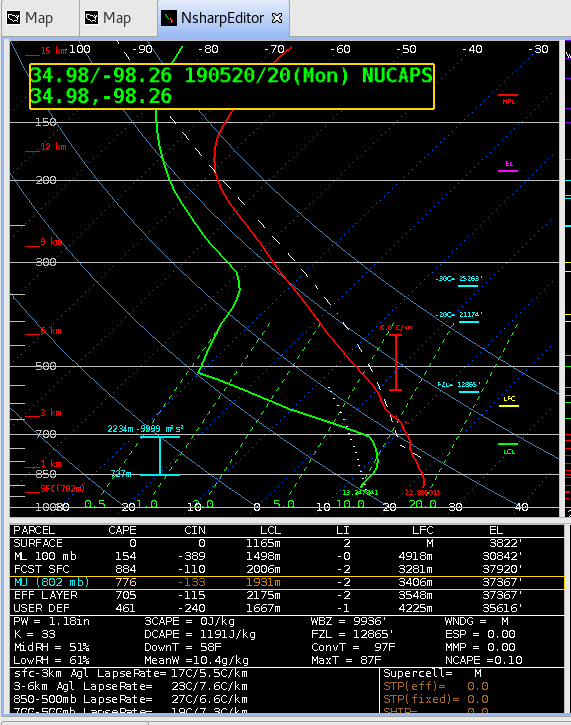
Immediately, I notice that the NUCAPS sounding doesn’t have the deep moist layer that the KOUN sounding showed just about 2 hours earlier. If anything, this layer did not disappear during the 2 hours, it remained, and perhaps even got a bit deeper. The 00 UTC KOUN sounding (not shown) indicated a moist depth up through about 680 mb or so. Ok fine…there’s the limitations with the accuracy of observations in the boundary layer in NUCAPS, but this is still important to capture since many severe weather parameters are derived from the surface or near-surface layers. However, it was noticed that lapse rates aloft were fairly similar, showing lapse rates that were not very steep, about 6.6 C/km in the 850-500 mb layer. The modified sounding (shown next) also didn’t capture the moist boundary layer.
I did want to point out again the good characterization of the mid-layers. Granted, while the NUCAPS soundings didn’t capture every squiggle in the dew point temperature aloft, it did capture the overall character of the moisture profile.
Well, I ended up having to give up my workstation, but perhaps this case should be investigated some more. Although not shown here, the lapse rates and theta-e from my memory did appear to show a relatively large W-E gradient across the area from north Texas into S-Central Ok.
Kris
NUCAPS Soundings Observations…Finally a Swath Over our Area of Severe Weather…
Hi all,
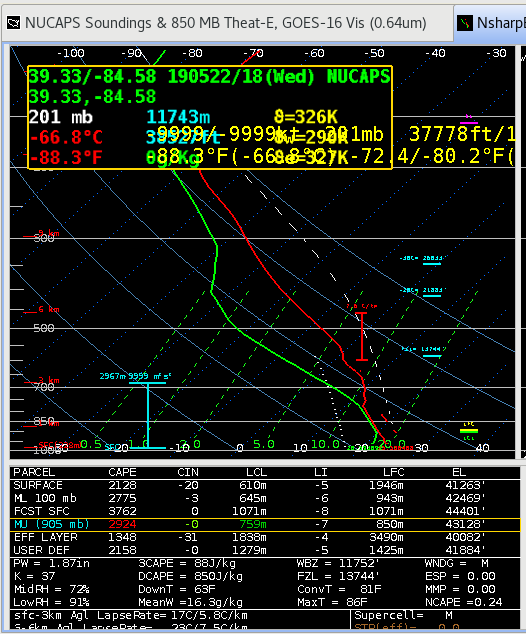
Ok, just a couple of quick observations and comparison of a NUCAPS (direct broadcast) sounding with a modified sounding over an area of interest this afternoon. The NUCAPS sounding locations and the particular sounding of interest can be seen in Image 1 below.
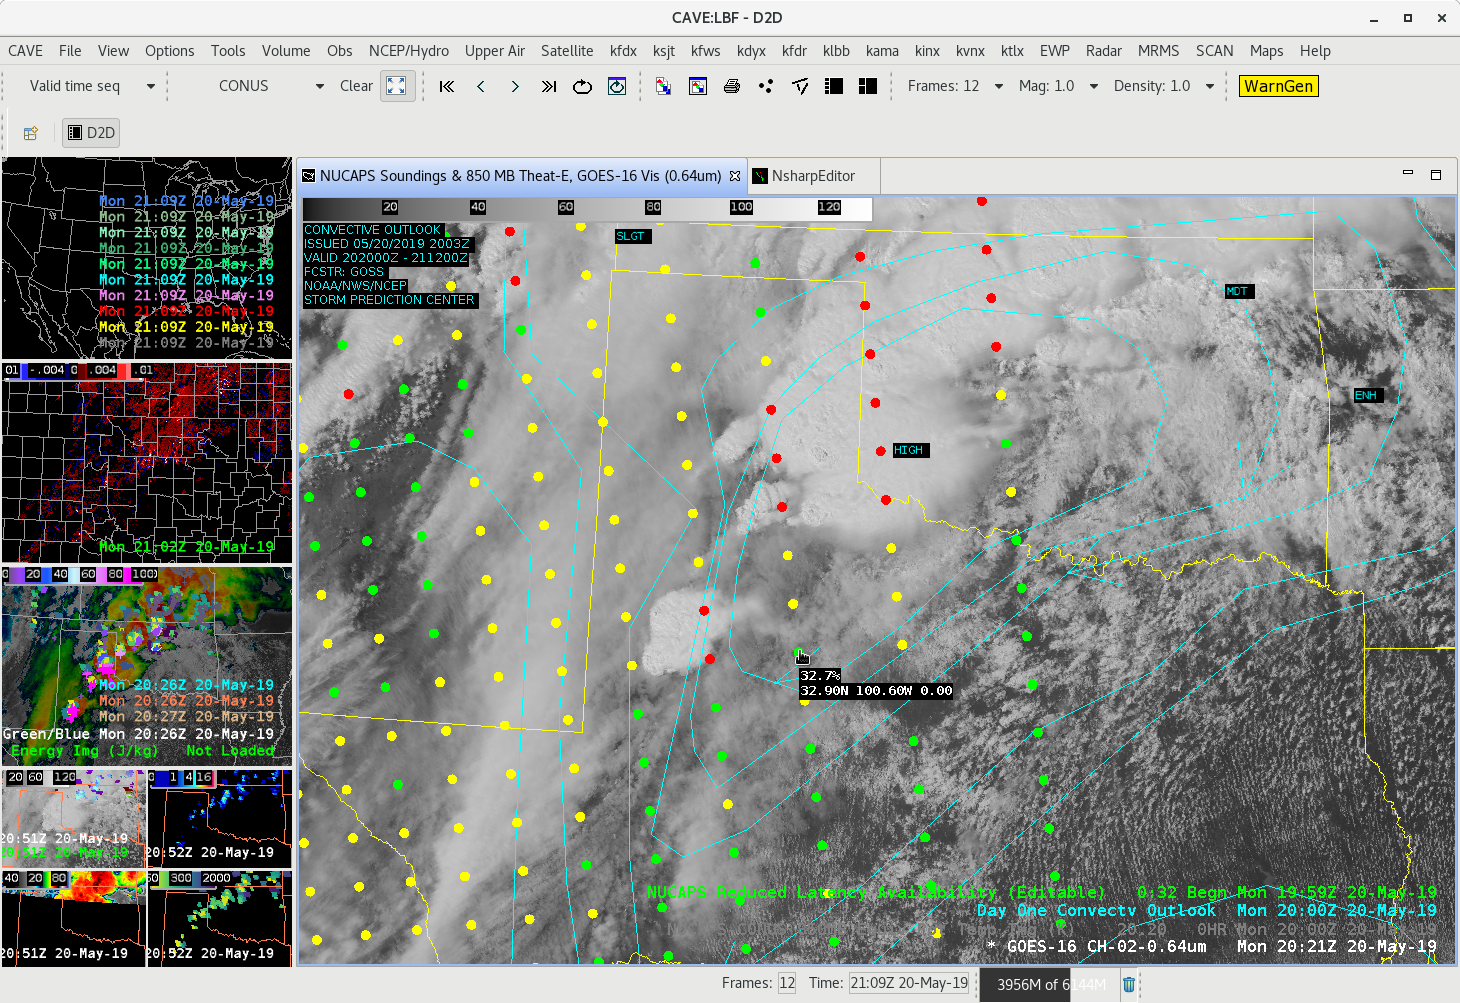
The next image below (image 2) shows the Direct Broadcast NUCAPS sounding valid ~2000 UTC 20 May 2019. The sounding indicates high CAPE values at this sounding location (~2800 J/Kg MUCAPE, and 2400 J/Kg MLCAPE), and steep lapse rates aloft, in excess of 8 C/km. This type of atmospheric profile would support severe weather in the area today.
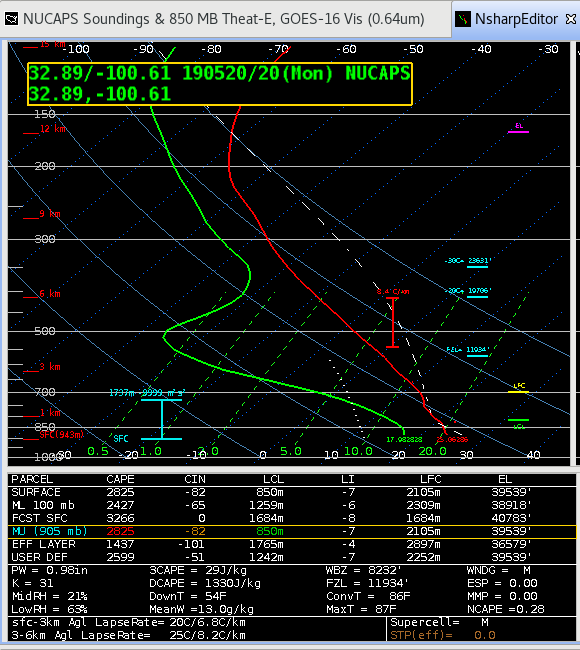
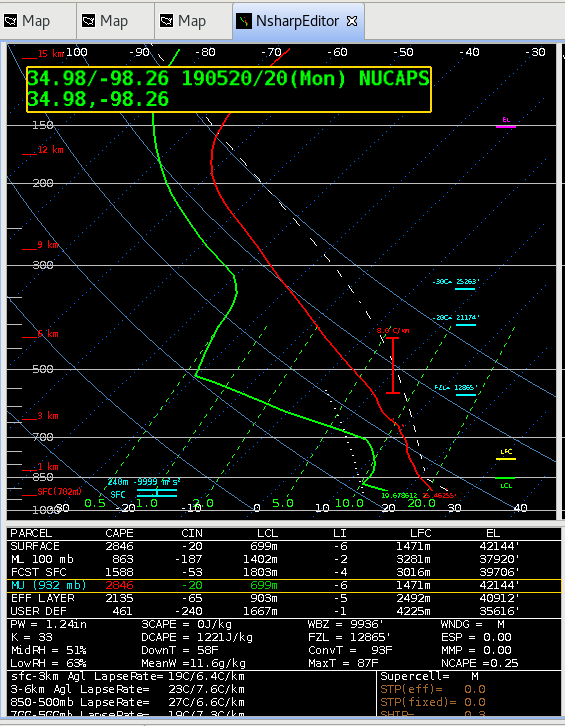
The next image is the modified sounding taken at the same location. Notice the increased CAPE values…

By the way, soundings in this general area, including the yellow soundings indicated high CAPEs with “reasonable” looking values. However, there was a fairly significant gradient noticed in overall low-level instability noticed in soundings to the east of this location. This could be a good case for the NUCAPS team to go back and take a further look.
-Kris W
NUCAPS swath…just a bit too far east…
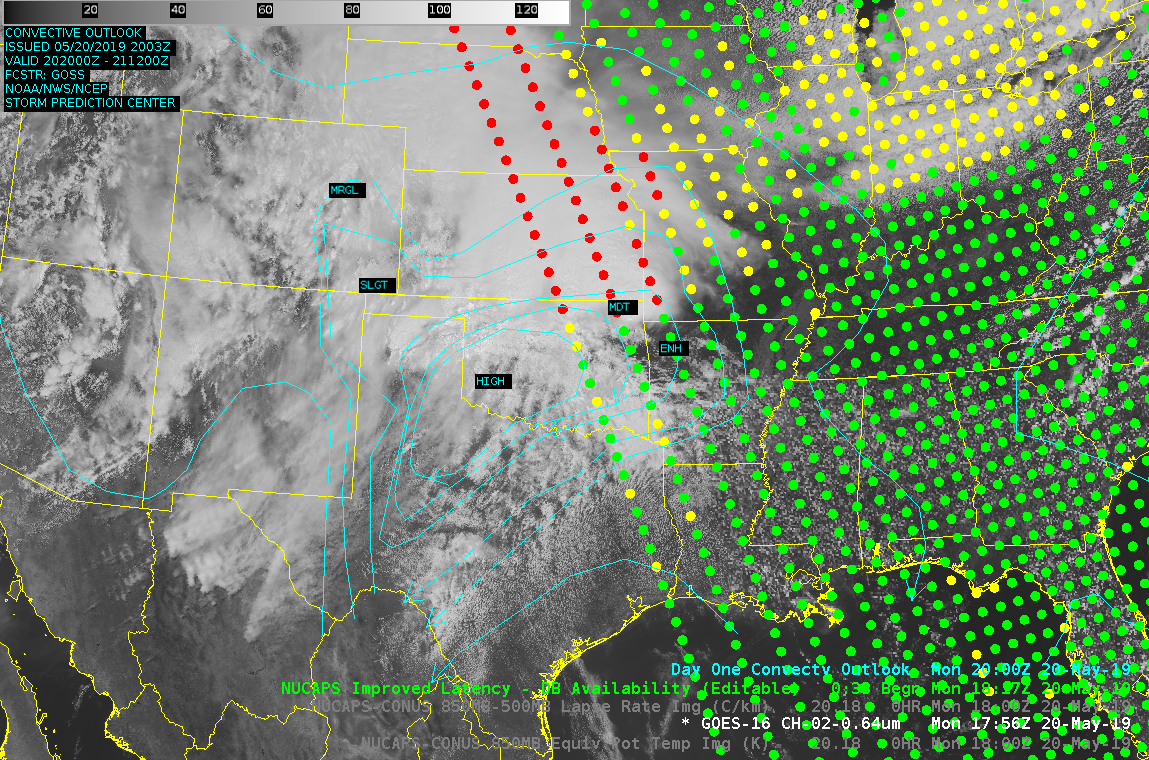
So, hello from my initial post from HWT, here during the week of May 20th. Yes, this is shaping up to be an active day and perhaps week. Taking a first look at the NUCAPS soundings for this afternoon…and…the latest ~18 UTC swath is just a bit too far east to be of a lot of use here in the primary action area for severe convection. Notice in the first image the SPC Outlooks (High Risk area nearly entirely to the west of the soundings). Nevertheless, I’ll take a look at the next swath to see the coverage over the main area of expected severe weather.
-Kris W
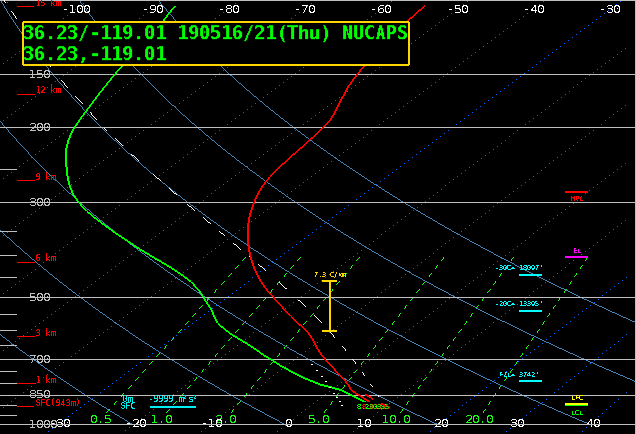
the California convection that could actually convect
A late season trof moving onto the west coast has everyone east of the Rockies excited for tomorrow and the weekend. It is associated with an unusually late season and significant rain event throughout CA with afternoon storms scattered about in the central valley, deserts, and Sierra Nevada. The GLM was able to detect lightning in several storms in CA and NV. NOAA-20 made an overpass around 21Z and provided several viable soundings in the San Joaquin Valley and near the CA coast.
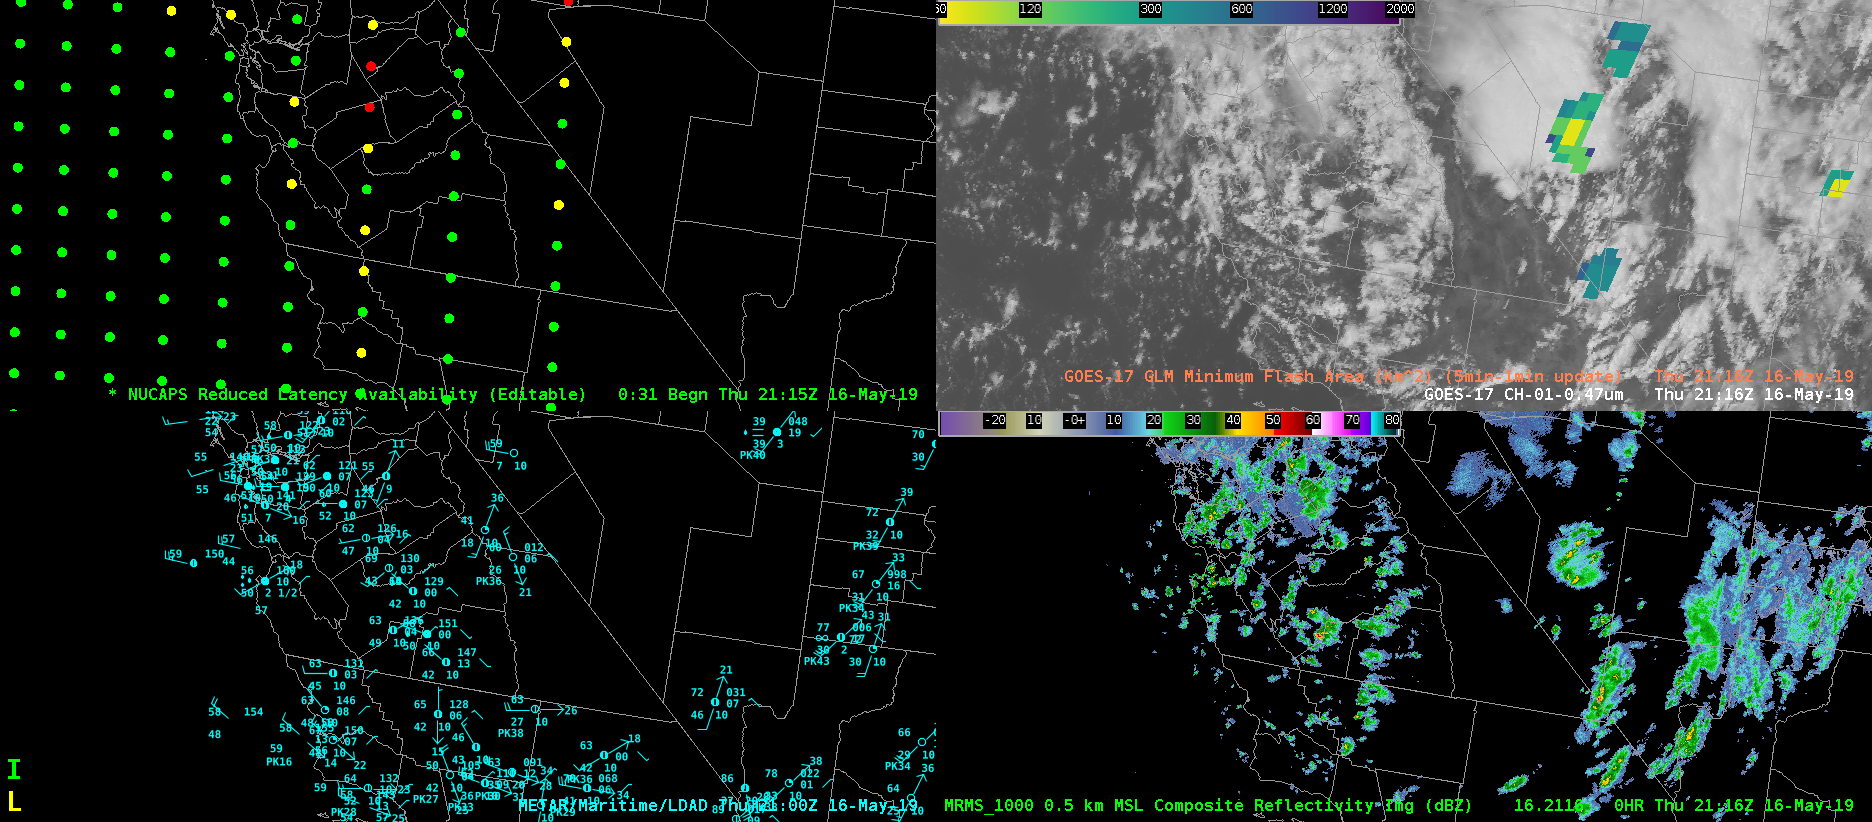
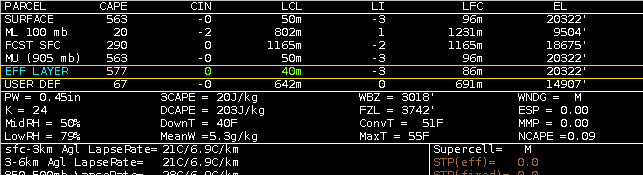
The NUCAPS sounding centered in Tulare County is shown below. MUCAPE values on the order of 563 J/kg were supportive of low-topped thunderstorms. Neighboring soundings indicated similar or slightly reduced values of instability. With the focus on severe convection east of the Rockies, it is nice to see NUCAPS perform so well in a completely different region and dynamical regime (namely post-frontal open cellular convection).
Brian Kahn