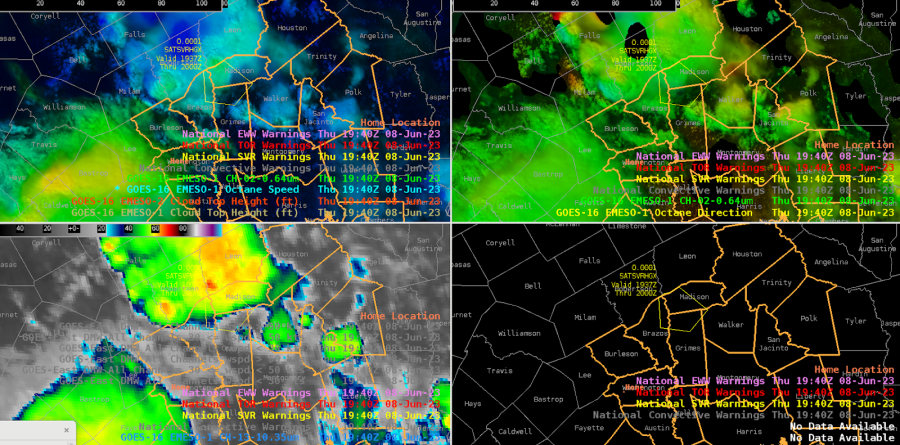
OCTANE
Have knots abbreviated as “KTS” instead of “KN”
Change direction of movement from to lettered degrees instead of a numerical value
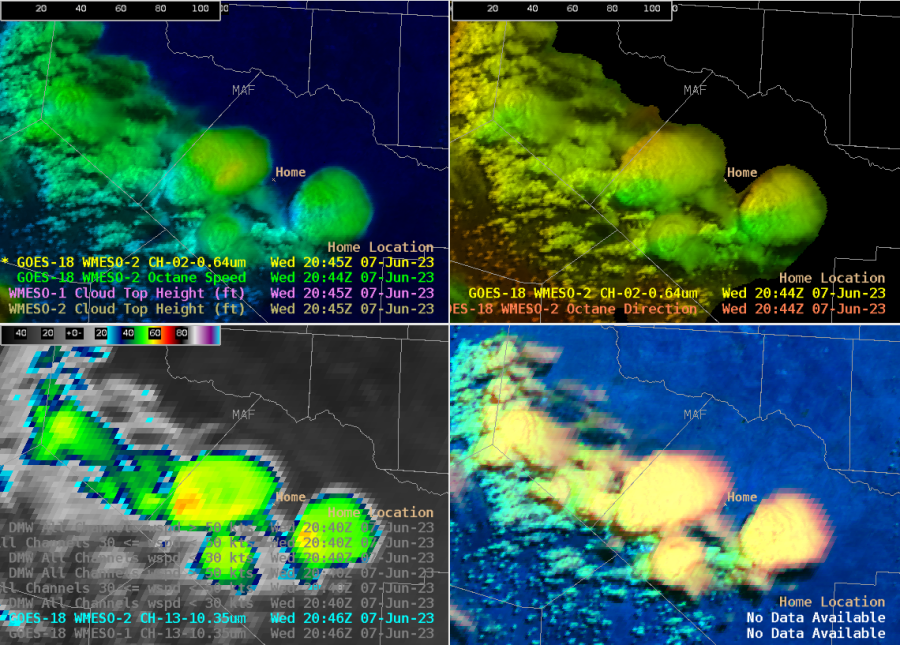
This product does help me become more aware, in realtime of the winds vertically. However, not entirely sure how to adapt this into my forecasting routine yet.
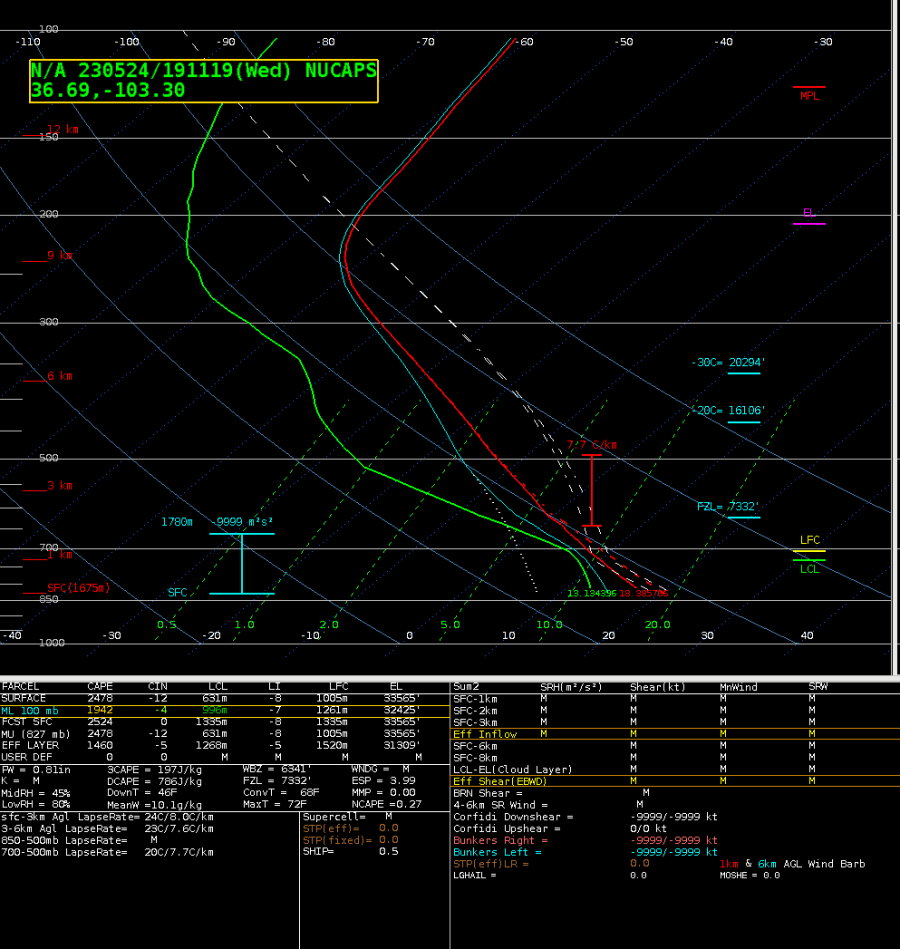
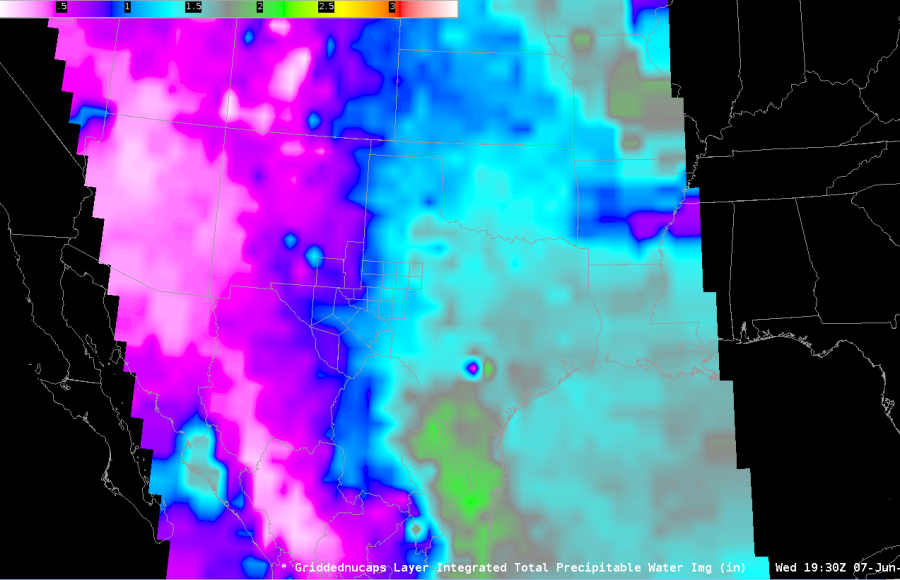
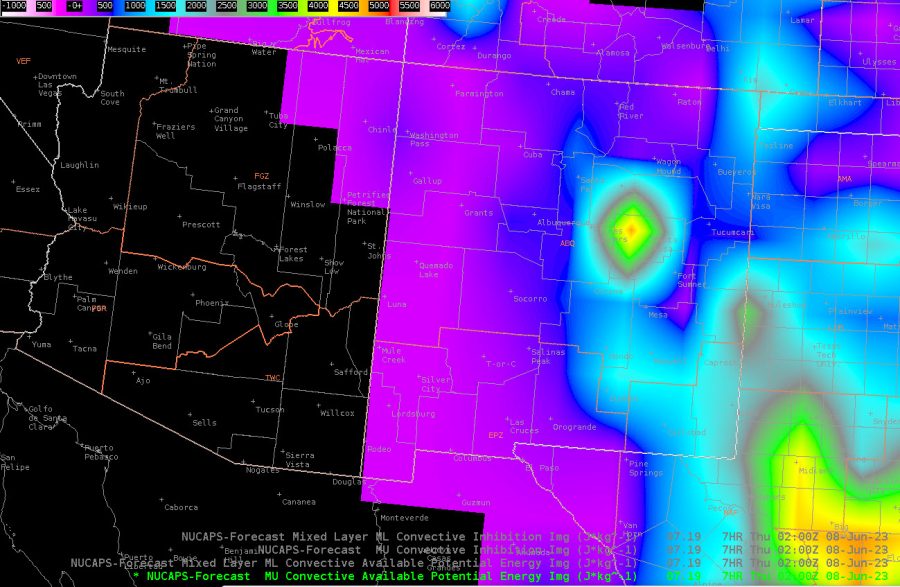
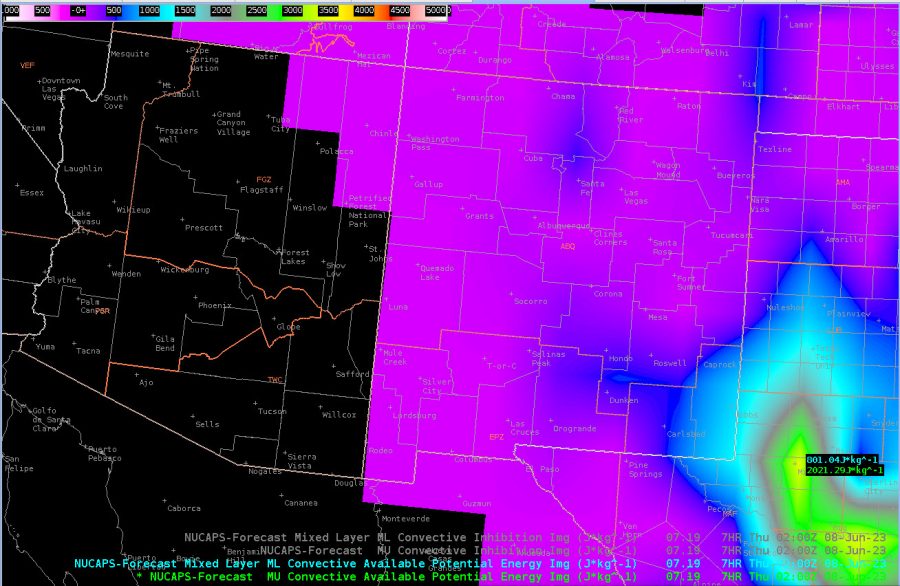
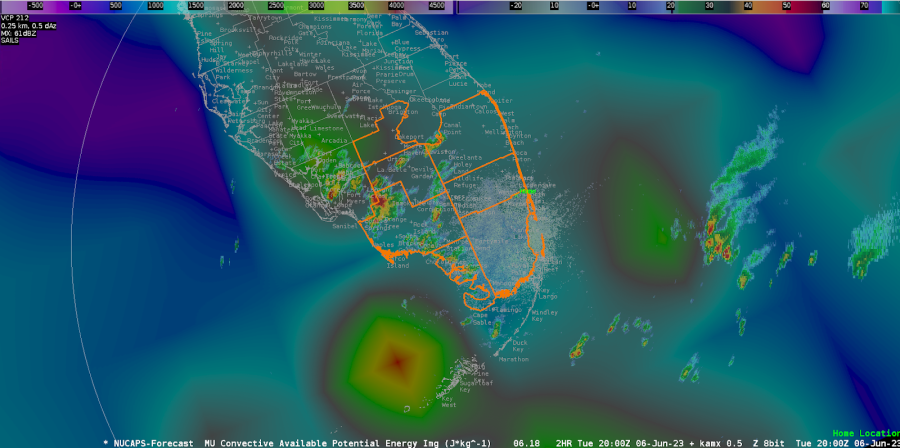
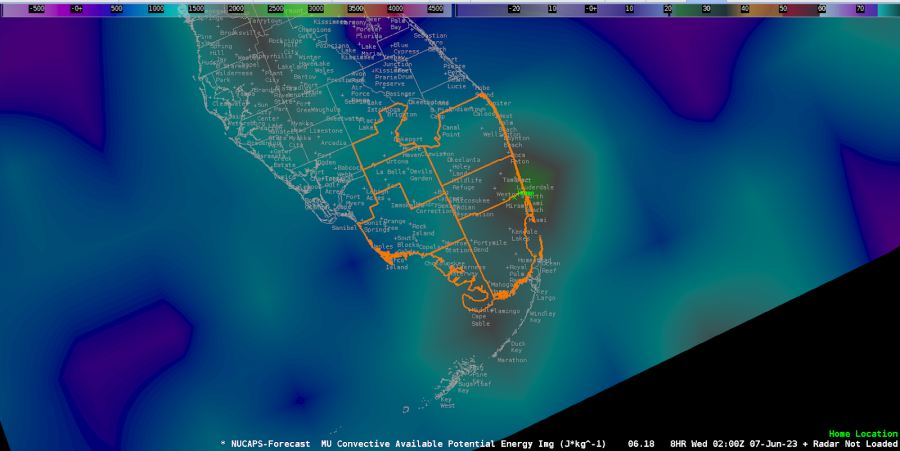
NUCAPS
Great to see the better sampling/readout of the data compared to what it was 2-3 years ago
The parcel count is a great way to help me gauge the validity of the data (confidence in how accurate it is)
Overlaying a NUCAPS forecast field with the parcel count allows me to sample what the field has and what the parcel count is so I can have more of less confidence in the data
No less than six hours for operational needs. 9 hours might be the perfect duration. I usually don’t use hourly data much beyond 9 hours due to my lack of confidence in the reliability of the data.
Hourly data is very nice. Half hour spacing is a bit too much data for that duration.
-Something to consider is could there be half hour spacing in the data for the first three hours? However I don’t know if that would be enough of a benefit to use.
I would use the 700-500mb lapse rates, ML CAPE, temp and dew point, and parcel count most often.
PHS
Very easy to look at; very smooth data
Didn’t have much time to look at the data
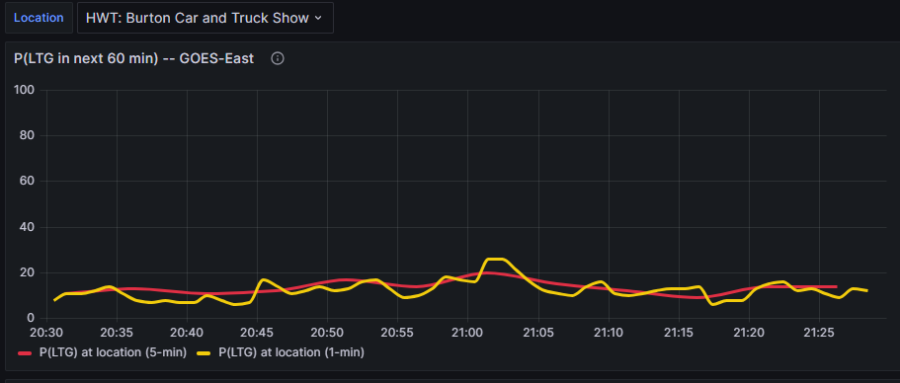
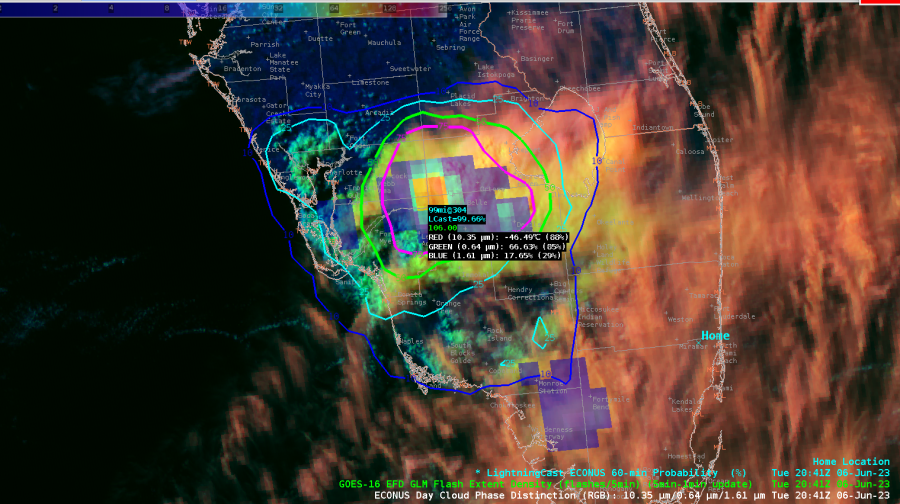
Lightningcast
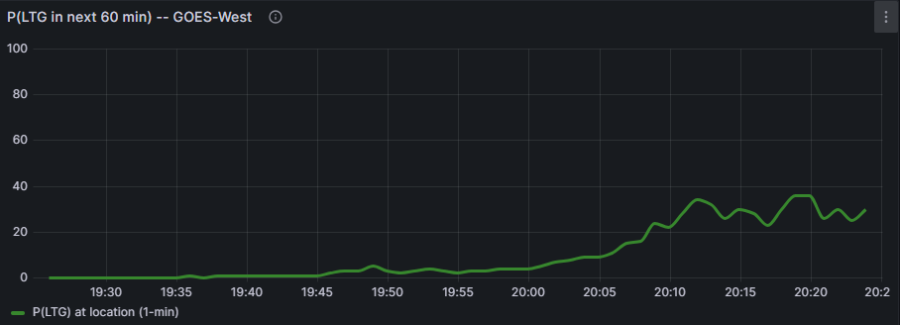
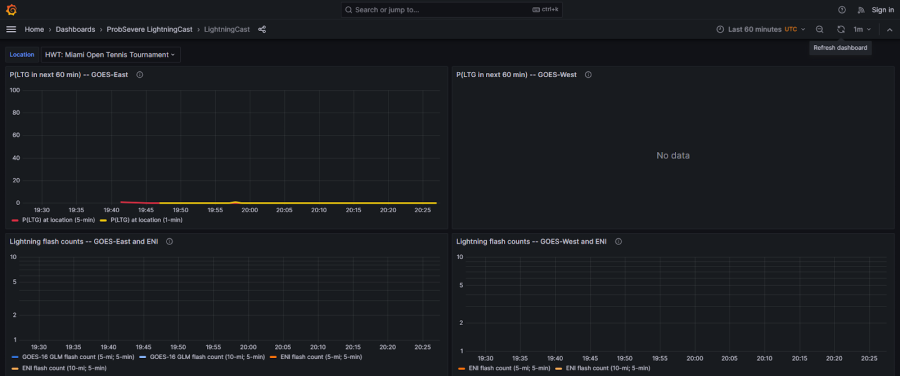
Noticed on a well defined supercell the lightning probability is not over 80% despite lightning ongoing. Does the program cap at 75-80%?
-Have GLM ligthning data displayed too
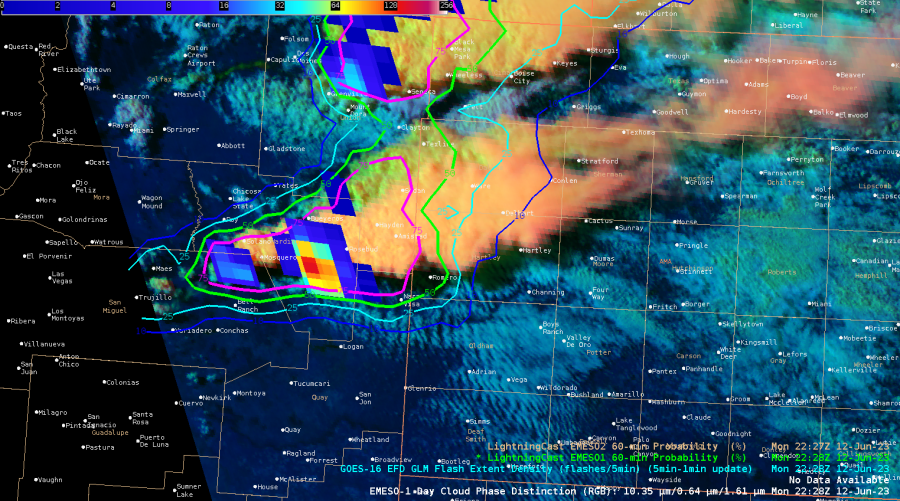
Otherwise this does help draw my eye to where lightning could occur in the near future.
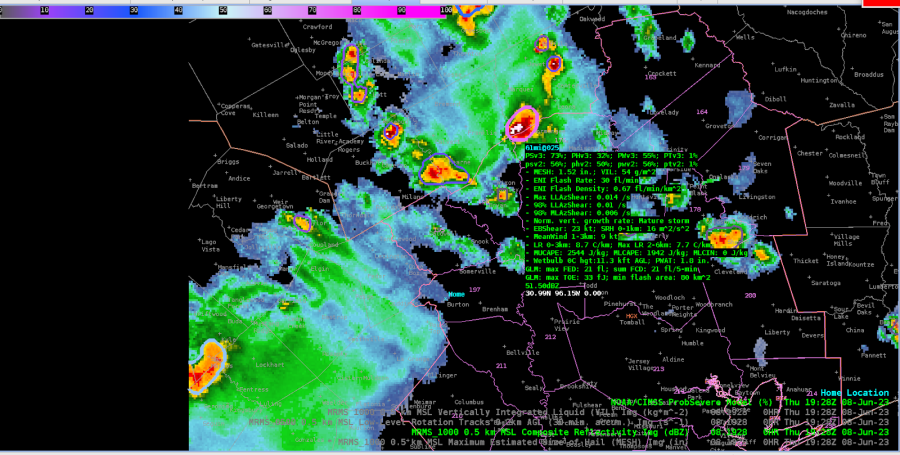
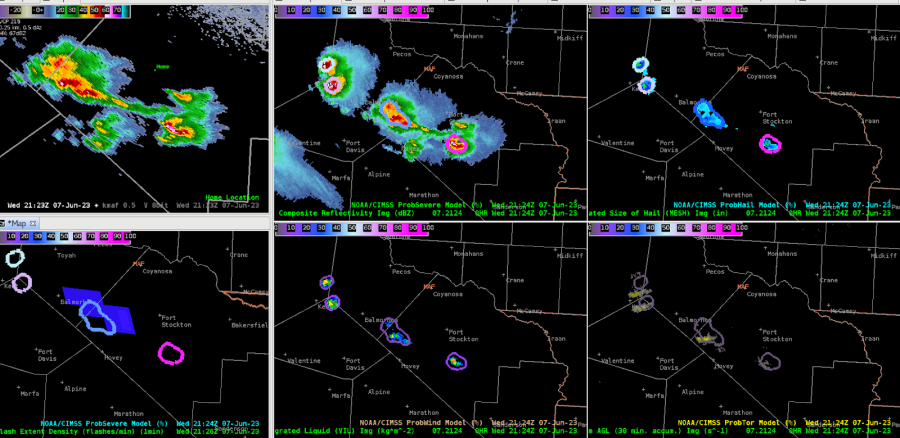
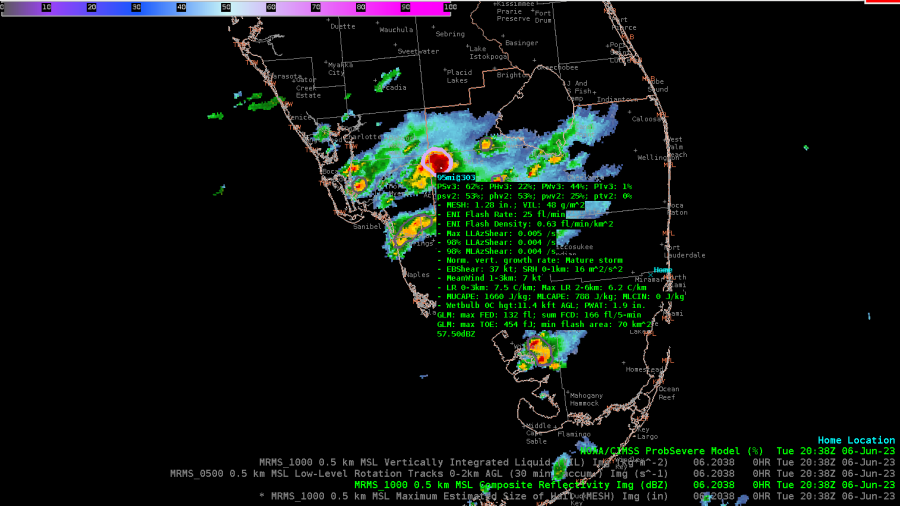
Prob Severe
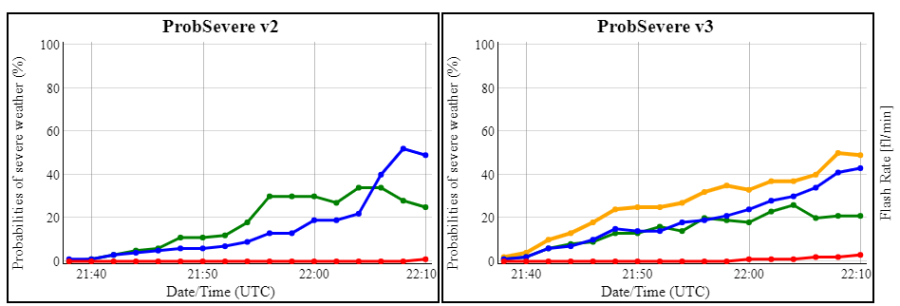
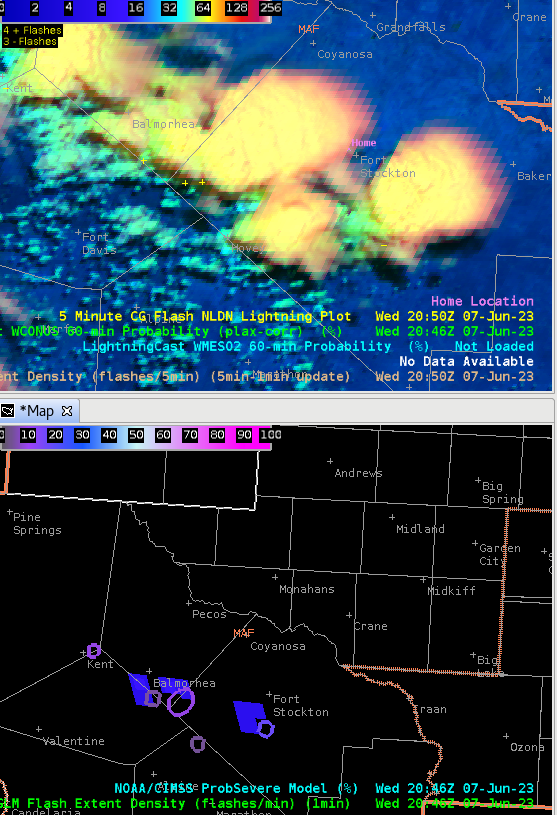
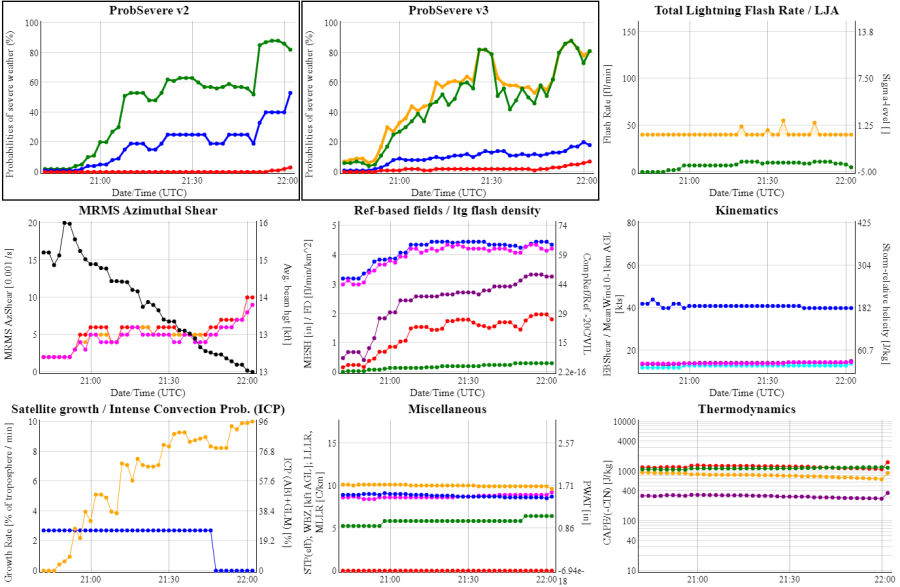
Didn’t have time to look at it much. Did notice the storm in eastern CWA had higher values for version 3 than for version 2
– Rainman

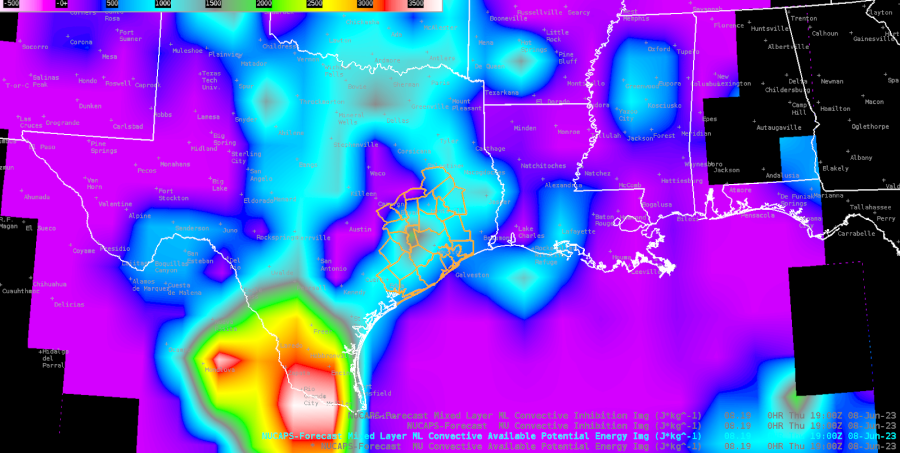
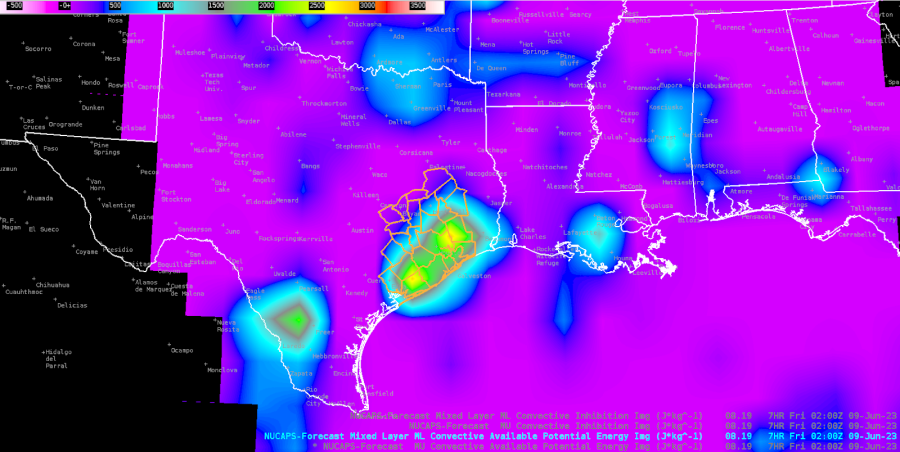
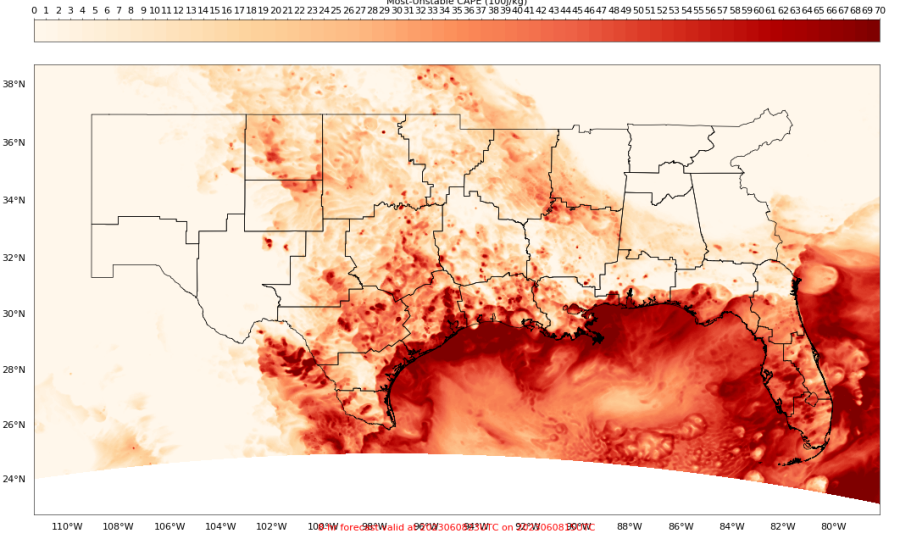
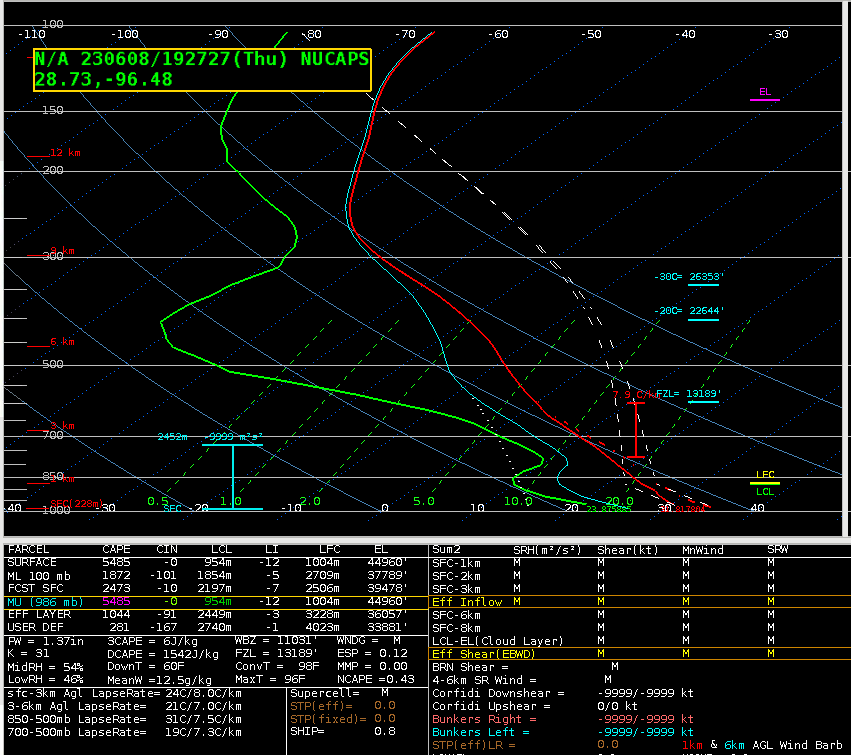

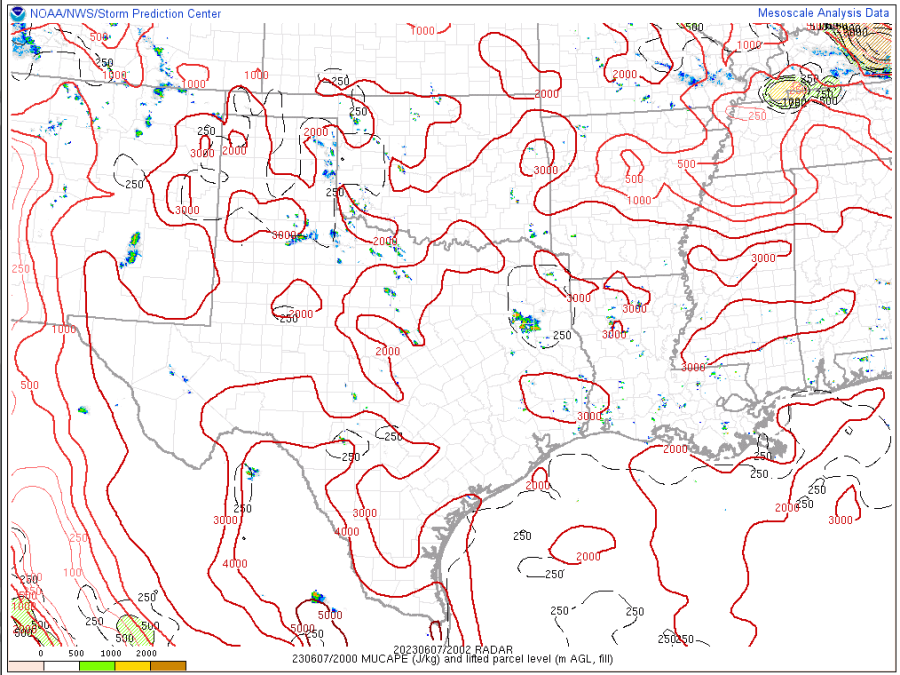
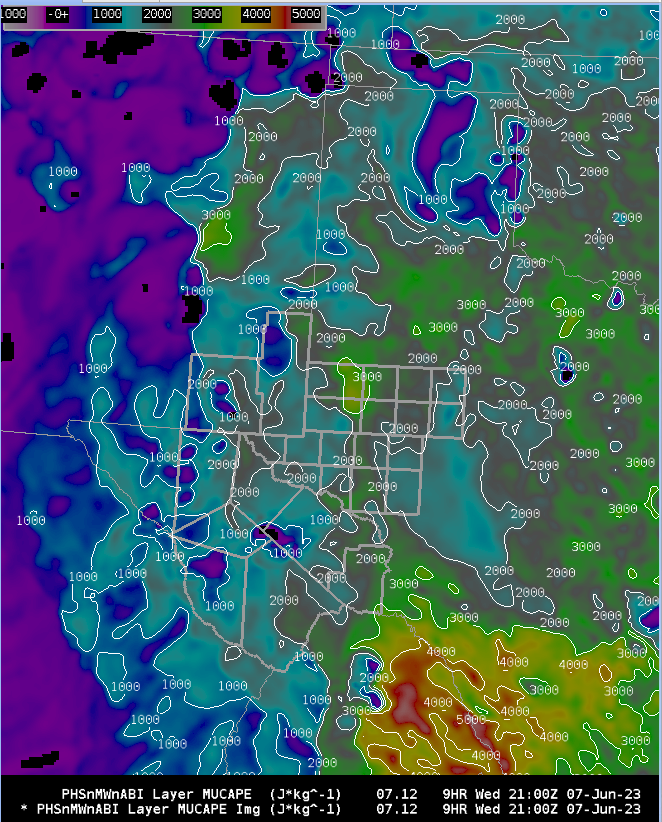
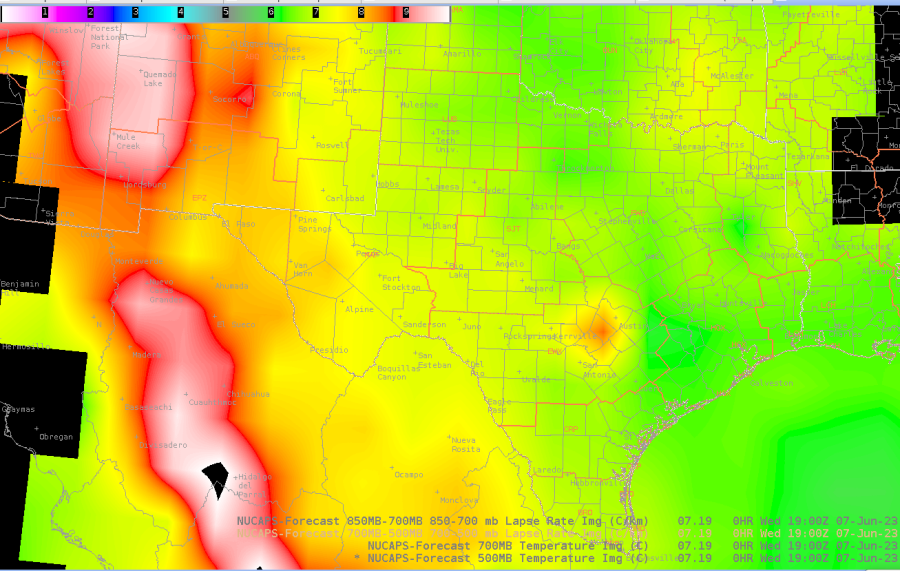
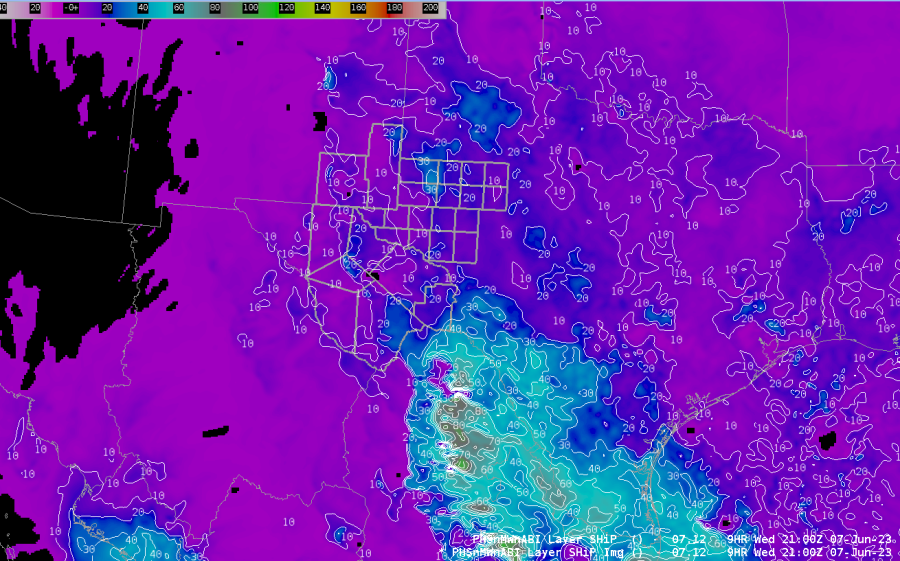
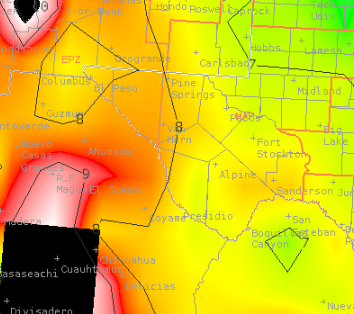

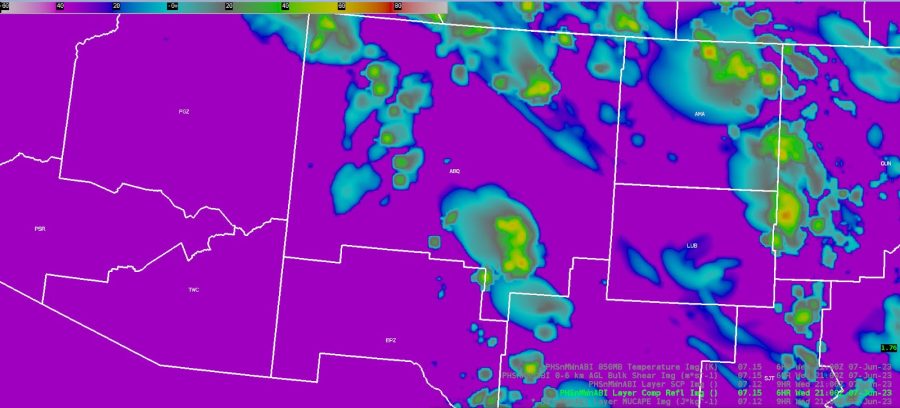


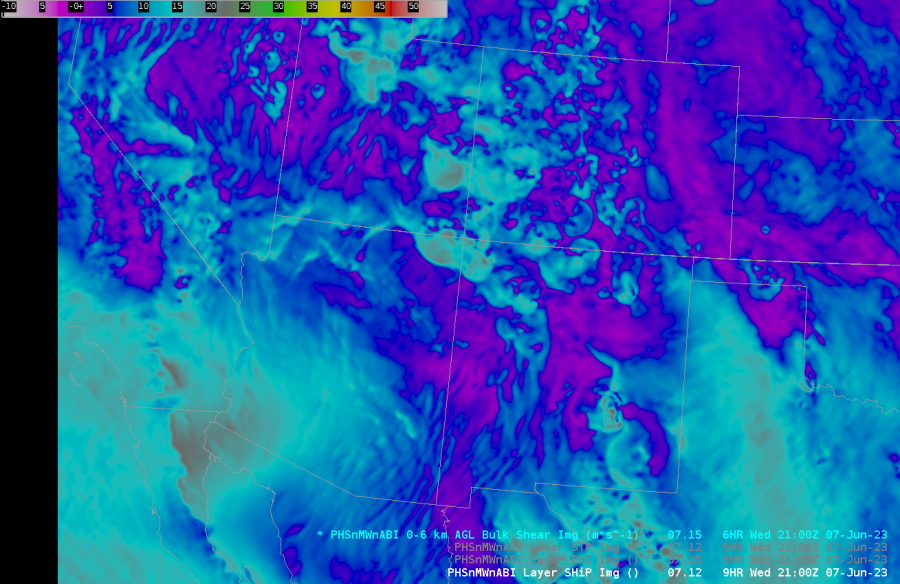
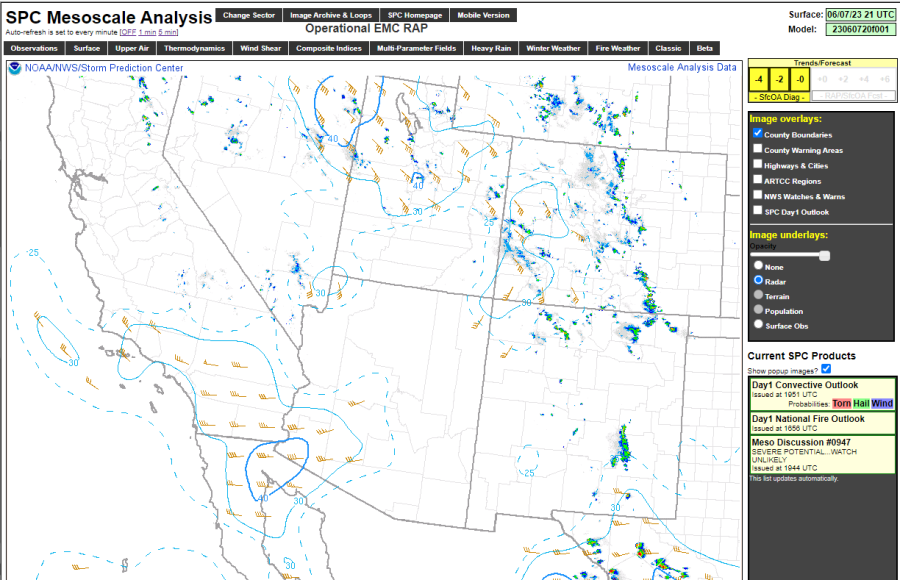


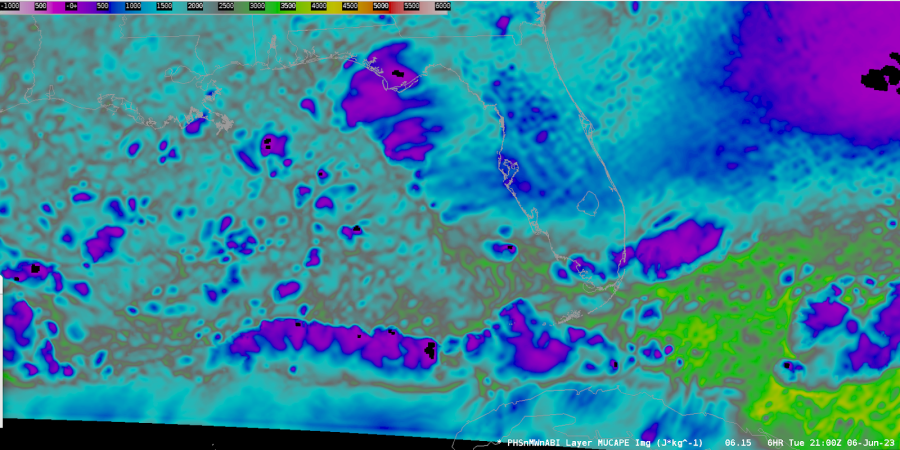

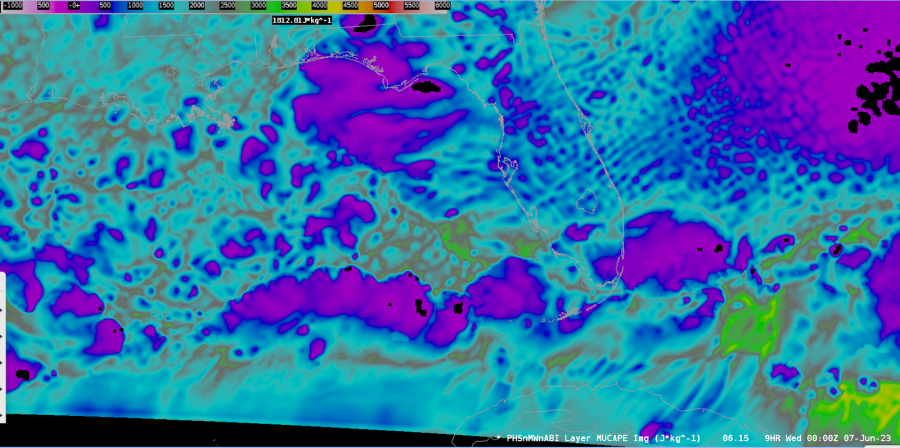


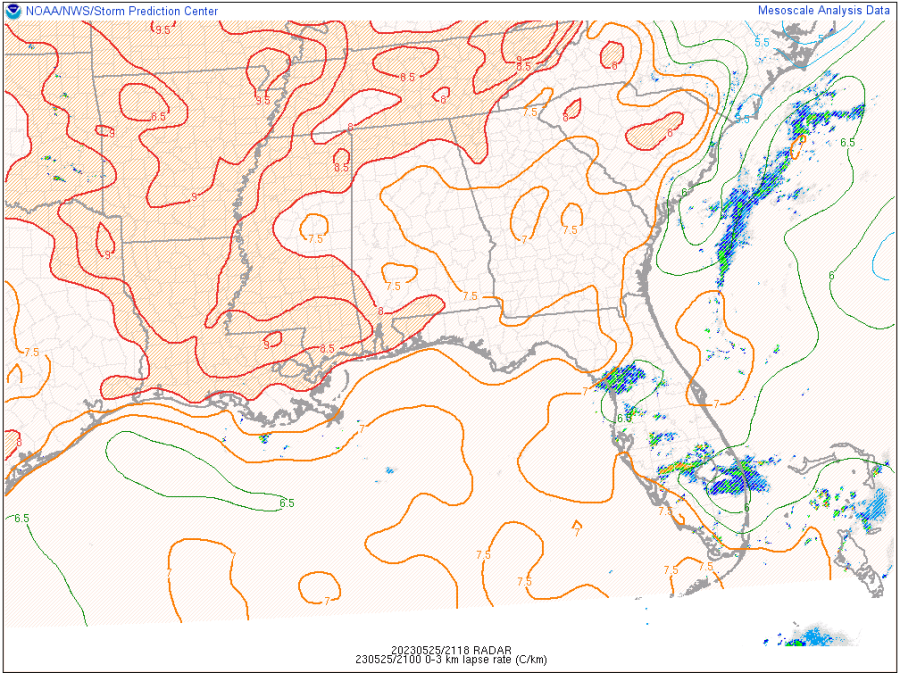

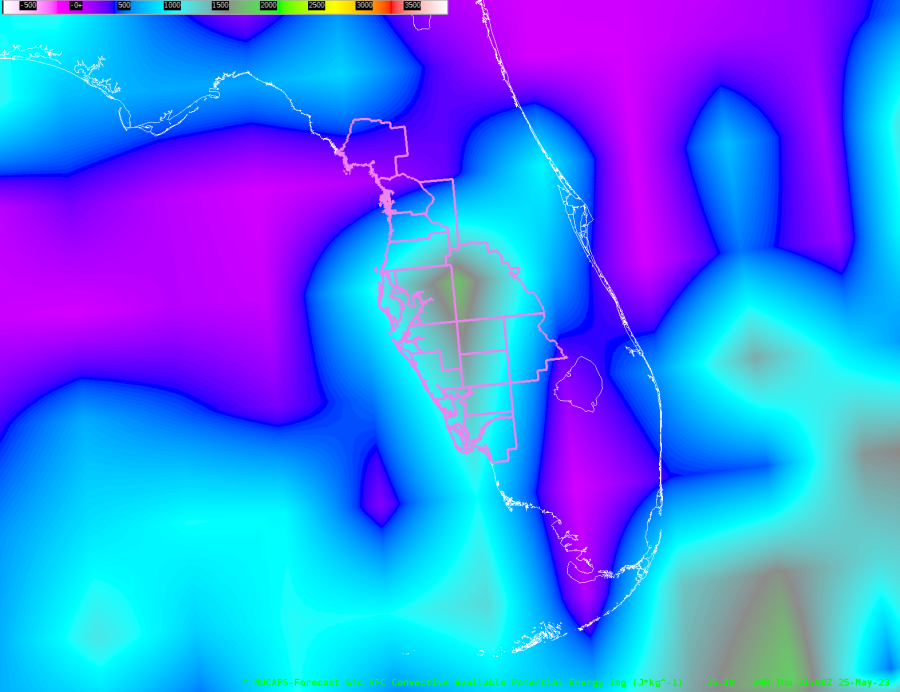 PHS shows a similar trend to NUCAPs with higher areas of SBCAPE across the central and southern CWA with lower values across the northern half of the CWA. However, the color scale on the online version of PHS is difficult to interpret as the gradient ramps up from light red to dark red. So, you cannot really pinpoint specific values of SBCAPE. However, you are able to see areas of lower SBCAPE and areas of higher SBCAPE at a glance.
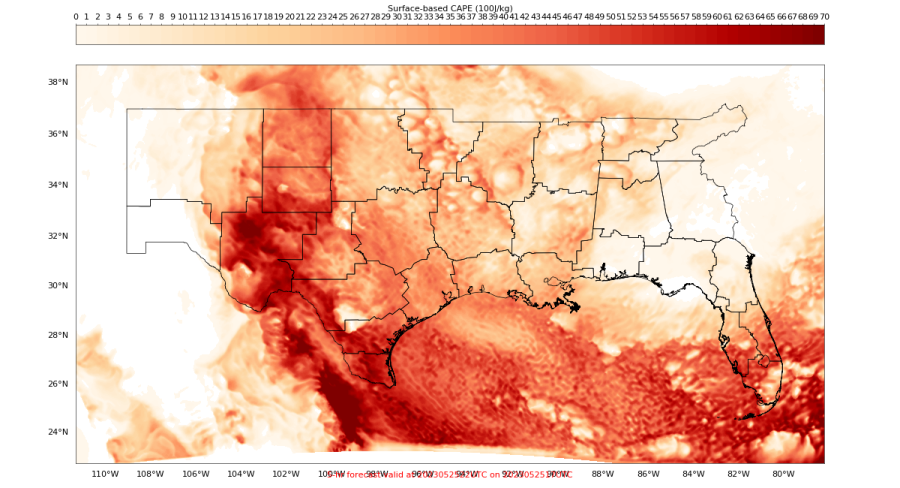
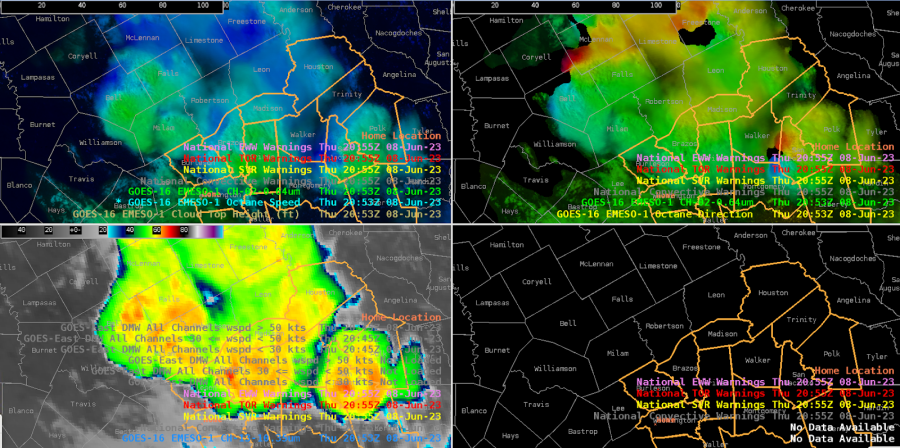
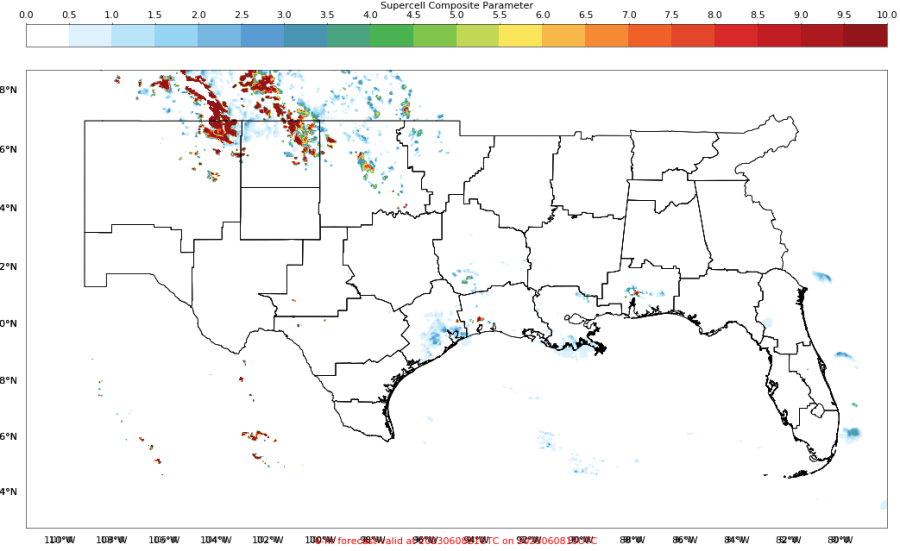
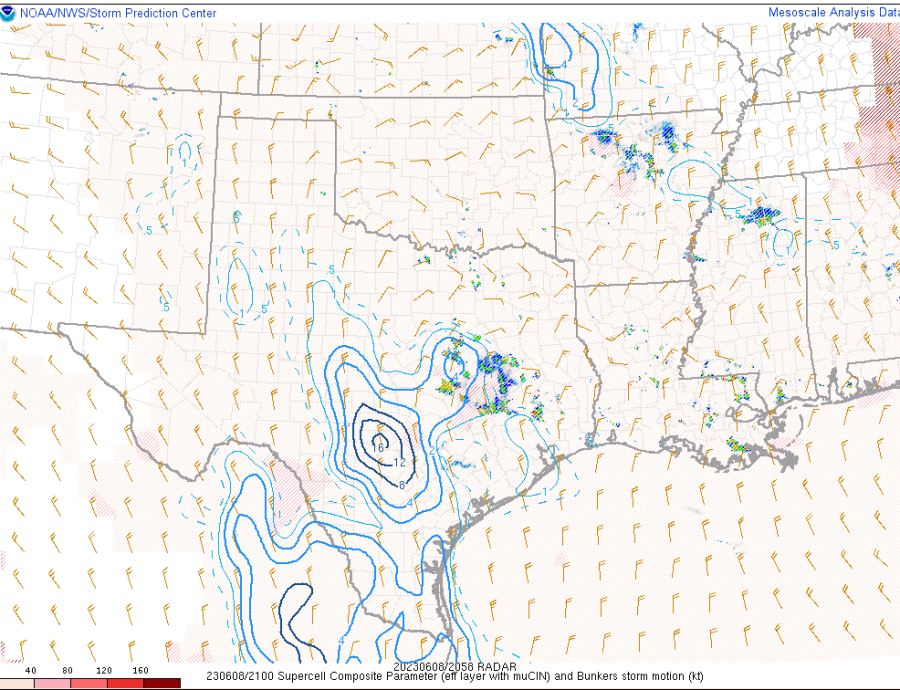
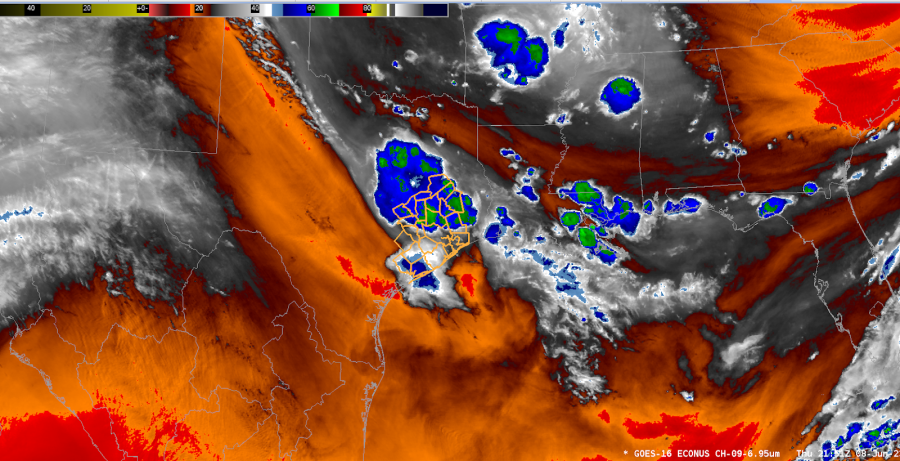
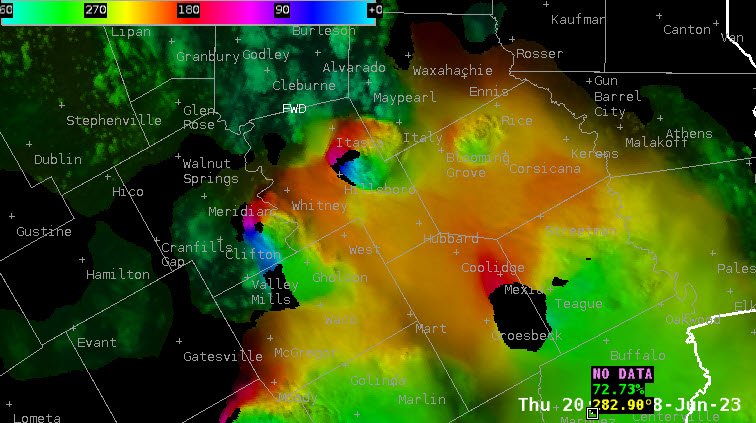
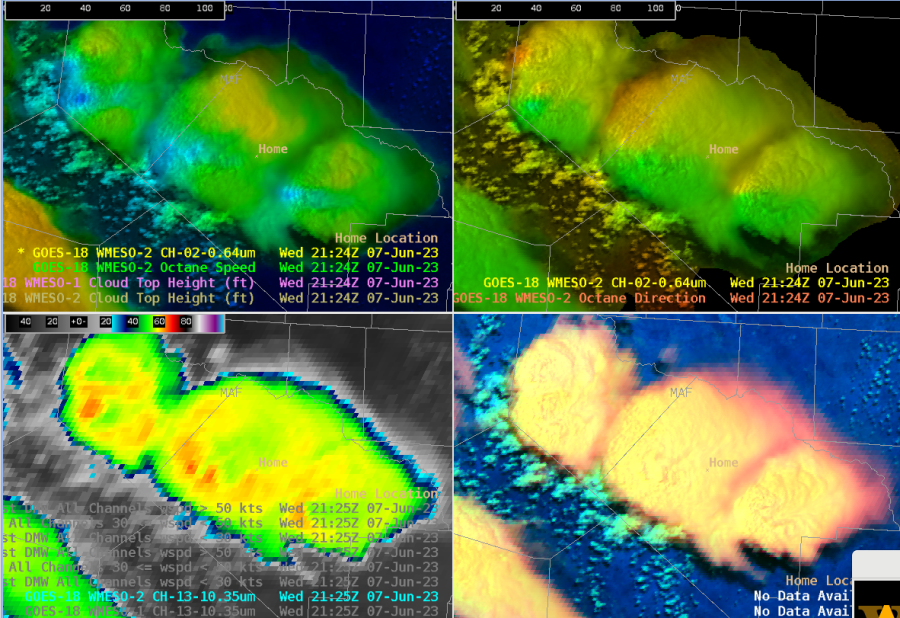
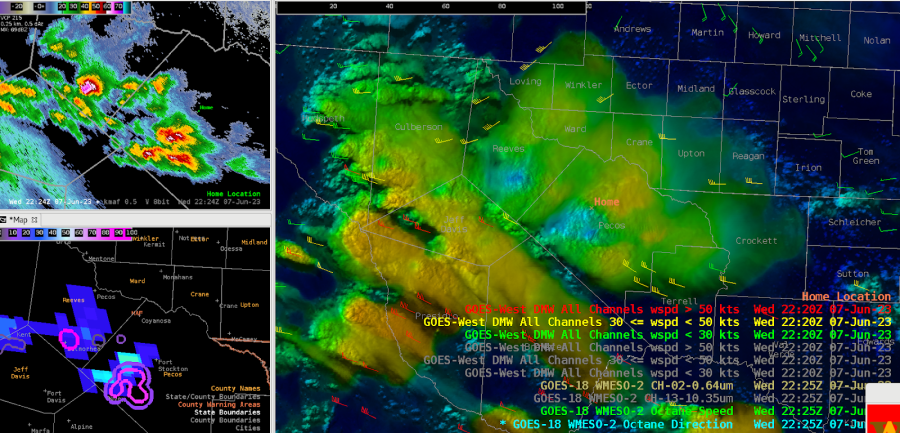
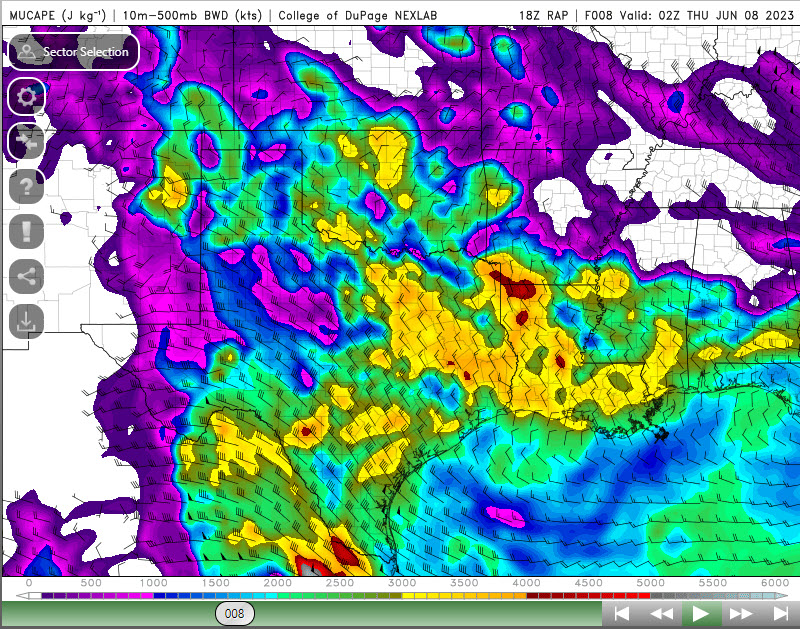
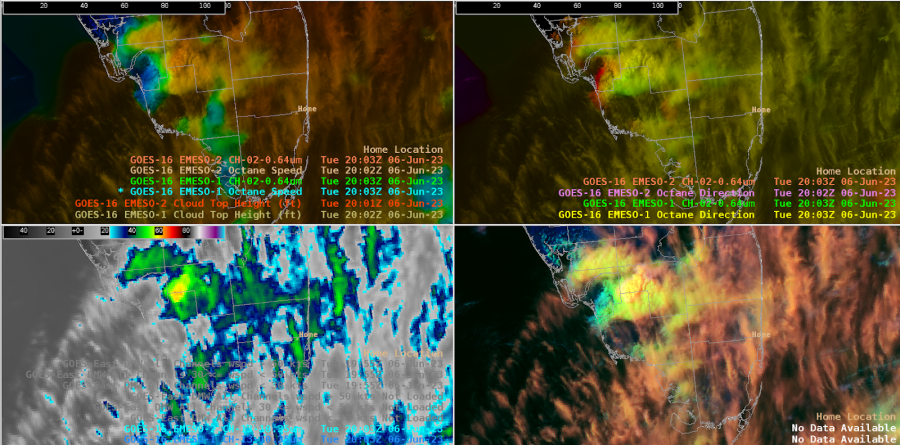
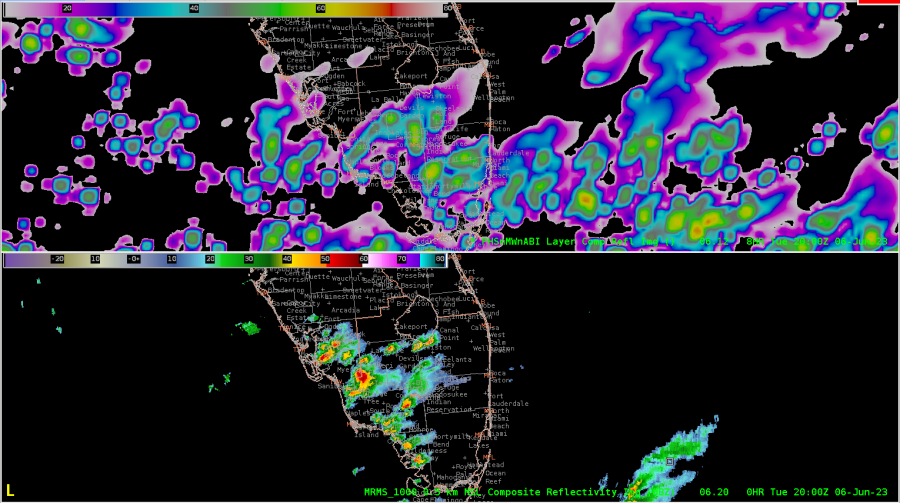
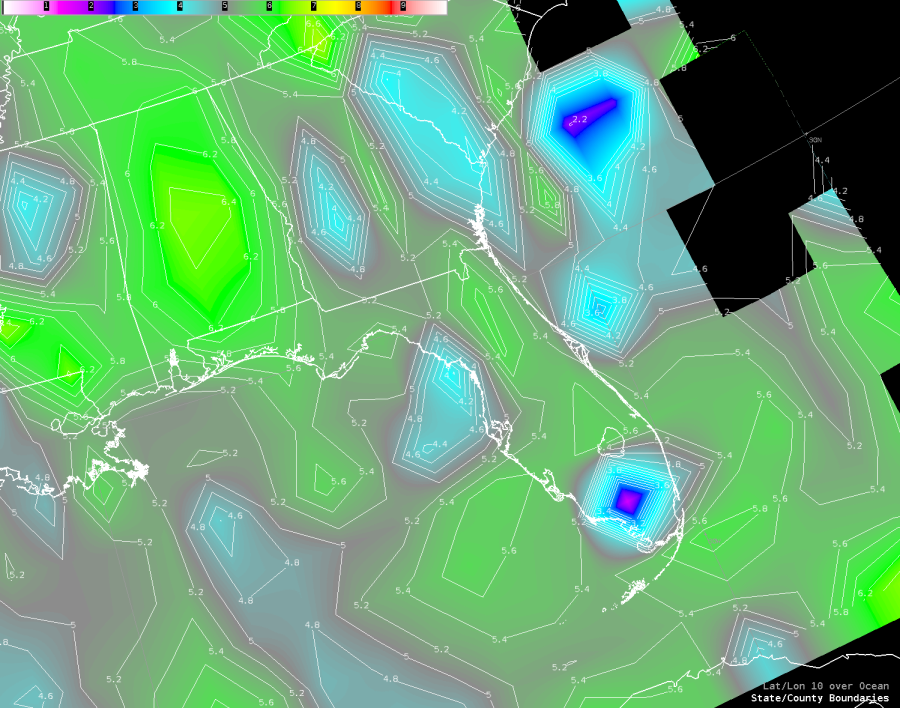
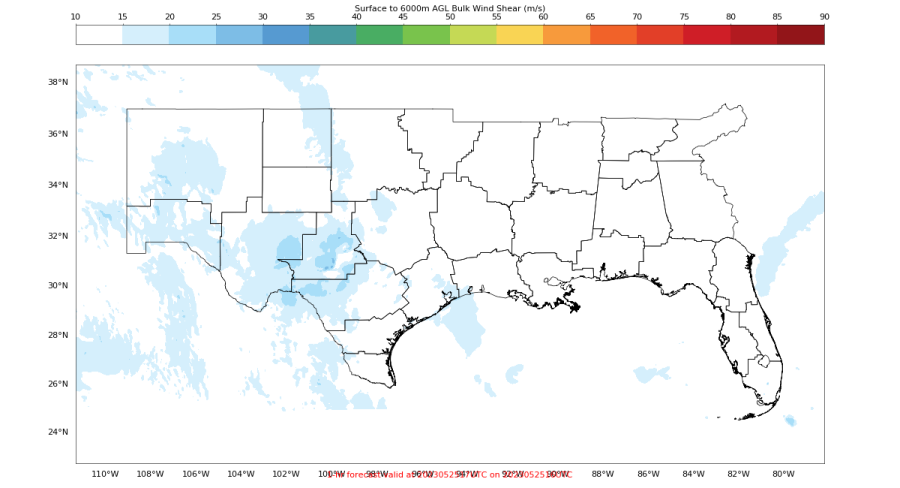
 The Octane Speed Sandwich product further confirms that storms are remaining below severe limits as the strongest storms are noted over southeastern Florida this afternoon as of 1930Z. Not only do these products help us pinpoint areas of potential severe weather, but they also help us pinpoint areas of sub-severe weather.
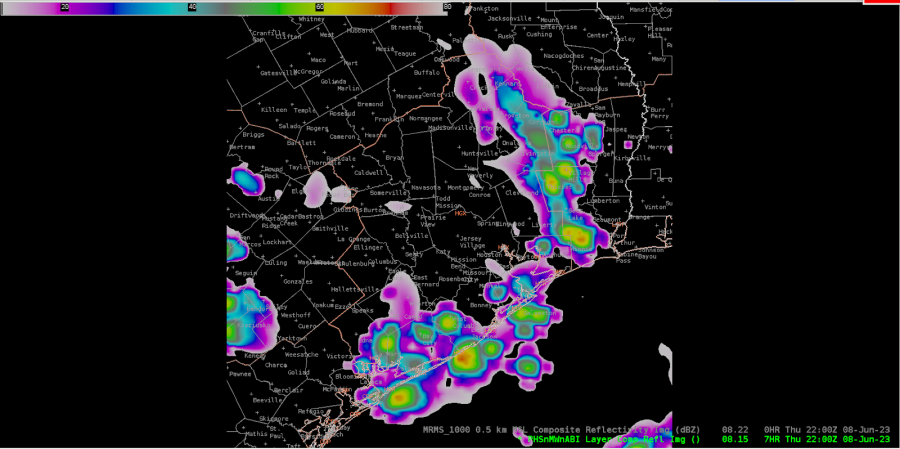
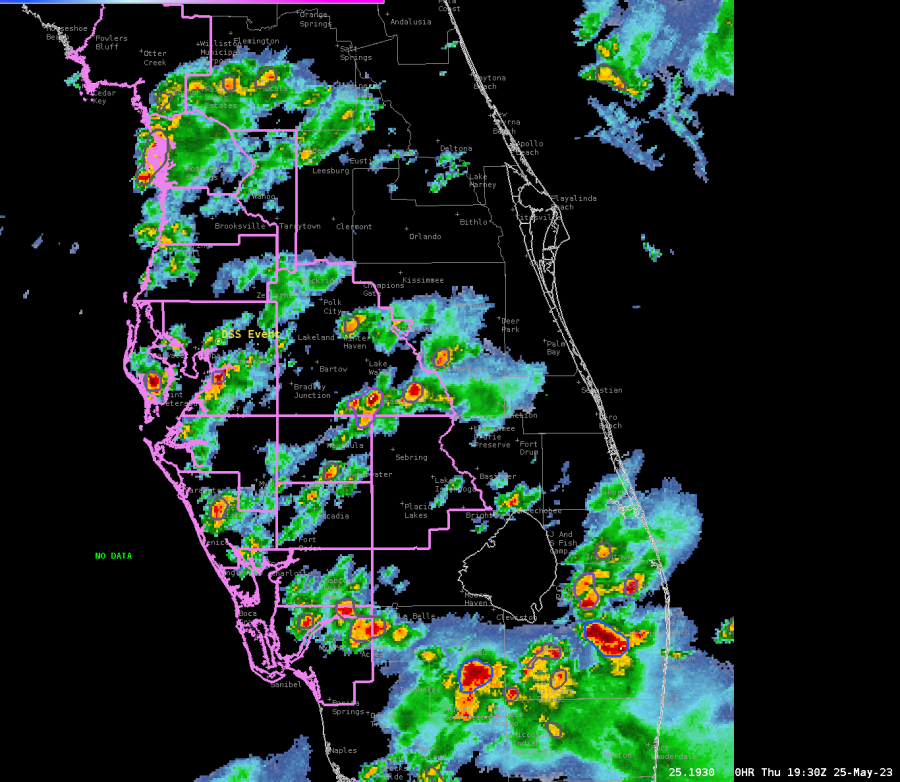
  GLM shows lightning activity increasing across the Tampa CWA early this afternoon, and activity is expected to gradually increase in coverage as more thunderstorms develop through the late afternoon and early evening hours.
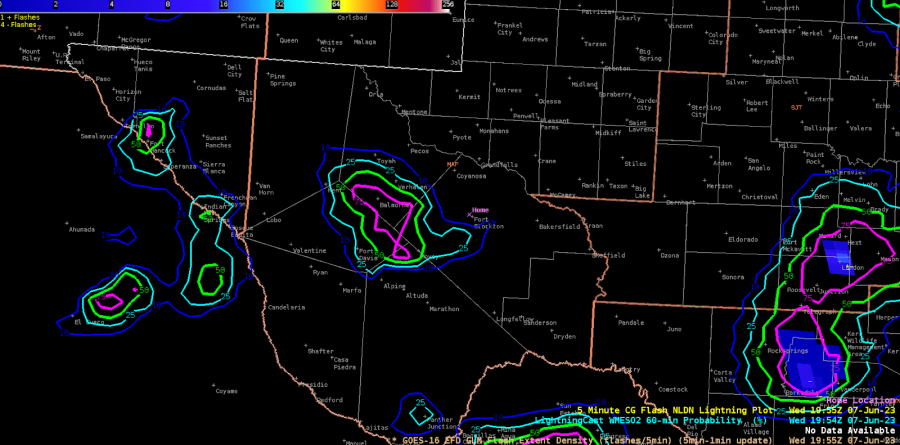
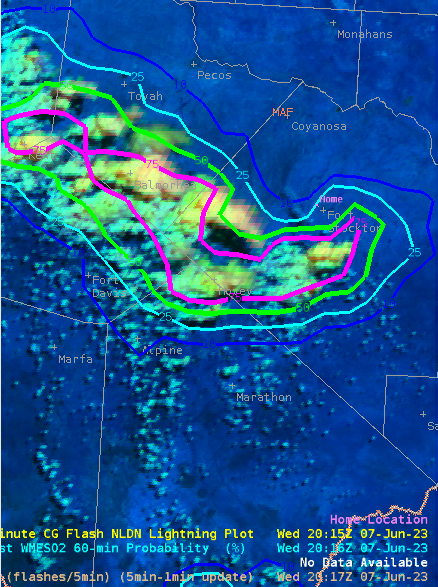
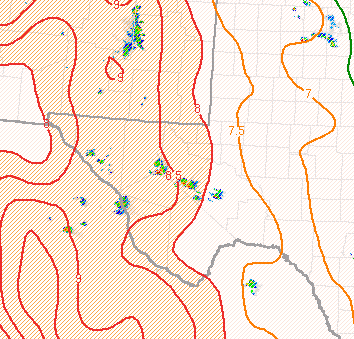
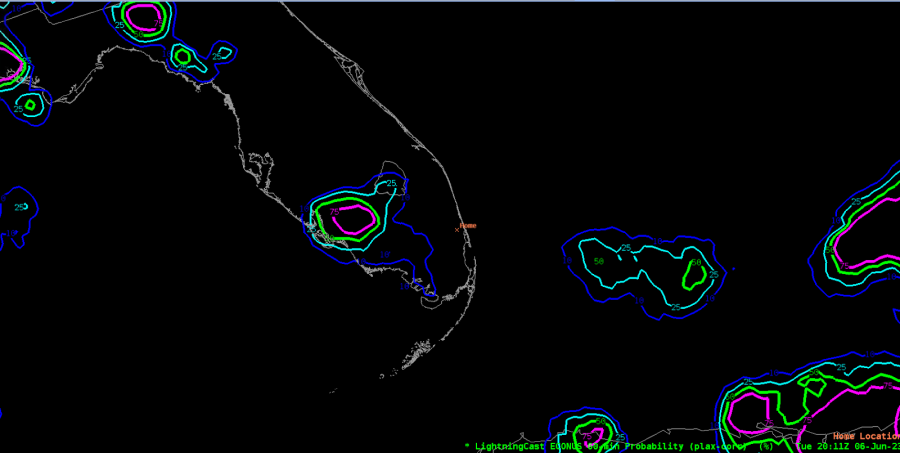
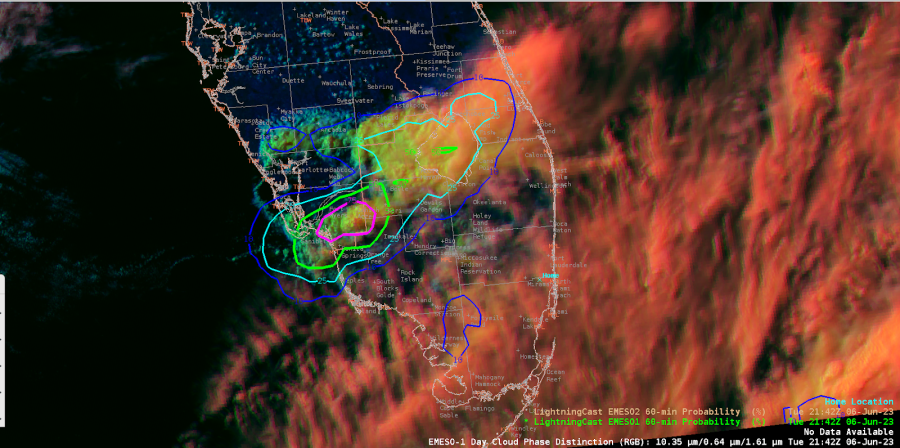
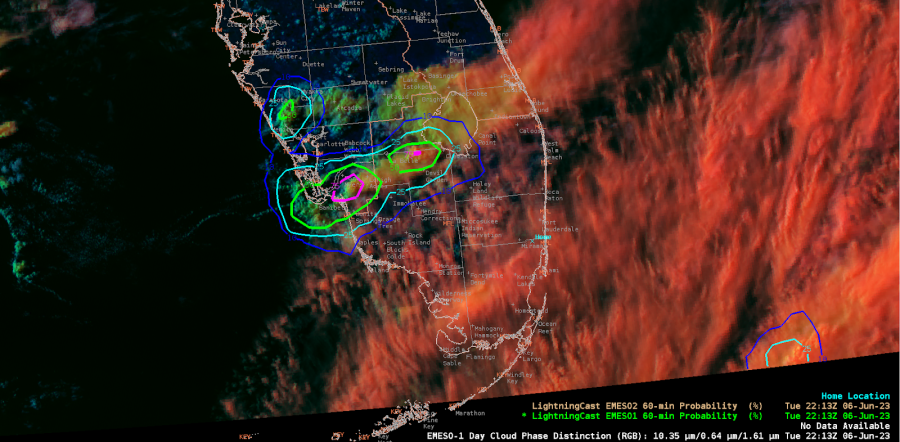
  Lightning Cast around 1930Z shows lightning probabilities increasing across the Tampa CWA over the next hour. Pink contours represent a 75% chance of lightning in the next hour. Green represents a 50% chance, teal a 20% chance, and dark blue a10% chance of lightning in the next hour.
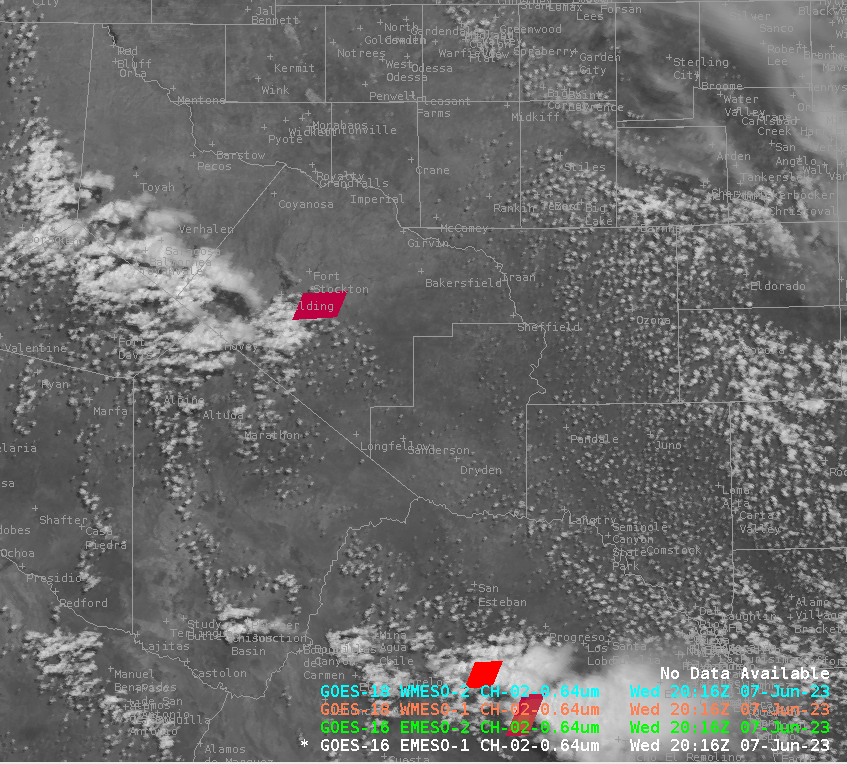
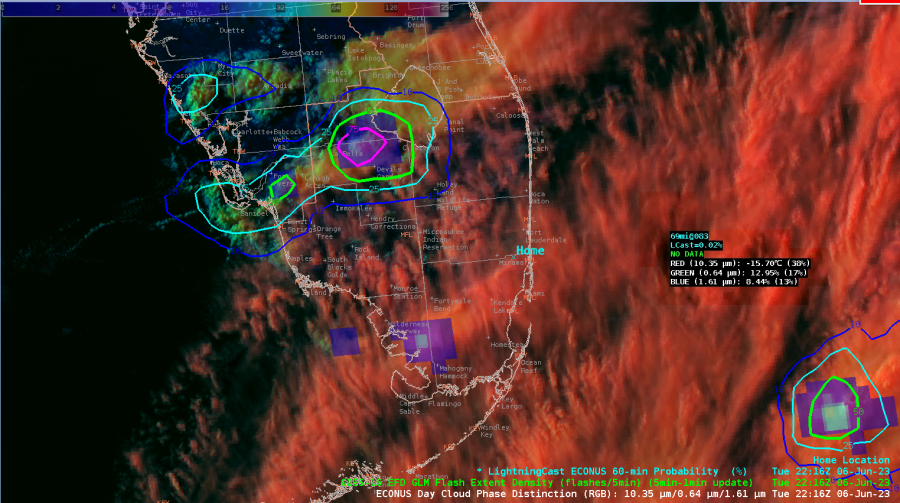
 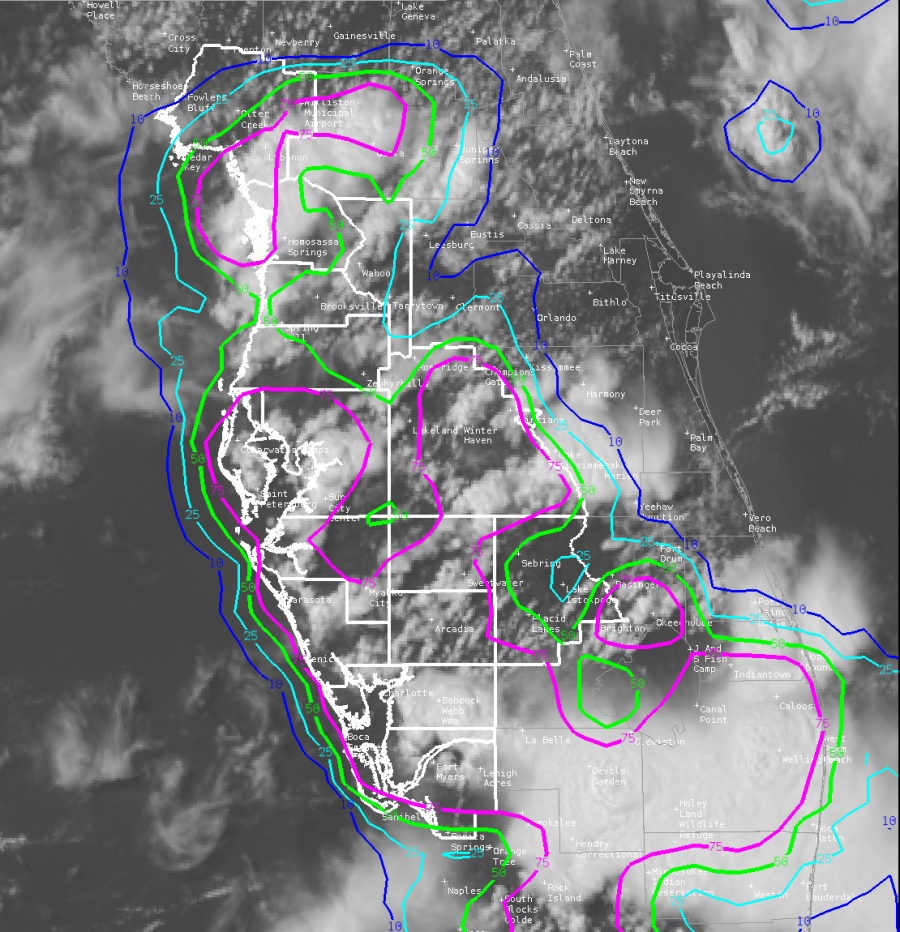 GLM showing lightning activity increasing across Florida from 1930Z through 2016Z across the Tampa CWA. Areas showing more oranges and yellows have shorter flashes and more lightning density. These areas help us know where stronger updrafts are located. The strongest updrafts at the time of this loop remain outside of the Tampa CWA.
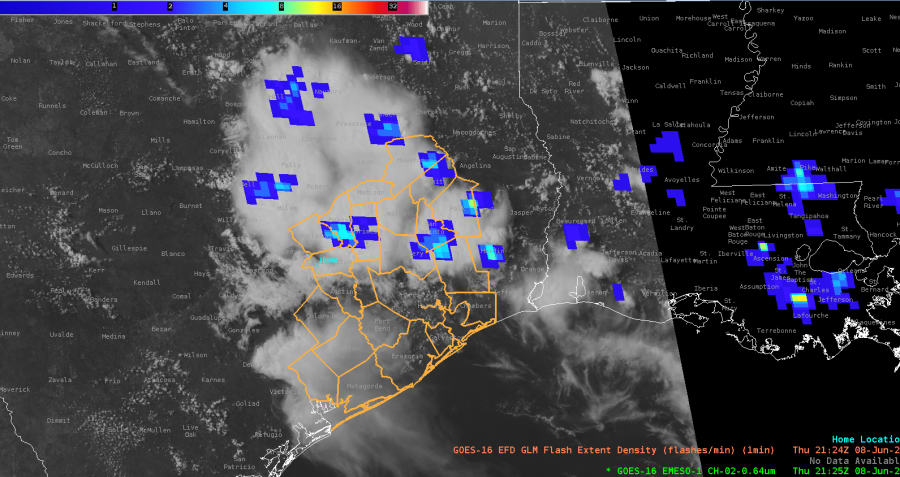
  -Dwight Schrute