Comparison of ENTLN and GLM Lightning Data

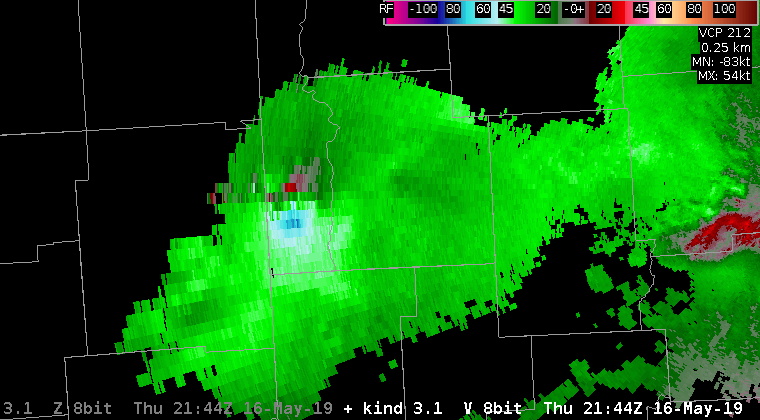
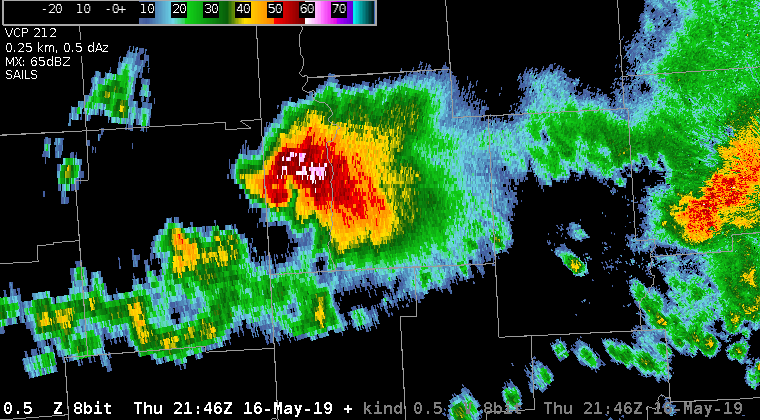
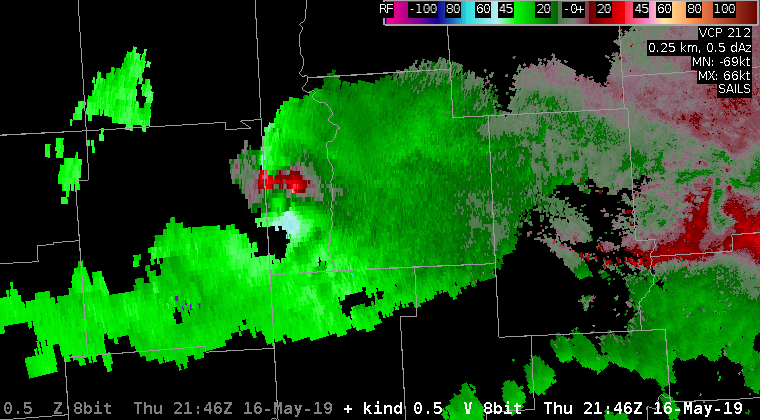
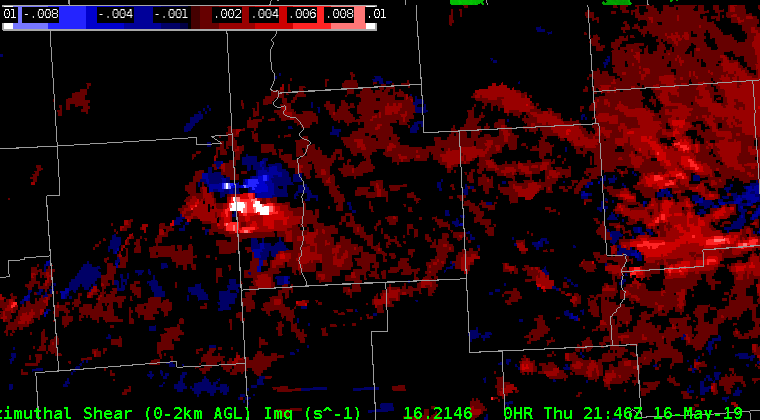
Storm of interest is the supercell NW of Childress, TX.  Increase in ENTLN lightning occurred before a substantial increase in the 0-2 km and 3-6 km MRMS azimuthal shear. The signal in the GLM flash extent density product was muted in comparison to ENTLN data. ProbTor went from 12% at 2124Z to 52% at 2130Z.  At 2140Z, ProbTor peaked at 91%, which corresponded with the maximum 0-2 km MRMS azimuthal shear (0.20 S-1) associated with this rotation track. I frequently use the ENTLN data in operations and am trying to incorporate GLM products.

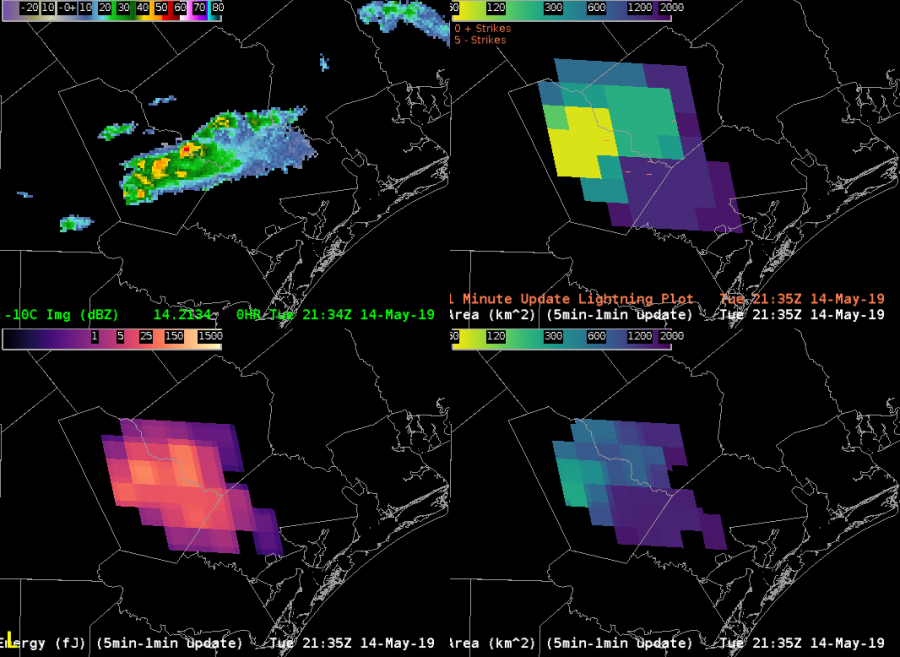
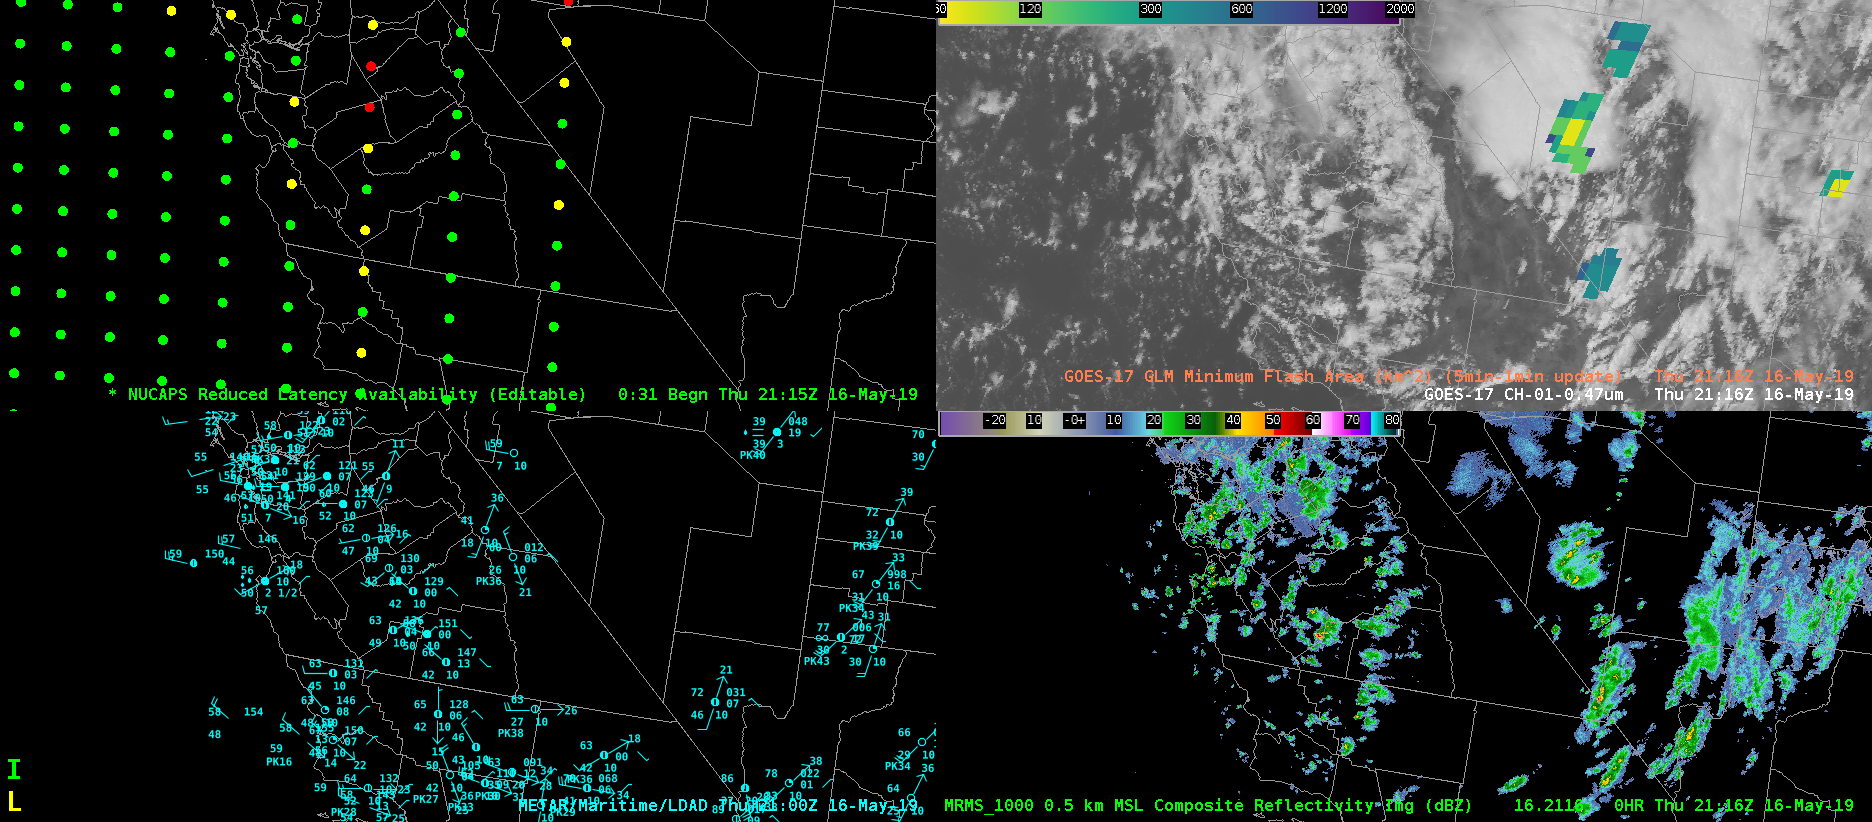
So far, the most useful GLM components, largely because of their visual representation and relationship to updraft growth rate or intensity, are the flash extent density and total optical energy.  These two products helped me maintain situational awareness on individual storm intensity trends.  Plotting the flash extent density and total optical energy in a four panel with GOES IR imagery and base radar data, I can quickly decipher which storms pose the greatest risk for severe weather.  Roy

the California convection that could actually convect

A late season trof moving onto the west coast has everyone east of the Rockies excited for tomorrow and the weekend. It is associated with an unusually late season and significant rain event throughout CA with afternoon storms scattered about in the central valley, deserts, and Sierra Nevada. The GLM was able to detect lightning in several storms in CA and NV. NOAA-20 made an overpass around 21Z and provided several viable soundings in the San Joaquin Valley and near the CA coast.

The NUCAPS sounding centered in Tulare County is shown below. MUCAPE values on the order of 563 J/kg were supportive of low-topped thunderstorms.  Neighboring soundings indicated similar or slightly reduced values of instability. With the focus on severe convection east of the Rockies, it is nice to see NUCAPS perform so well in a completely different region and dynamical regime (namely post-frontal open cellular convection).

Brian Kahn

IND TVS

15 min prior to 1.75″ hail and 20 min prior to baseball-size hail, a supercell tracked NNW-SSE through Vermillion Co, IL …the Probsvr nailed the values for ProbHail at 96%, VILD 4.3, and a well defined TVS (100kt G-G) and strong MESO on NEXRAD ~ 7k’
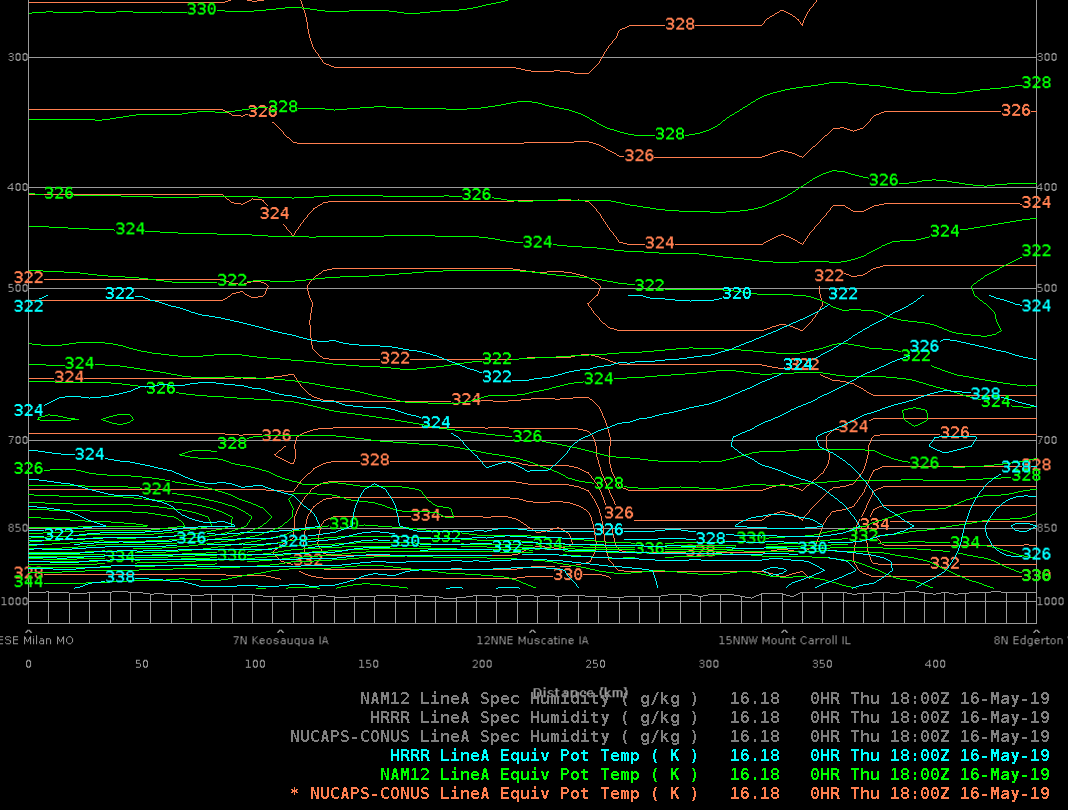
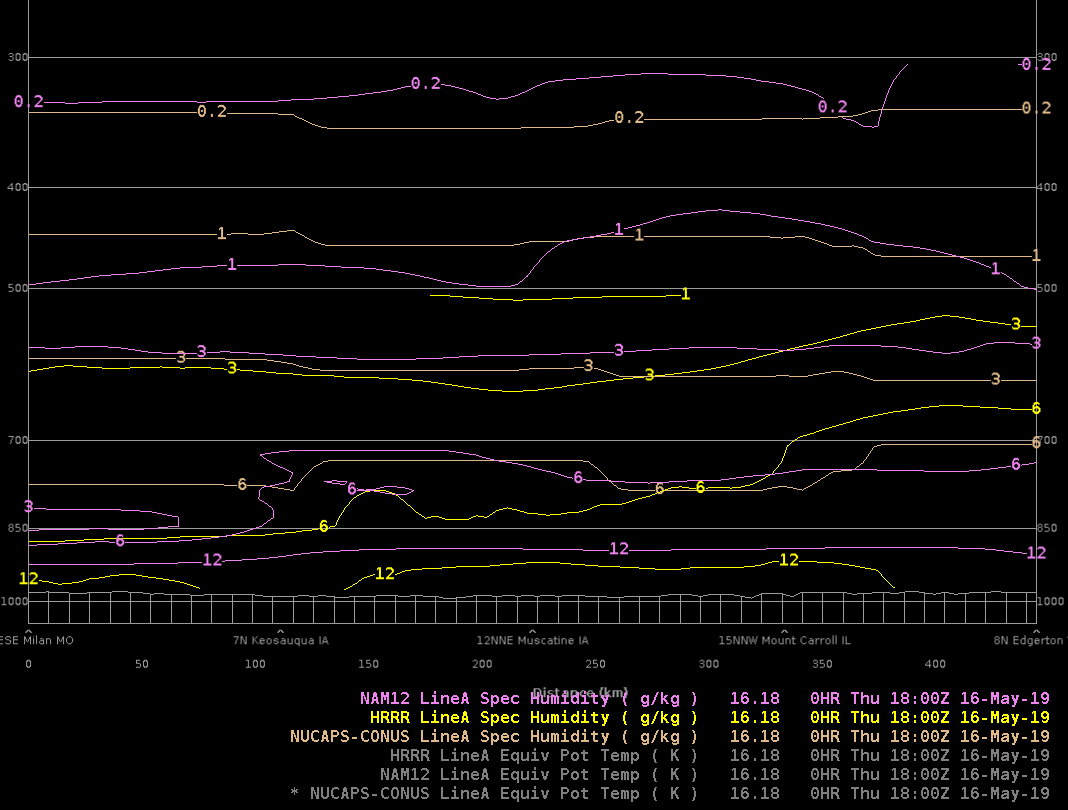
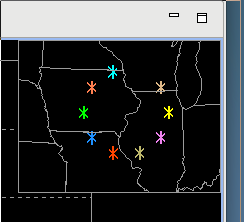
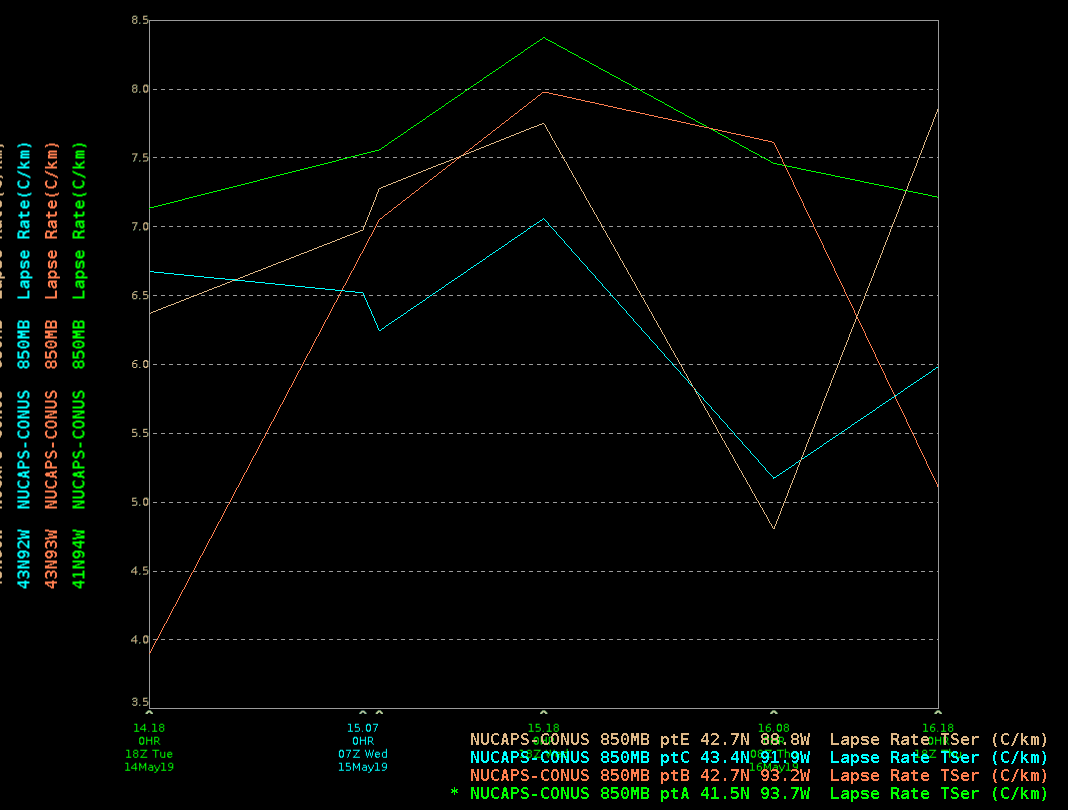
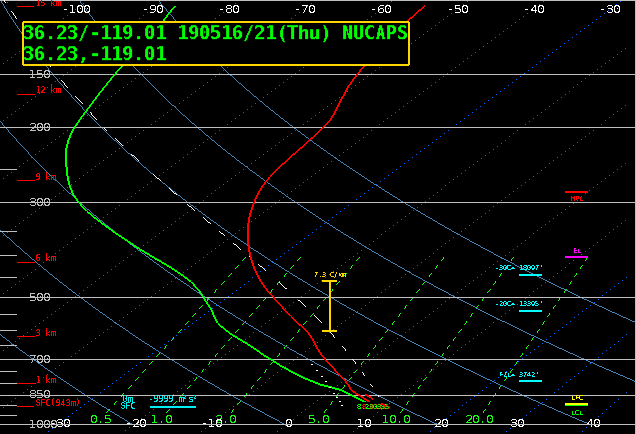
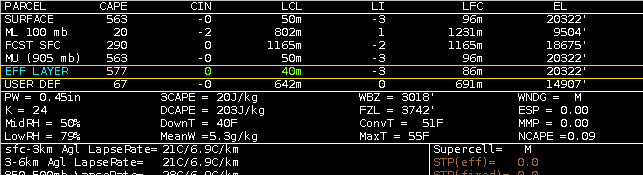
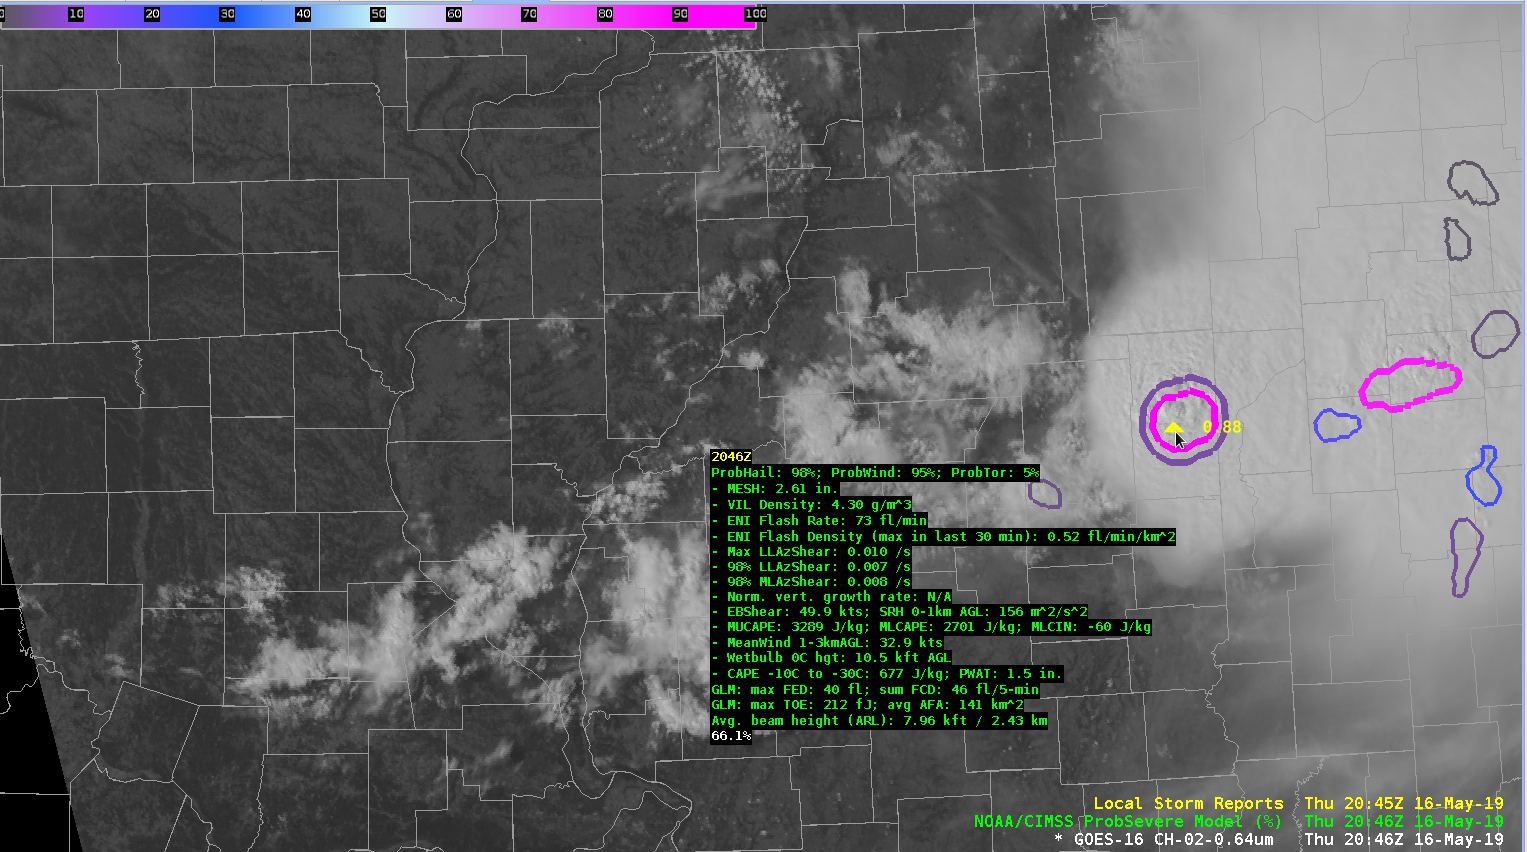
NUCAPS SVR TS values kinda nailed it in Ern IL :

East Central IL  (green dot) MU and FCST SFC CAPE were > 4000, LIs were > 12, DCAPE > 1000 (~50KT Gusts), SHIP > 1 and LR H8 – H5 ~8SRM showed Storm Top Div > 130kt 12 min prior to the Baseball Sized hail
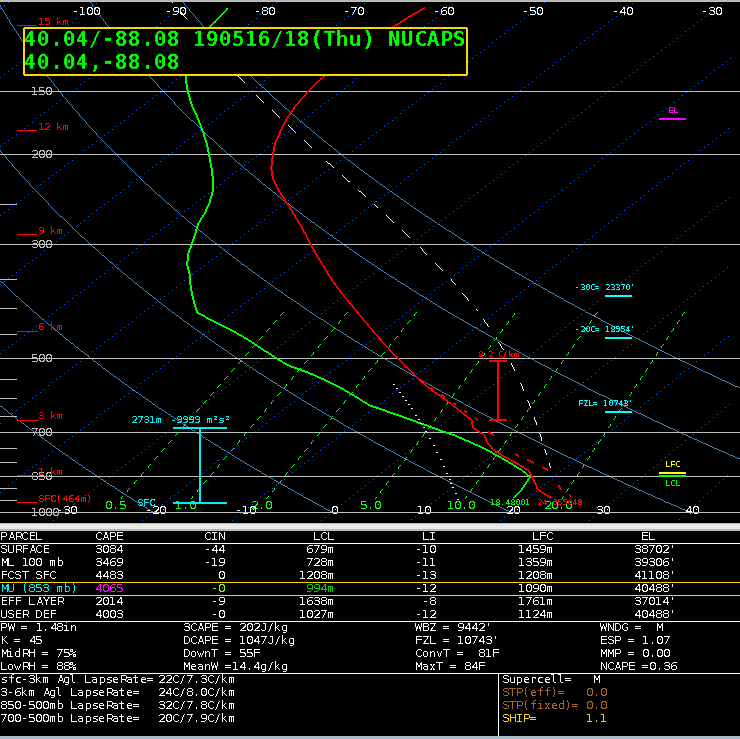
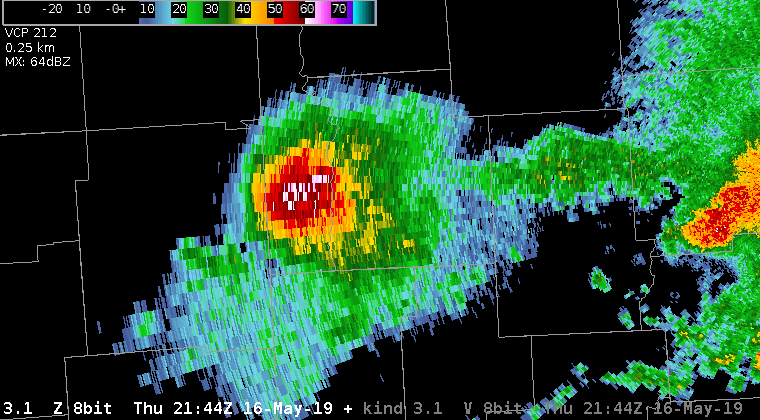
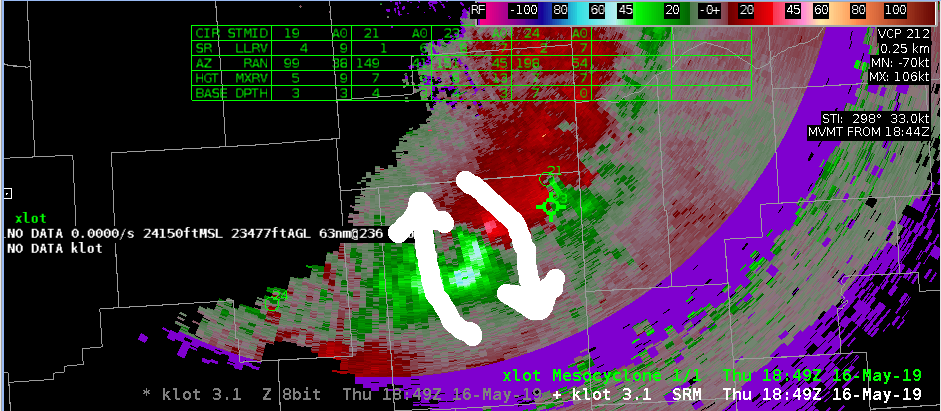
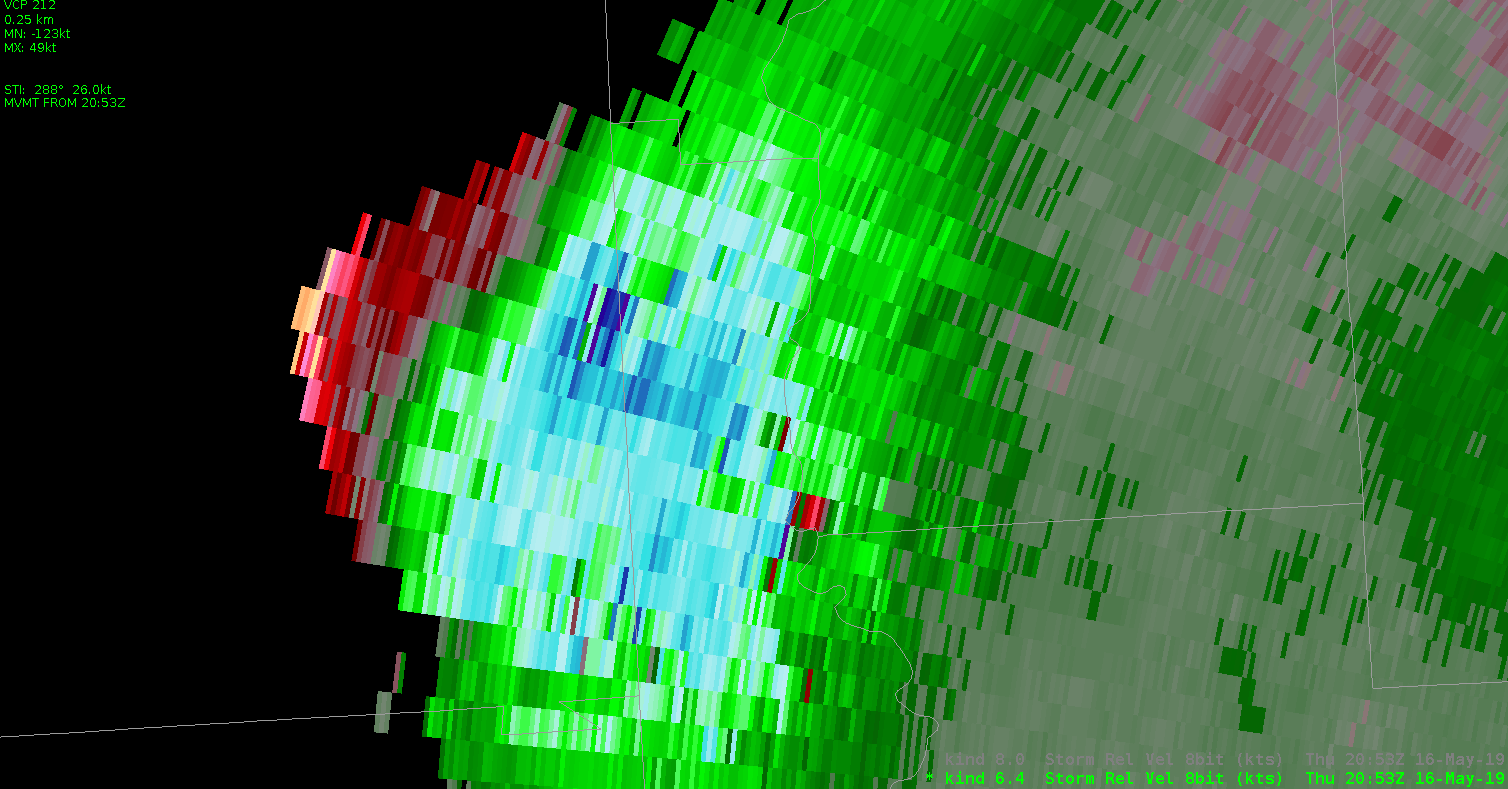
This storm is not diminishing, with Storm Top DIV remaining well over 100kt
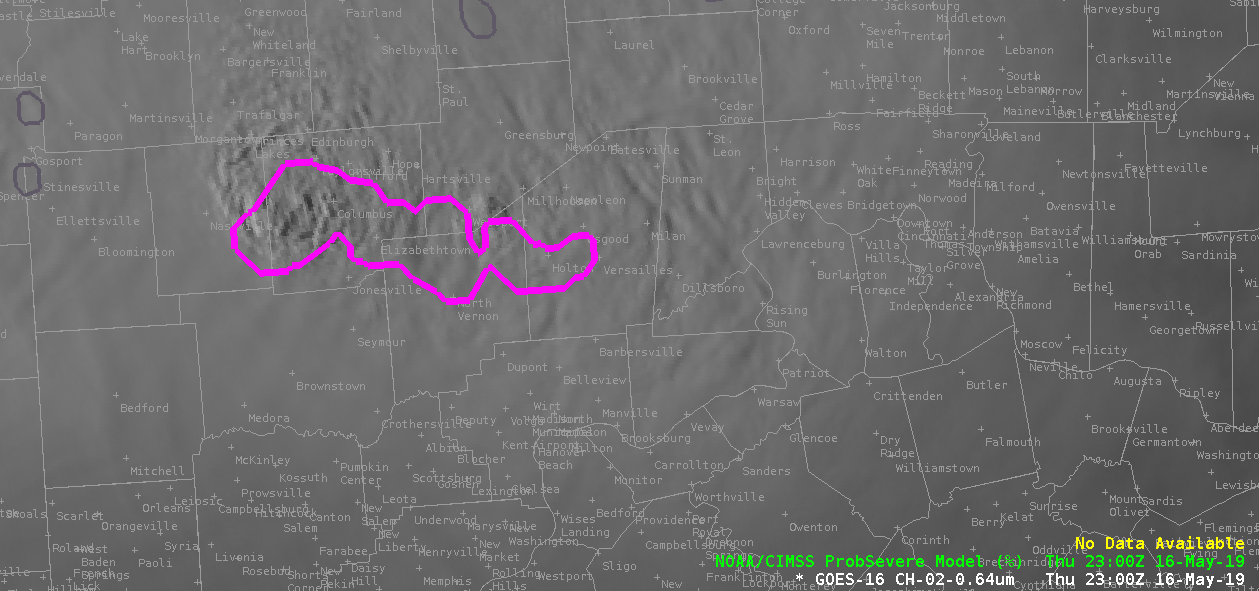
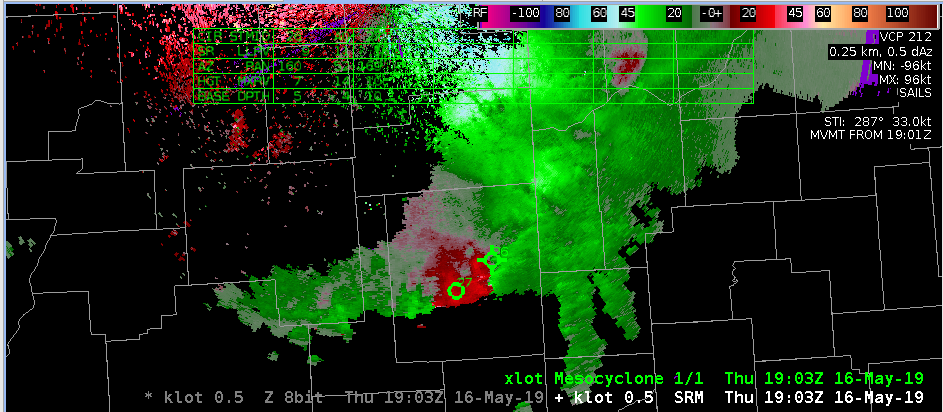
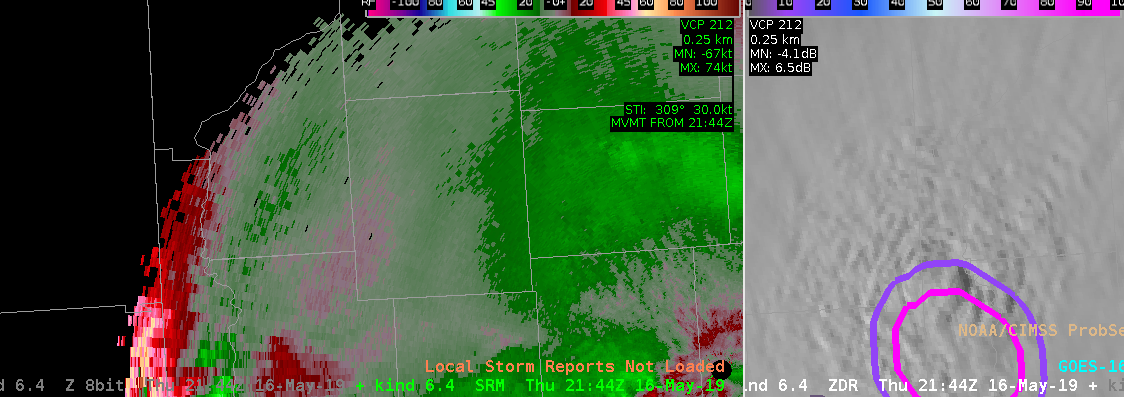
Eastern end of MCS continues to chug thru central IN (2130-2300z), ProbSVR ~ 23z looking good, more warnings on the way

GLM Flash Event Density vs Centroids

Viewing some marginal severe storms in northern Idaho from GOES 17 in this example. In the first image is the traditional Flash Extent Density product. However, have modified the color curve (User -> Awips -> GLM_FED_DC) to provide some enhancement to the lower values as detection efficiency seems to remain lower over ID/MT as we have found in MT/WY in previous days. While this is overall helpful in picking out some stronger storms, the large 8km grid boxes take up a lot of screen real estate when viewing over background satellite imagery.  Also the strongest storms are somewhat lost in the lightning data of the surrounding storms.

As an experiment, tried loading up the Flash Centroid Density Product. By turning on the interpolation and setting the max value to 10, this really helped to isolate and highlight the strongest cells. Of note is the cell moving toward the north, west of Missoula. Picking out the lightning jump in this storm was easier viewed on this Flash Centroid Density product, and comparing its strength to surrounding storms was also easier. It is also helpful that the product has overall small footprint.

— warmbias —

Vertical Data Smearing – the bane of AzShear’s existence

All right, maybe that’s a bit over-dramatic, but at least I got you still reading. I’ve discussed elsewhere the sensitivity we’ve seen with low level AzShear and Rotation Tracks when it comes to surface features such as outflow boundaries or artifacts such ground clutter. Here we see sensitivity to what’s going on above – i.e., velocity data with a high reflectivity mesocyclone aloft being smeared downward with sidelobe contamination. To illustrate…

KIND 3.1 degree Z
KIND 3.1 degree V
KIND 0.5 degree Z
KIND 0.5 degree V

So, it’s fairly evident that velocity is being contaminated down low. Unfortunately, this also affects the AzShear calculations…

Just something else to be aware of…

#MarfaFront

messing around with NUCAPS in the volume browser

A first cut at depicting the added value of the volume browser in AWIPS for NUCAPS soundings is shown below. I messed around with vertical cross-sections and time series of NUCAPS soundings in the upwind area of the MCS in northern IL that is expected to contain some potential for new convective initiation. Below is  the transect of the cross-section.

Here is the cross-section of equivalent potential temperature from NUCAPS at 18Z, NAM-12 at 18Z, and the HRRR at 18Z.

The two models and satellite soundings are in very good agreement at altitudes above 700 hPa, in less agreement between 700 and 850 hPa, and in poor agreement between 850 hPa and the surface. NAM12 is the highest with theta-e values between 336 and 344K, with HRRR about 5-10K colder, and NUCAPS still colder in the SW portion of the cross-section, and slightly warmer in the NE portion of the cross-section than HRRR.  Is it because of temperature or moisture differences?  It appears dominated by moisture discrepancies as shown below:

I can’t quite figure out how to plot additional (or fewer) contours (AWIPS newbie here) but its quite clear that NAM12 is the moistest and NUCAPS is much drier near the surface. The 12Z Quad Cities RAOB had 7-8 g/kg for water vapor mixing ratio but with the six-hour discrepancy it is challenging to establish ground truth.

The volume browser is capable of making time series plots too.  Here is a ring of points depicting time series of 850 hPa temperature lapse rates over the last few days of soundings:

The time series plot is shown below.  A two-day time series of sparse satellite soundings  isn’t all that insightful, but using this for 0-6 hour NUCAPS-FCST products (in comparison to model output) might be quite valuable for forecasters.

Brian Kahn

NMDA QLCS Anticyclonic Meso

A strong anti-cyclonic mid-level meso developed near the southern end of a QLCS south of Chicago (view form KLOX). NMDA did not pick up on this feature. Would definitely want to have this detection since a warning forecaster may not quickly pick-up on a developing mid-level circulation if they are closely watching for low-level mesovortex spinups, and this may be important in hail development as well as focusing and outflow wind surge.

11 minutes later on the 0.5 degree tilt, one the developing rear inflow jet starts to develop, the NMDA keys in the developing low-level cyclonic circulation. However, the additional 11 minutes of being alerted to the developing mid-level meso could help extend warning lead times.

— warmbias —

ProbSevere

Overall impressed with the performance of Prob Severe today. Quick way to distinguish between weak/strong/severe storms. In this example from the high plains of Wyoming, there was an organized storm that Prob Hail spiked to 90% about an hour before the 1.5″ hail report, and remained at elevated to 75% at the time of the hail report. Don’t mind the low (3%) threshold for the ProbTor outline, as it is an easy way to keep that important piece of information quickly viewable by the warning forecaster.

— warmbias —

GLM Weak Convection

On a day with weak convection, it was interesting to watch the Minimum Flash Area and how it related to storm structure. As expected closer to the updraft, smaller flashes were noted, but there is clearly a larger flash that extends out into the anvil area. This is quite the distance from the core of the storms, and thus would have impacts on DSS based services and potential lightning strikes to outdoor events.

Reflectivity, Minimum Flash Area, Average Flash Area, TOE clockwise from top left.