
Flash extent density focused on that storm as well. Prob severe coming up. Had 50 dBZ to 48 kft and ~115 knot Delta V at storm top.
Official websites use .gov
A
.gov website belongs to an official government
organization in the United States.
Secure .gov websites use HTTPS
A
lock (
) or https:// means you’ve safely connected to
the .gov website. Share sensitive information only on official,
secure websites.

Real-time posts made during testbed nowcast and warning operations.
Flash extent density focused on that storm as well. Prob severe coming up. Had 50 dBZ to 48 kft and ~115 knot Delta V at storm top.
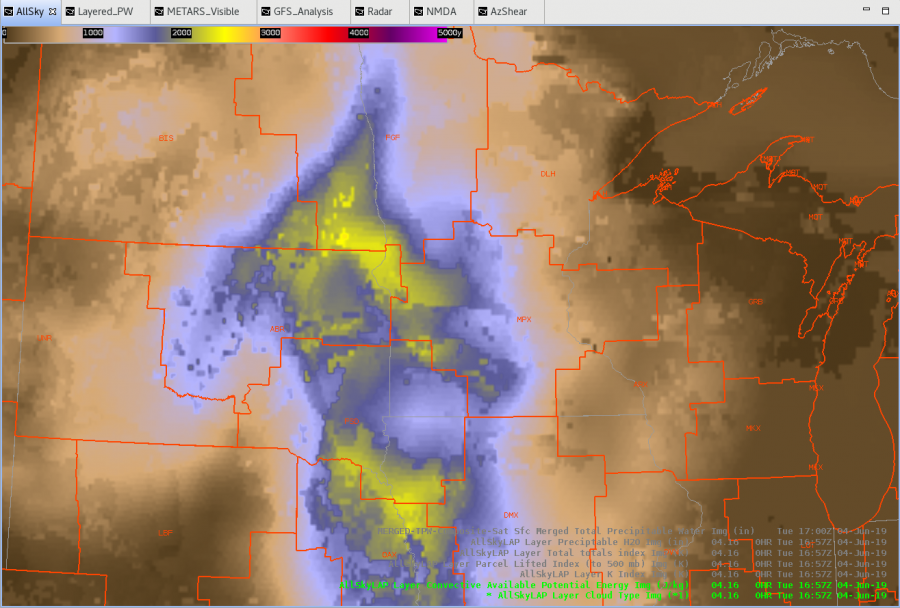
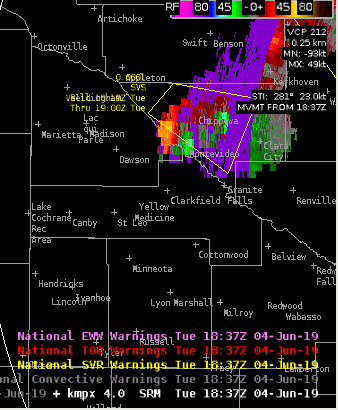
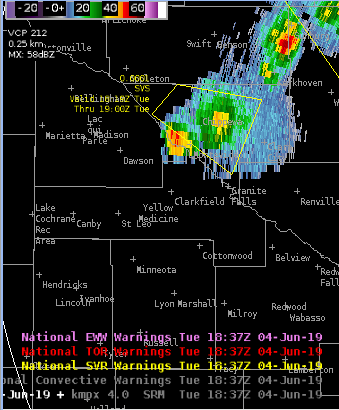
Ongoing complex of thunderstorms pushing into south central MN this hour. Have a new set of thunderstorms forming in what AllSky is showing as a higher CAPE environment along the outflow pushing out from this complex. ProbSevere has picked up on this cell as well (near Milan)…showing a Hail chance of 55% now and growing quickly. Will monitor the downstream growth of both systems.
A storm just northeast of Amarillo developed quickly along a frontal boundary, and quickly showed supercellular characteristics with mid level rotation and a 65+ dbz core reaching about 35 kft MSL. 2 inch hail was reported with this storm during this time. GLM data again shows a decrease in both Flash Extent Density (top right) and Event Density (top left) show a notable decrease in GLM lightning activity while ground based radar remains fairly unchanged, and both the IR satellite presentation (bottom right overlaid on visible imagery) and radar data (not shown) indicate the storm maintained intensity and if anything, had strengthened a bit.
-64BoggsLites
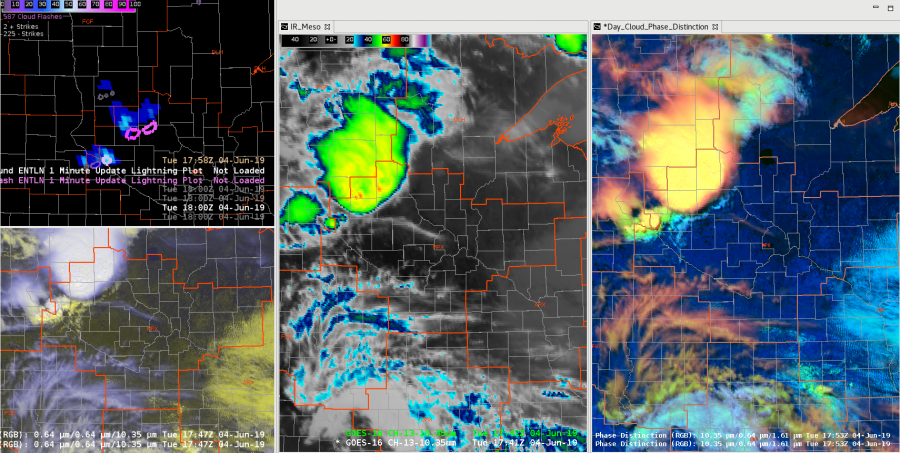
GOES-16 10.3 um IR channel in the lower right panel captured an exceptionally cold overshooting top at -82 C. This occurred toward the beginning of the animation at 2311Z in far northern Oklahoma (south of Coffeyville, KS) and preceded a large jump in the flash extend density (upper left). The minimum flash area did not change much during this loop, so it may be advantageous for this component of GLM to have a higher spatial resolution than what is currently used. The GLM RGB product (upper right) merges the flash extent density, minimum flash area, and 10.3 um cloud top temperatures. A group of bright cyan and white pixels helped highlight where all three of the aforementioned components were maximized. In addition to a substantial increase in the flash extent density 5-10 min following the -82 C cloud top temp., ENTLN ground based lightning flash counts doubled during the same time.
Although the environmental conditions already supported warning on this storm prior to the overshooting top (OT), seeing the FED and ground based lightning double, likely in response to the intense OT, may push a forecaster to upgrade the severity of the warning (larger hail, higher winds etc.) -Roy
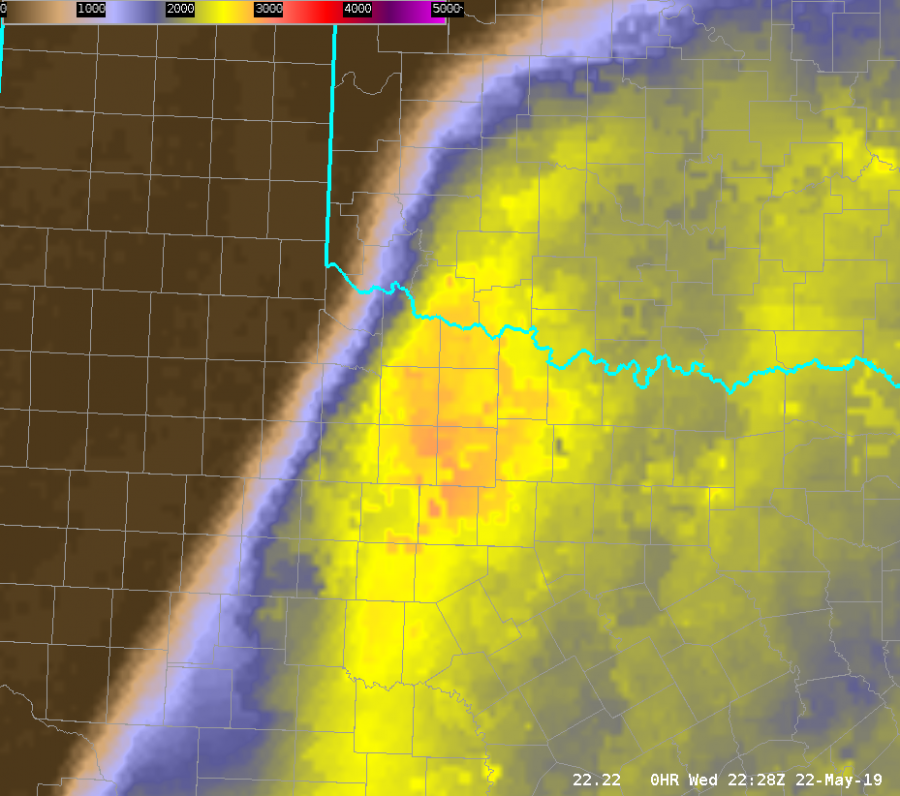
Additional convection was possible over southwest OK and/or northern Texas early this evening. AllSky product depicted a concentrated area of enhanced CAPE just south of the Red River, which is where the most robust CI took place right around 6pm.
Dave Grohl
A loop of GLM products, particularly the Flash Extent Density and the Minimum Flash (top left and bottom right, respectively), appear to have depicted strengthening updrafts in the Tulsa area. In particular, notice the uptick in Flash Extent Density going from Creek to Osage Counties, as well as the area over northwestern Rogers County. The increases in FED coincided with low areas of Minimum Flash Area.
The MRMS -20C Reflectivity product shows the strengthening updrafts over the same time frame:
The GLM products increased confidence in a decision to issue two SVRs.
Ron Dayne
The Prob Severe Product has been very good for guidance today. See an example below.
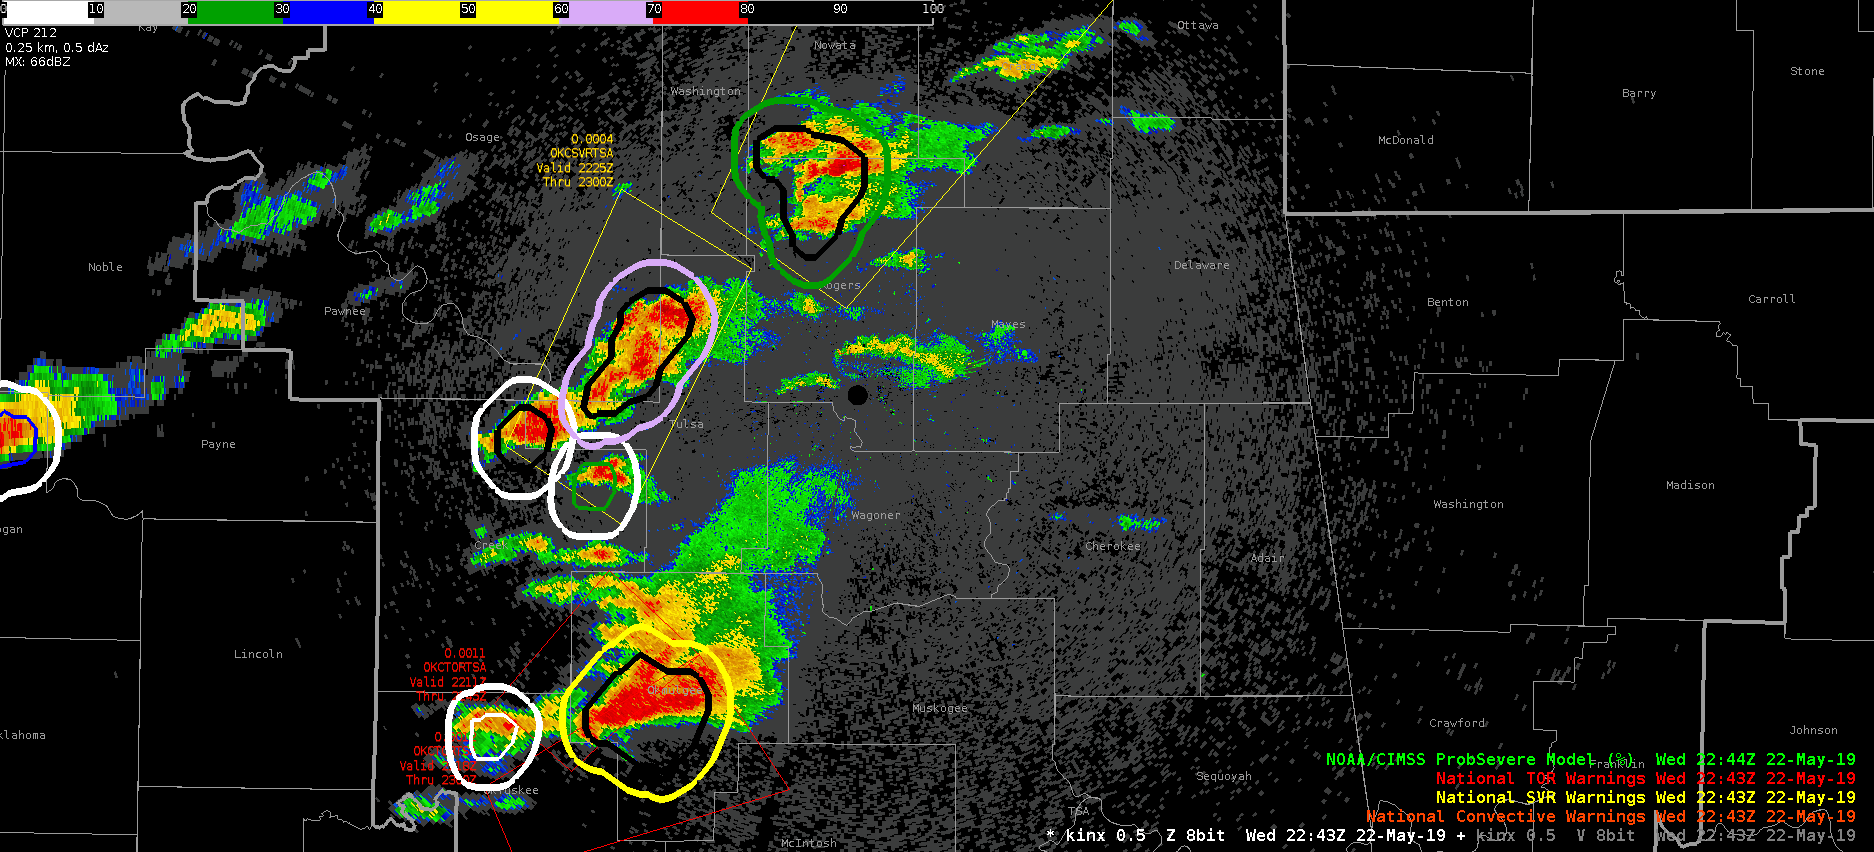
Notice I have used an alternative color scale for the Prob Severe, but every cell with a Prob Severe of 80%+ (in black) was placed under some kind of warning. The prob severe was not the only tool used in the warning decision making process (as usual), but it was very effective in confirming the decision process using the base data.
Thorcaster
On May 22 at around 2130Z, a tornado warning (test) was issued for Okfuskee County in the Tulsa CWA. Besides the usual examination of base velocity data, other tools that were used to help the decision were the merged AzShear products and the CPTI products. Watch the loop below.
In this four-panel, the upper left has the 0-2 km merged AzShear, the upper right has the 3-6 km AzShear, the lower left has the Weak/Strong/Violent CPTI products overlayed on each other, and the lower right has the 0.5 degree base velocity.
At the beginning of the loop, the max 0-2 km AzShear values were .008 s^-1, but increased throughout the loop, eventually reaching .012 s^-1, exceeding the .010 threshold. The 3-6 km AzShear showed a similar trend.
The CPTI product showed a noticeable trend as well. At the beginning of the loop the weak/strong/violent values were 89/11/0 %, respectively. Since most every value of AzShear starts with 100% weak, the values were not overly supportive. However, by the end of the loop, the values were 75/23/2 % respectively, a significant increase in the threat of both strong and violent tornadoes. With the limited experience I have using the product, once the strong gets to 20% or higher, and the violent gets to 2% or higher, it greatly increases the confidence in needing a tornado warning.
Thorcaster
This post is going to compare the significant differences between the modified and unmodified NUCAPS sounding near Tulsa, OK at 19Z on May 22.
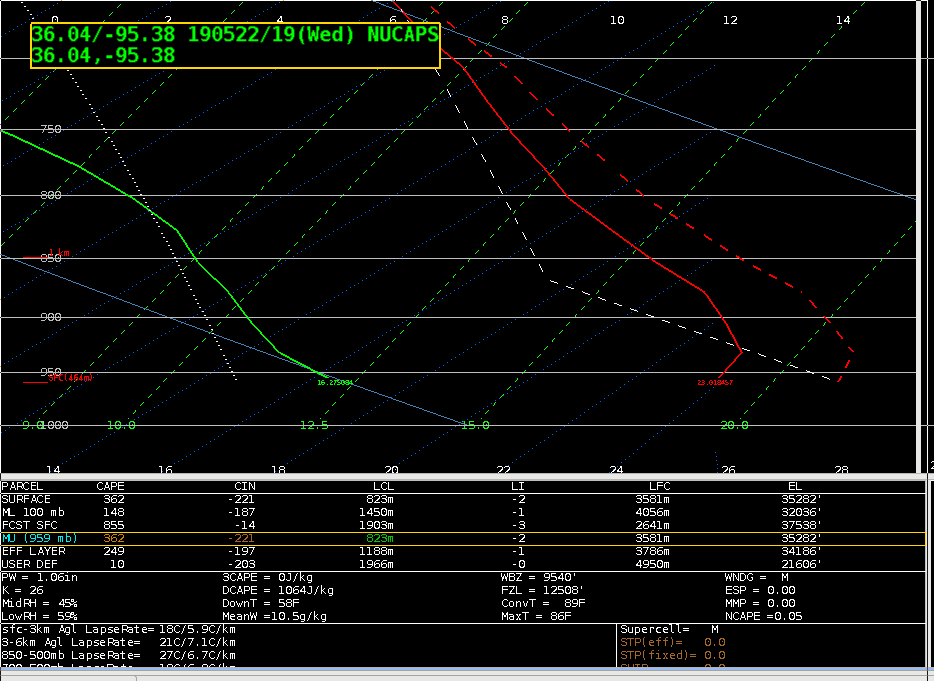
First a look at the unmodified sounding. It actually shows a small temperature inversion near the surface in the boundary layer, with a surface temperature of 75, and a surface dew point of 61. This resulted in a computed surface-based CAPE of 362 J/kg, and a mixed layer CAPE of 148 J/kg. Now let’s look at the NUCAPS sounding modified for the 19Z observed surface temp and dew point.
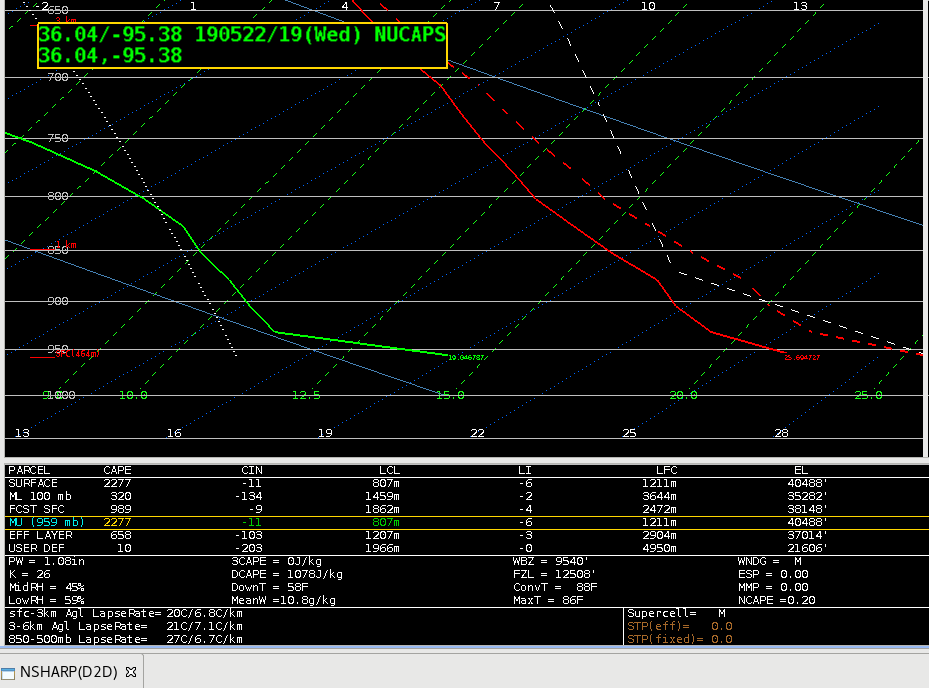
the modified NUCAPS soudning used the surface temp of 78 and surface dew point of 69. This caused a very large difference in the surface-based CAPE, with a value of 2277 J/kg (about 7X the unmodified). The MLCAPE also more than doubled to 328 J/kg. Interestingly, the All Sky CAPE (which is designed to match the MLCAPE more closely then the SBCAPE) at the same time in the same area gave an estimate of 1627 J/kg (not shown). That would indicate that both the modified and unmodified versions significantly underestimated the instability, but the modified gave forecasters a much better idea of the potential based on the much higher SBCAPE.
I also noticed that the mixing process the modified NUCAPS used for the surface observation produces a rather unrealistic near surface profile. I think an improvement in the mixing scheme could improve the use of the modified NUCAPS soundings further. Despite that, the current modified does give a better indication of the convective potential in this case.
Thorcaster
Lightning data in the Texas panhandle late this afternoon showed low correlation between GLM output and data from ground based lightning networks. The output from the GLM flash extent density product appears underdone when compared to data from ENTLN, which has numerous areas of clustering in the vicinity of stronger thunderstorm updrafts. Meanwhile, the GLM flash extent density data shows low values and not much variance within the same general vicinity. The problem does not appear as significant in western Oklahoma where the GLM flash extent density product shows much higher values in concert with clustering in the ENTLN data. It is difficult to pinpoint what might be causing this issue just by looking at the data alone.  Dave Grohl